

Standardized Whole Blood Assay and Bead-Based Cytokine Profiling Reveal Commonalities and Diversity of the Response to Bacteria and TLR Ligands in Cattle
- PMID: 35677047
- PMCID: PMC9169910
- DOI: 10.3389/fimmu.2022.871780
Standardized Whole Blood Assay and Bead-Based Cytokine Profiling Reveal Commonalities and Diversity of the Response to Bacteria and TLR Ligands in Cattle
Abstract
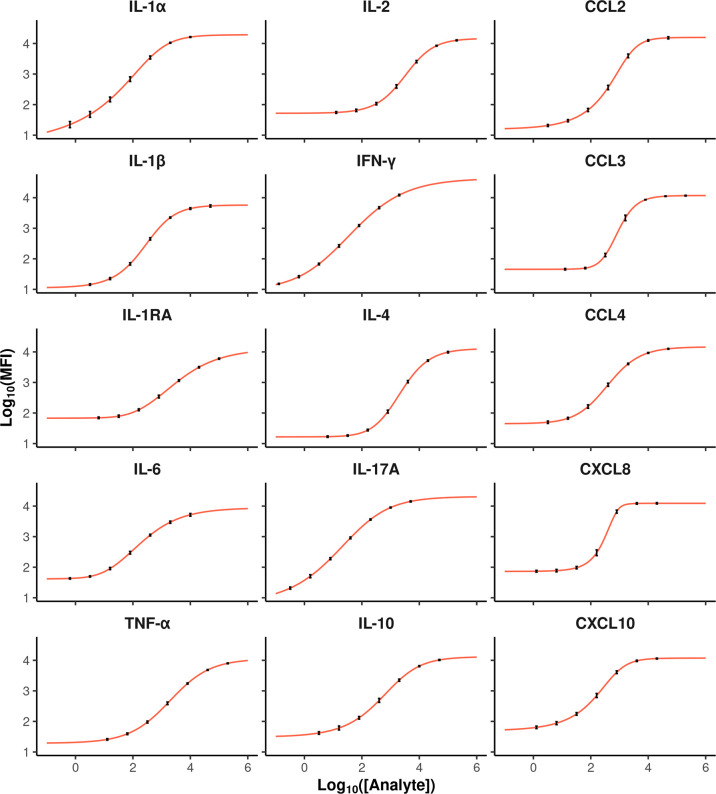
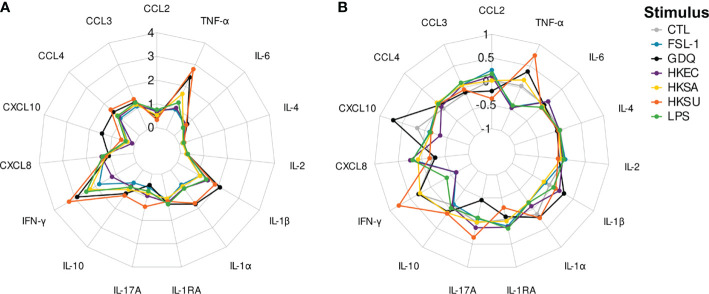
Recent developments in multiplex technologies enable the determination of a large nu\mber of soluble proteins such as cytokines in various biological samples. More than a one-by-one determination of the concentration of immune mediators, they permit the establishment of secretion profiles for a more accurate description of conditions related to infectious diseases or vaccination. Cytokine profiling has recently been made available for bovine species with the development of a Luminex® technology-based 15-plex assay. Independently from the manufacturer, we evaluated the bovine cytokine/chemokine multiplex assay for limits of detection, recovery rate, and reproducibility. Furthermore, we assessed cytokine secretion in blood samples from 107 cows upon stimulation with heat-killed bacteria and TLR2/4 ligands compared to a null condition. Secretion patterns were analyzed either using the absolute concentration of cytokines or using their relative concentration with respect to the overall secretion level induced by each stimulus. Using Partial Least Square-Discriminant Analysis, we show that the 15-cytokine profile is different under Escherichia coli, Staphylococcus aureus, and Streptococcus uberis conditions, and that IFN-γ, IL-1β, and TNF-α contribute the most to differentiate these conditions. LPS and E. coli induced largely overlapping biological responses, but S. aureus and S. uberis were associated with distinct cytokine profiles than their respective TLR ligands. Finally, results based on adjusted or absolute cytokine levels yielded similar discriminative power, but led to different stimuli-related signatures.
Keywords: MAMPs; bacteria; bead-based assay; cattle; cytokine; inflammation; whole blood stimulation.
Copyright © 2022 Lesueur, Walachowski, Barbey, Cebron, Lefebvre, Launay, Boichard, Germon, Corbiere and Foucras.
Conflict of interest statement
The authors declare that the research was conducted in the absence of any commercial or financial relationships that could be construed as a potential conflict of interest.
Figures


Similar articles
-
Substantial heterogeneity of inflammatory cytokine production and its inhibition by a triple cocktail of toll-like receptor blockers in early sepsis.Front Immunol. 2023 Oct 5;14:1277033. doi: 10.3389/fimmu.2023.1277033. eCollection 2023. Front Immunol. 2023. PMID: 37869001 Free PMC article.
-
Immune hyporeactivity to bacteria and multiple TLR-ligands, yet no response to checkpoint inhibition in patients just after meeting Sepsis-3 criteria.PLoS One. 2022 Aug 18;17(8):e0273247. doi: 10.1371/journal.pone.0273247. eCollection 2022. PLoS One. 2022. PMID: 35981050 Free PMC article.
-
Staphylococcus aureus and Escherichia coli elicit different innate immune responses from bovine mammary epithelial cells.Vet Immunol Immunopathol. 2013 Oct 1;155(4):245-52. doi: 10.1016/j.vetimm.2013.08.003. Epub 2013 Aug 24. Vet Immunol Immunopathol. 2013. PMID: 24018311
-
In vivo lipopolysaccharide exposure of human blood leukocytes induces cross-tolerance to multiple TLR ligands.J Immunol. 2009 Jul 1;183(1):533-42. doi: 10.4049/jimmunol.0802189. J Immunol. 2009. PMID: 19542464
-
Host-response patterns of intramammary infections in dairy cows.Vet Immunol Immunopathol. 2011 Dec 15;144(3-4):270-89. doi: 10.1016/j.vetimm.2011.08.022. Epub 2011 Sep 10. Vet Immunol Immunopathol. 2011. PMID: 21955443 Review.
Cited by
-
Alpha-linolenic acid modulates systemic and adipose tissue-specific insulin sensitivity, inflammation, and the endocannabinoid system in dairy cows.Sci Rep. 2023 Mar 31;13(1):5280. doi: 10.1038/s41598-023-32433-7. Sci Rep. 2023. PMID: 37002295 Free PMC article.
-
Combining accelerometers and direct visual observations to detect sickness and pain in cows of different ages submitted to systemic inflammation.Sci Rep. 2023 Feb 3;13(1):1977. doi: 10.1038/s41598-023-27884-x. Sci Rep. 2023. PMID: 36737469 Free PMC article.
-
Local and systemic cytokine profiles in children with pneumonia-associated lung consolidation.Front Immunol. 2025 May 8;16:1546730. doi: 10.3389/fimmu.2025.1546730. eCollection 2025. Front Immunol. 2025. PMID: 40406149 Free PMC article.
-
Methods integrating innate and adaptive immune responses in human in vitro immunization assays.Front Immunol. 2025 May 21;16:1584852. doi: 10.3389/fimmu.2025.1584852. eCollection 2025. Front Immunol. 2025. PMID: 40469296 Free PMC article. Review.
-
Measuring cytokines in Eurasian tundra reindeer (Rangifer tarandus tarandus) with a bovine bead-based multiplex immunoassay and real-time PCR.Acta Vet Scand. 2025 Jun 18;67(1):34. doi: 10.1186/s13028-025-00819-4. Acta Vet Scand. 2025. PMID: 40533814 Free PMC article.
References
Publication types
MeSH terms
Substances
Supplementary concepts
LinkOut - more resources
Full Text Sources
Research Materials