[Preprint]. 2022 Jun 2:rs.3.rs-1690086.
doi: 10.21203/rs.3.rs-1690086/v1.

RNA polymerase inaccuracy underlies SARS-CoV-2 variants and vaccine heterogeneity

Affiliations

RNA polymerase inaccuracy underlies SARS-CoV-2 variants and vaccine heterogeneity

Catherine C Bradley et al. Res Sq. .

Update in

Abstract

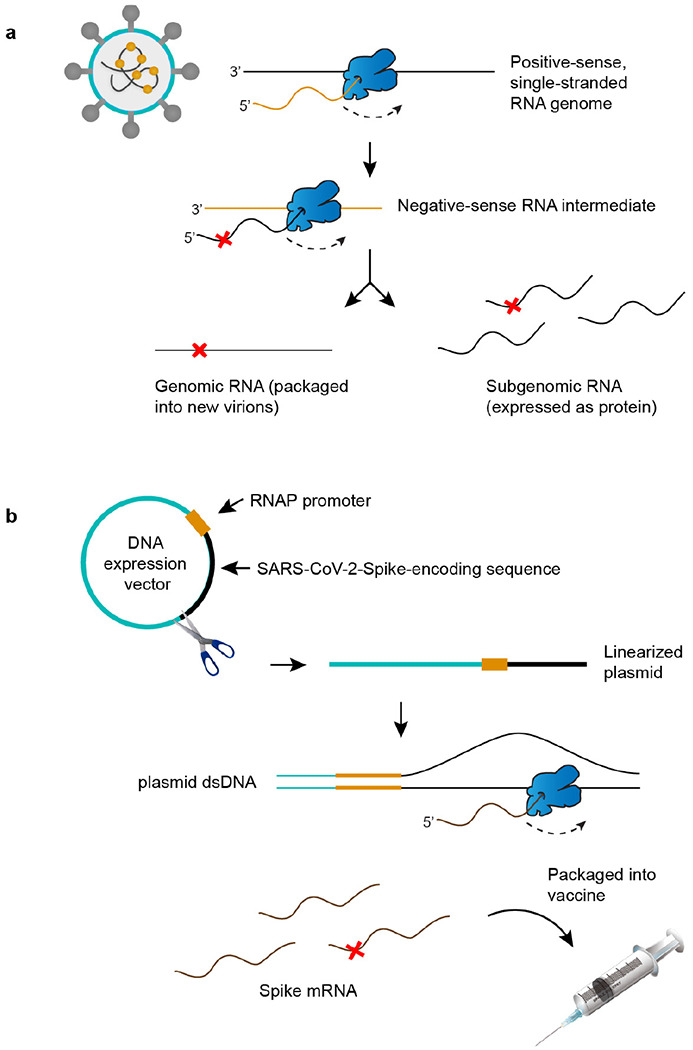
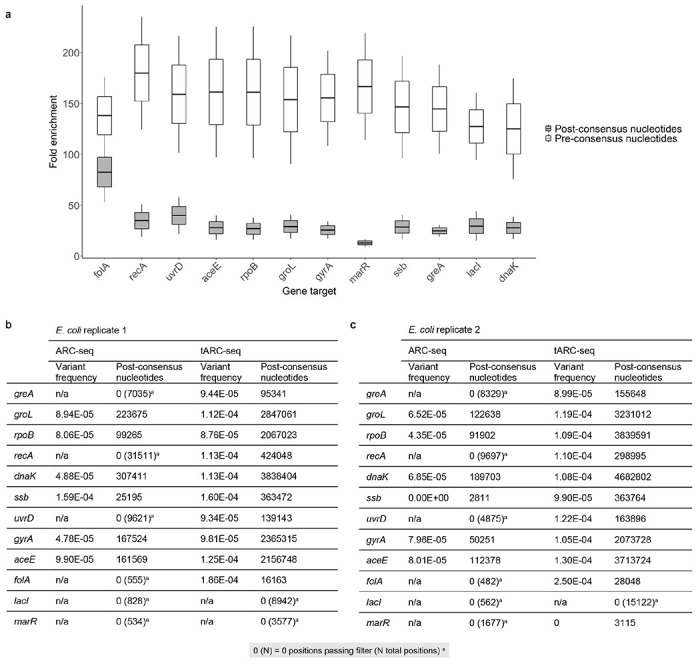
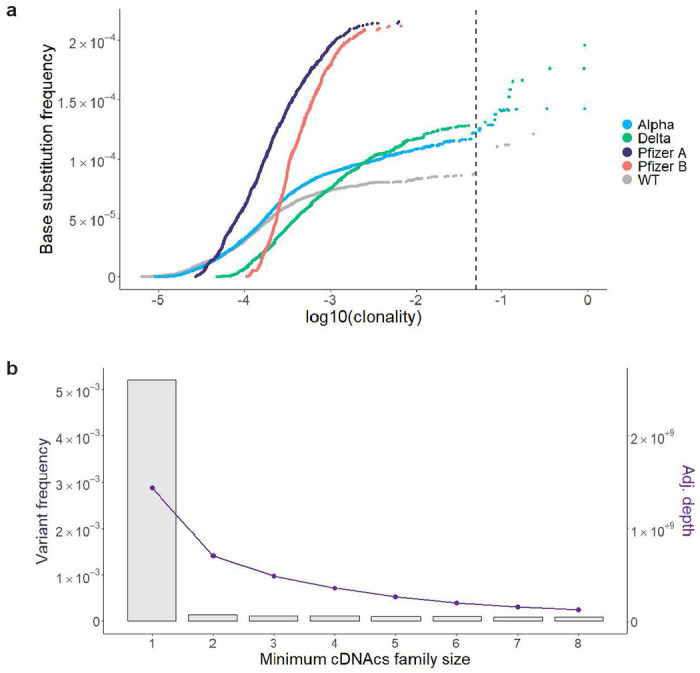
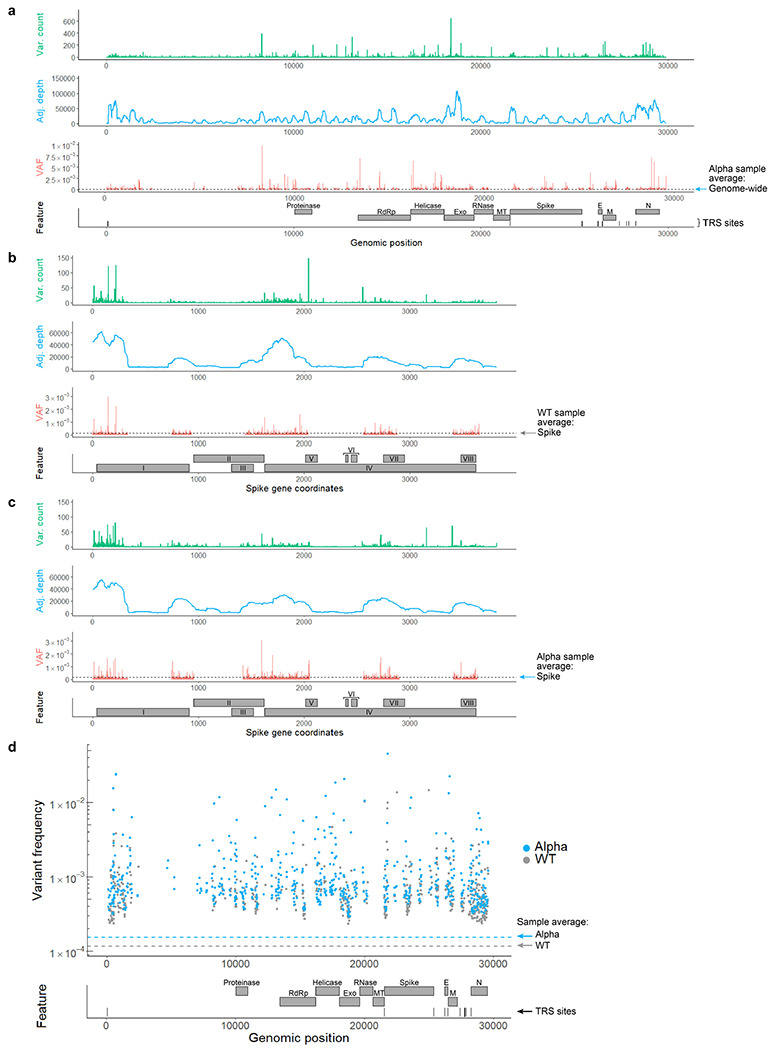
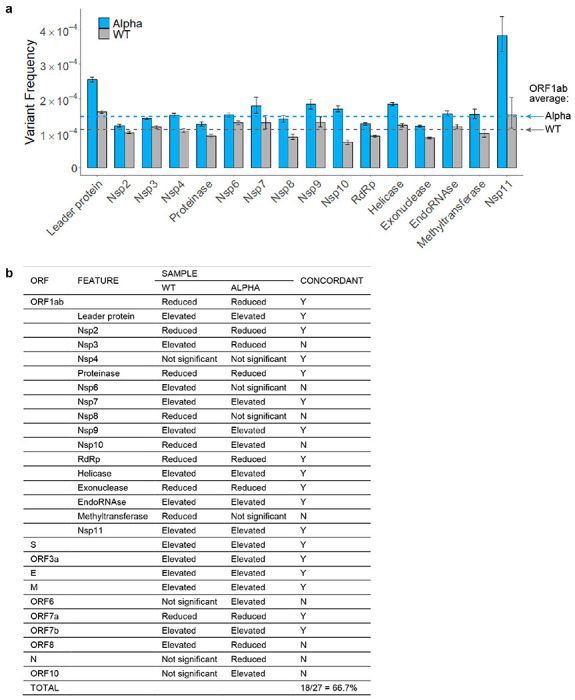
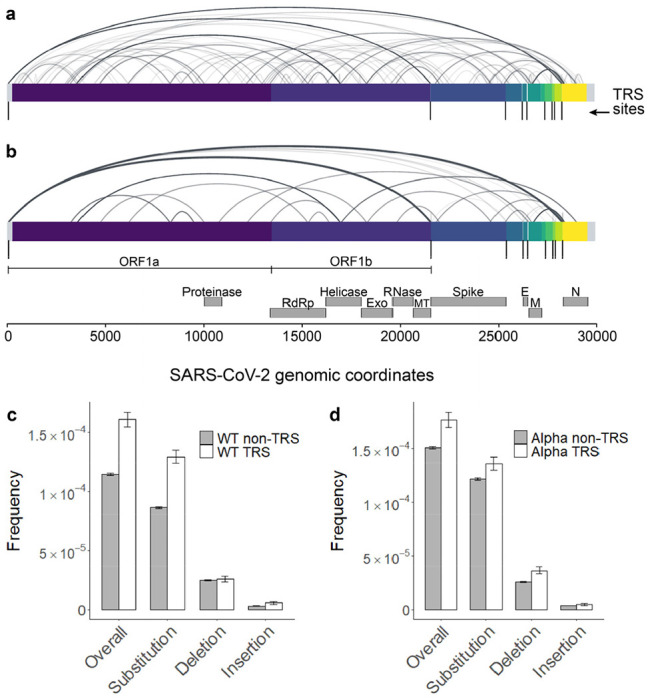
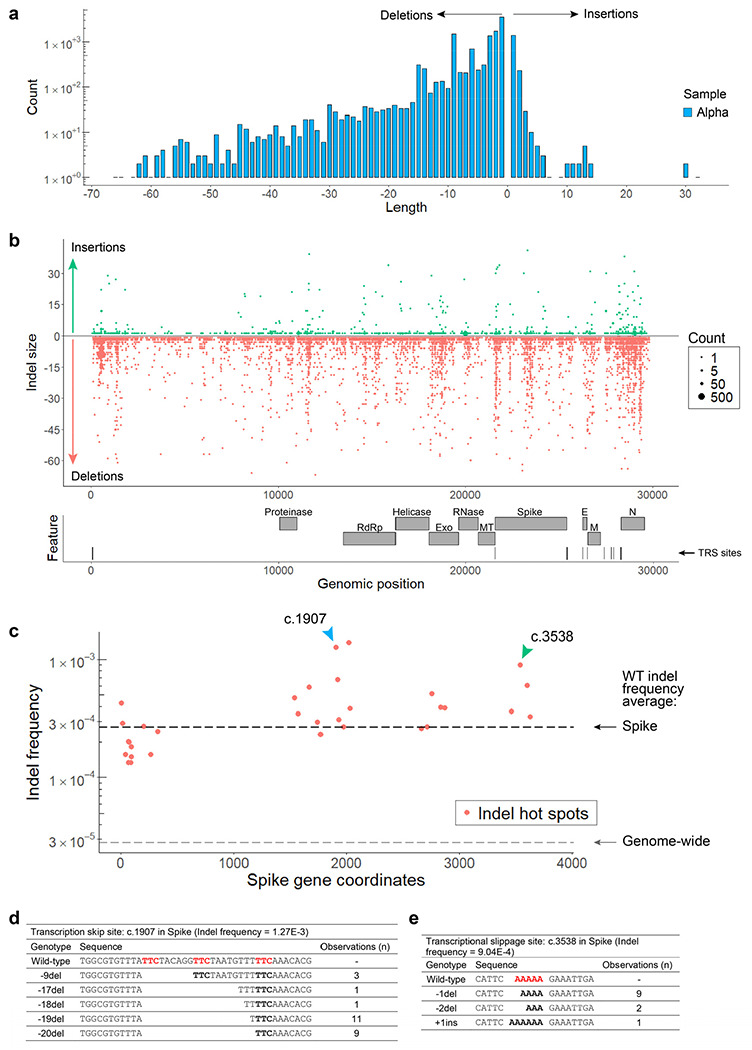
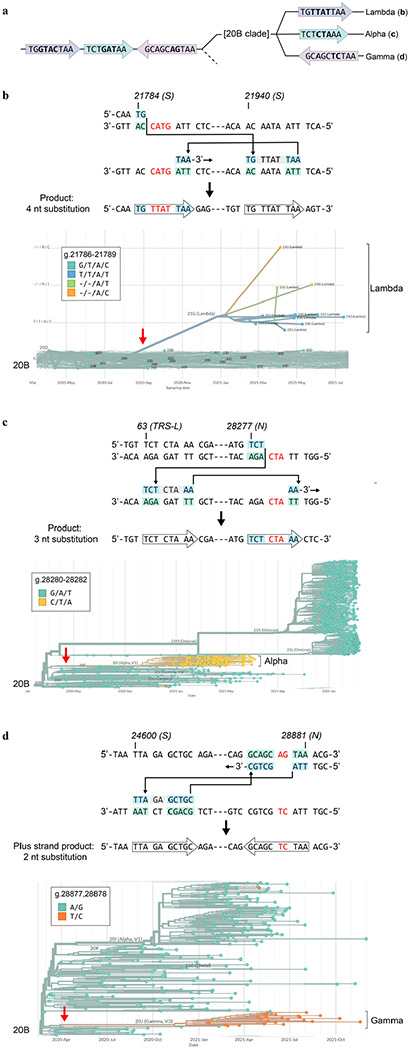
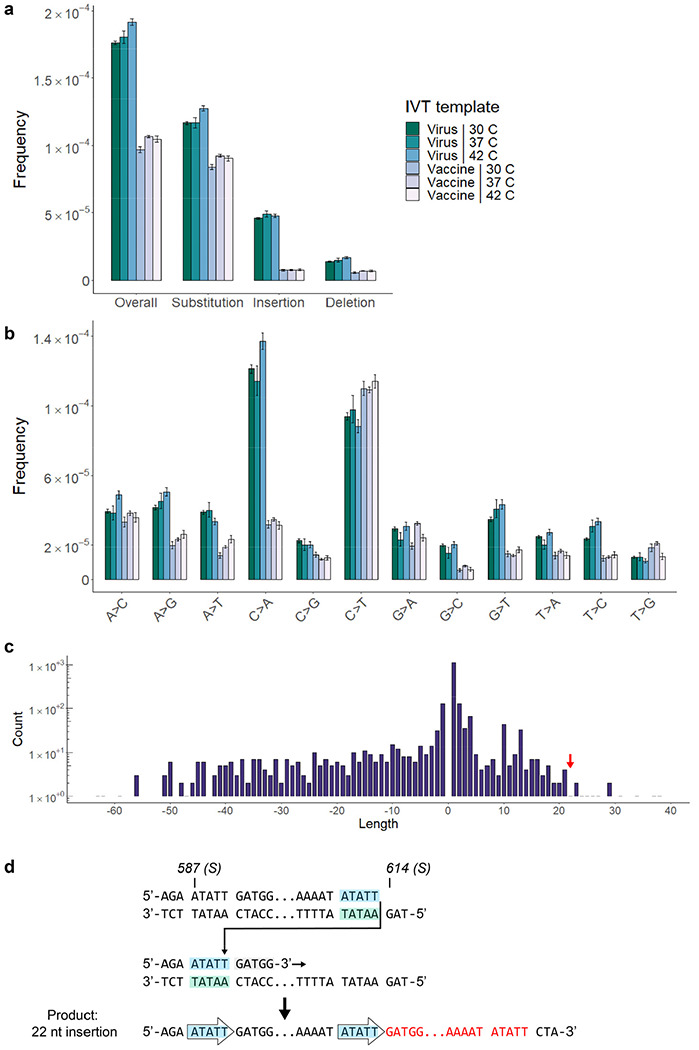
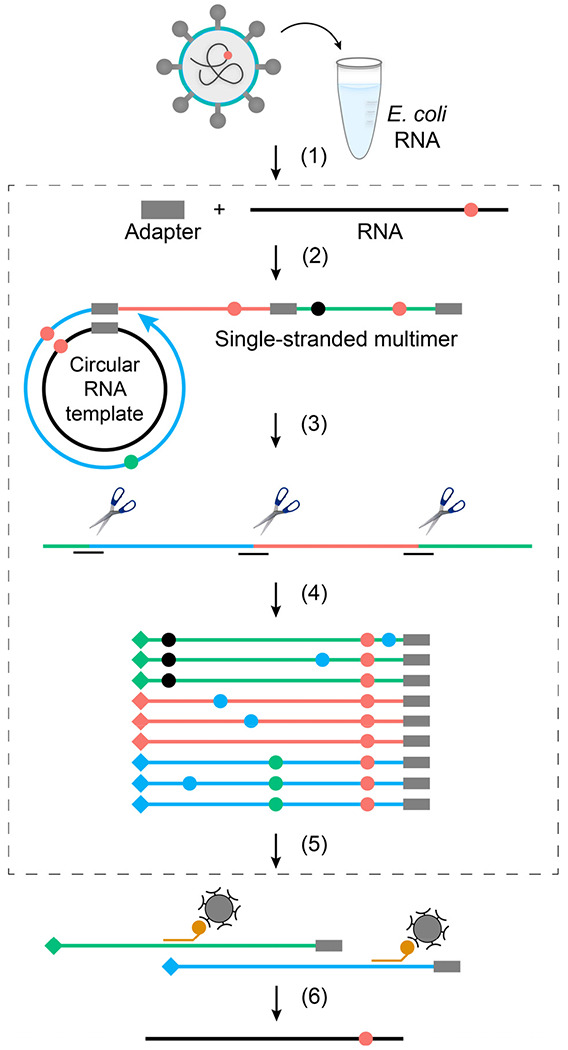
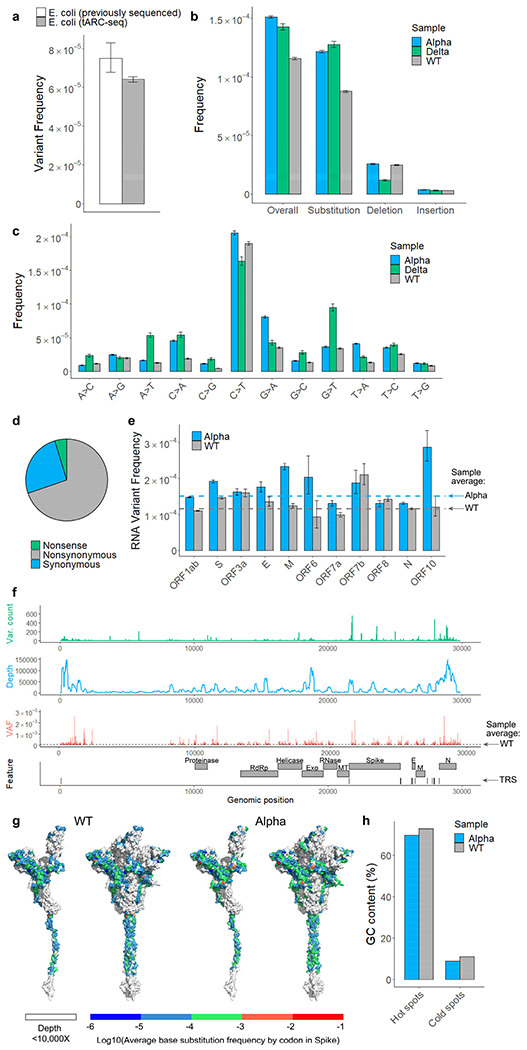
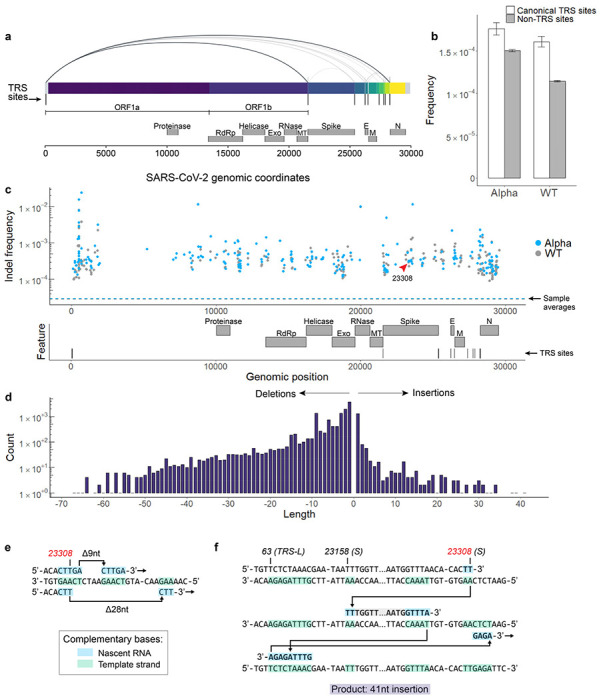
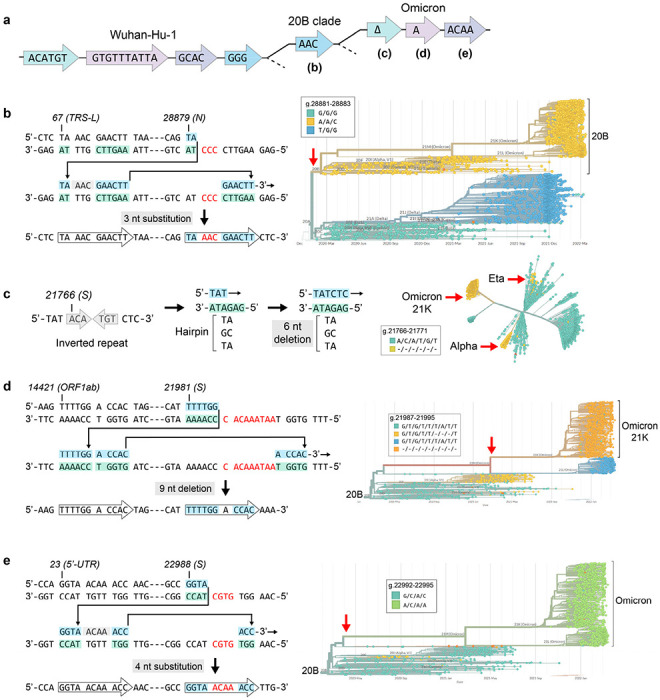
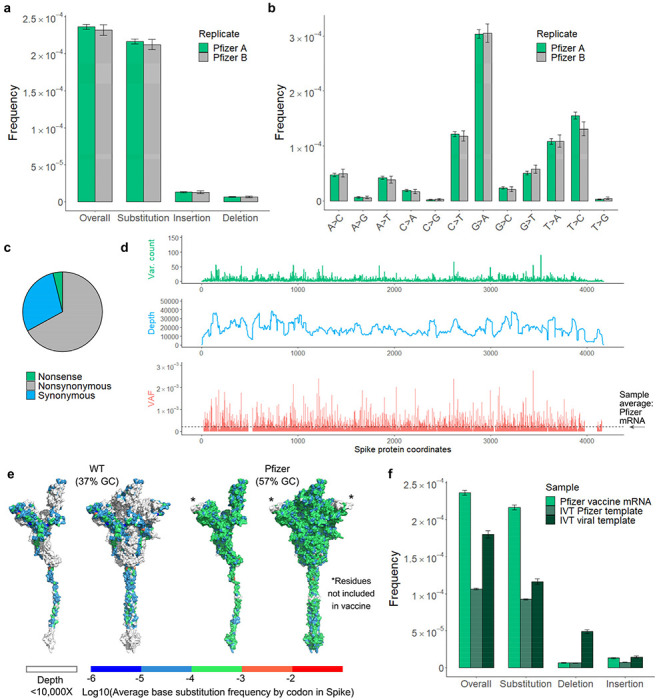
Both the SARS-CoV-2 virus and its mRNA vaccines depend on RNA polymerases (RNAP)1,2; however, these enzymes are inherently error-prone and can introduce variants into the RNA3. To understand SARS-CoV-2 evolution and vaccine efficacy, it is critical to identify the extent and distribution of errors introduced by the RNAPs involved in each process. Current methods lack the sensitivity and specificity to measure de novo RNA variants in low input samples like viral isolates3. Here, we determine the frequency and nature of RNA errors in both SARS-CoV-2 and its vaccine using a targeted Accurate RNA Consensus sequencing method (tARC-seq). We found that the viral RNA-dependent RNAP (RdRp) makes ~1 error every 10,000 nucleotides - higher than previous estimates4. We also observed that RNA variants are not randomly distributed across the genome but are associated with certain genomic features and genes, such as S (Spike). tARC-seq captured a number of large insertions, deletions and complex mutations that can be modeled through non-programmed RdRp template switching. This template switching feature of RdRp explains many key genetic changes observed during the evolution of different lineages worldwide, including Omicron. Further sequencing of the Pfizer-BioNTech COVID-19 vaccine revealed an RNA variant frequency of ~1 in 5,000, meaning most of the vaccine transcripts produced in vitro by T7 phage RNAP harbor a variant. These results demonstrate the extraordinary genetic diversity of viral populations and the heterogeneous nature of an mRNA vaccine fueled by RNAP inaccuracy. Along with functional studies and pandemic data, tARC-seq variant spectra can inform models to predict how SARS-CoV-2 may evolve. Finally, our results may help improve future vaccine development and study design as mRNA therapies continue to gain traction.


Conflict of interest statement

Competing interests The authors declare no competing interests.

Figures

Extended Data Figure 1 |
Extended Data Figure 1 |. Origins of RNA variants in SARS-CoV-2 virus and its mRNA vaccines.
a, As a positive-strand RNA virus, SARS-CoV-2 encodes an RNA polymerase (RNAP, in blue) that is responsible for both replication and gene expression. RNAP errors (red ‘X’) generate genetic diversity in SARS-CoV-2 and fuel the evolution of novel strains. b, Pfizer-BioNTech COVID-19 vaccine production begins with a SARS-CoV-2-Spike-encoding sequence that is GC-enriched and codon-optimized. The template is placed downstream of the T7 promoter in a plasmid expression vector and linearized for in vitro transcription (IVT). T7 RNAP errors during IVT generate sequence diversity in mRNA vaccines. Needle syringe art attributed to DataBase Center for Life Science.
Extended Data Figure 2 |
Extended Data Figure 2 |. Validation of tARC-seq in E. coli.
a, tARC-seq achieves >30-fold enrichment in post-consensus nucleotides across a 12-gene panel in E. coli (n=2). PCR duplicates account for most of the pre-consensus nucleotides sequenced, and fold-enrichment drops during consensus calling as duplicates of the same parent RNA fragment are collapsed into a single read. The drop in enrichment between pre- and post-consensus reads is more pronounced for low-expression genes like marR. This reflects both the efficacy of probe binding and the scarcity of marR transcripts. Fold enrichment was calculated from the cumulative, normalized sequencing depth across each gene in tARC-seq samples versus matched bulk ARC-seq controls. b-c, RNA variant frequency analysis by gene is poorly powered using the original ARC-seq method. Coverage is highly variable between targets leading to inaccurate estimates of the true variant frequency. Combining ARC-seq with hybrid capture (tARC-seq) significantly enriches for reads across a 12-gene panel in E. coli, increasing the statistical power of the study (n=2, reported separately).
Extended Data Figure 3 |
Extended Data Figure 3 |. Empirical validation of tARC-seq data analysis parameters.
a, In contrast to de novo variants, clonal and subclonal variants are not independent events and should be filtered out during analysis. They typically arise from a single RdRp error and are subsequently propagated through viral replication, inflating the true error frequency. To determine an appropriate cutoff, all variants were graphed by the cumulative base substitution frequency as a function of each variant’s clonality. Relatively few clonal outliers were discovered in the Pfizer vaccine compared to viral samples. A cutoff of 0.05 – or ≤5% allele fraction – counted most variants on the curve while excluding clonal outliers. b, The overall variant frequency (left y-axis, grey bars) in WT SARS-CoV-2 is graphed by consensus read depth (right y-axis, purple line) over a series of minimum cDNAcs family sizes (minmem2). Minmem2 is an expression of the minimum number of PCR copies required to form a cDNA consensus sequence during consensus calling. A family size of 1 is equivalent to traditional RNA-seq without error correction, while a family size of 3 was previously found to sufficiently correct for technical artifacts.
Extended Data Figure 4 |
Extended Data Figure 4 |. Variant frequencies at RNA editing motifs.
Cytosine residues across the SARS-CoV-2 genome have high rates of C>T variants. Frequencies are further elevated at RNA editing motifs, suggesting that APOBEC and ADAR activity may mutagenize viral transcripts and genomes in vivo.
Extended Data Figure 5 |
Extended Data Figure 5 |. RNA variant frequencies by position in WT and Alpha SARS-CoV-2.
a, A genome-wide map of variant counts, sequencing depth and variant frequencies by position in the Alpha isolate (VAF = variant allele fraction). b-c, Mapping positional base substitution frequencies across the S gene. Feature legend: (I) N-terminal domain, (II) Receptor-binding domain, (III) Receptor-binding motif, (IV) Subdomains 1-2, (V) S1/S2 cleavage region, (VI) Fusion peptides, (VII) Heptad repeat 1, (VIII) Heptad repeat 2. Most variants cluster in the N-terminal domain, downstream of the TRS site for Spike. d, Hot spots for RNA variants in both WT and Alpha are mapped by genomic position and feature. These loci had significantly elevated variant frequencies compared to the genome-wide average (p-value <0.05 by Fisher’s exact test with Benjamini-Hochberg correction). Positions were filtered for depth ≥ 10,000 to reduce skew in low coverage regions.
Extended Data Figure 6 |
Extended Data Figure 6 |. RNA variant frequencies by feature in WT and Alpha SARS-CoV-2.
a, Among nonstructural features in ORFlab, variant frequencies were significantly elevated in the leader protein. However, regions encoding critical enzymes like RdRp, exonuclease, and proteinase were relatively protected. Error bars represent 95% Wilson confidence intervals. b, The various ORFs and features were previously graphed by variant frequency (panel a above, and Fig. 2e). Functional regions with significantly elevated or reduced frequencies relative to the sample average are indicated here (p-value <0.05 by Fisher’s exact test with Benjamini–Hochberg correction). Column 5 indicates whether the results from each region were concordant between Alpha and WT, with overall agreement exceeding 66%. As with the calculations for hot and cold spots, differences in sequencing depth between samples, particularly for smaller regions, can impact the results.
Extended Data Figure 7 |
Extended Data Figure 7 |. Interaction between transcription regulatory sequences and RdRp fidelity.
tARC-seq detected chimeric junctions between canonical TRSs in WT SARS-CoV-2 (Fig. 3a). a, However, many of the observed junctions lay outside canonical regions, suggesting non-programmed template switching by a promiscuous polymerase. b, While tARC-seq has the sensitivity to detect single events, the data was filtered further to include only high confidence junctions with ≥100 observations. Even after increasing the stringency to remove potential ligation artifacts (Fig. 1, step 2), many non-canonical junctions remained. Each arc represents a chimeric alignment where the left and right x-intercepts correspond to the 5’ and 3’ junction coordinates and line shading reflects frequency. c-d, While TRS regions comprise only ~3.5% of the SARS-CoV-2 genome, they incur RNA variants at a higher frequency in both WT and Alpha virus. Each TRS region (n=10) is small (<115 nt) and composed of one canonical TRS site plus 100 flanking nucleotides.
Extended Data Figure 8 |
Extended Data Figure 8 |. Characterizing indel hot spots in SARS-CoV-2.
a, In Alpha, single nucleotide insertions and deletions predominate with additional peaks around multiples of 3 that preserve the reading frame, as expected. Many large indels suggestive of RdRp template switching were also observed. b, Indels are mapped by size (y-axis) and count (dot size) across the SARS-CoV-2 genome. Promiscuous RdRp activity at skip sites fuels a diverse repertoire of indels detectable by tARC-seq at a single locus. c, Indel hot spots observed in WT virus across the S gene are graphed by coordinate and frequency. Overall, Spike had higher rates of indels compared to the genome-wide average. d-e, The spectrum of indels at two particular hot spots (c.1907 and c.3538, indicated by colored arrows) are reviewed in detail. d, With adjacent regions of microhomology (red) to drive local template switching, an array of large deletions was discovered at c.1907. This position was also identified as an indel hot spot in the Alpha variant and many of the same deletions (−9del, −18del, −19del, −20del) were observed in that sample. This pattern is suggestive of a transcription skip site where the sequence and local genome architecture promote RNAP template switching and high variant frequencies. Interestingly, none of the large deletions we found at c.1907 in Spike, including the in-frame events, are seen in pandemic data, suggesting they are deleterious. In support of this, Nextstrain data shows this region to be highly conserved across SARS-CoV-2 lineages and other members of the Coronaviridae family. e, Homopolymeric nucleotide runs (red) can also trigger indel hot spots through transcriptional slippage events, as shown at c.3858 in Spike. Hot spots represent positions with significantly elevated indel frequencies as determined by Fisher’s exact test (p-value <0.05 with Benjamini–Hochberg correction).
Extended Data Figure 9 |
Extended Data Figure 9 |. RdRp template switching drives genomic epidemiology during the COVID-19 pandemic.
Variant-specific multiple nucleotide alterations can be modeled as singular RdRp template switching events based on 3’ micro-complementarity that facilitates RdRp misalignments/realignments. a, Phylogenetic tree based on sequence alterations observed in variants arising from the 20B clade; not drawn to any scale. The different colors indicate variant-specific nucleotide alterations. b-d, Top panels, proposed template switching models that explain multiple nucleotide alterations in the Lambda, Alpha, and Gamma lineages. Bottom panels, phylogenetic trees that establish the singular origin of the coordinated multiple nucleotide alterations in each lineage. Phylogenetic trees were constructed in Nextstrain v2.35.0 from genomes sequenced between Dec. 2019 and March 2022.
Extended Data Figure 10 |
Extended Data Figure 10 |. RNA variants across T7 in vitro transcription reaction conditions.
a-b, Spectrum of RNA variants from a series of T7 in vitro transcription reactions. Two templates are compared in parallel: the S gene from WT SARS-CoV-2 (virus), and the GC-enriched Spike-encoding sequence from Pfizer (vaccine). Reactions were performed using a commercial T7 RNAP kit over a range of active temperatures (30, 37, 42 C). c, A broad distribution of indels is seen in IVT transcripts from the viral Spike template at 37 C. As with RdRp in vivo, many large events appear to be mediated by RNAP template switching. d, A 22 nt insertion observed in IVT transcripts (red arrow, panel c) is modeled by microhomology-mediated template switching. (Insertion sequence: ATATTGATGGTTATTTTAAAAT).
Figure 1 |
Figure 1 |. Library preparation for tARC-seq.
(1) SARS-CoV-2 RNA is added to a carrier and the sample is fragmented. (2) Fragments are ligated to barcoded adapters, circularized and primed for rolling-circle reverse-transcription. (3) The resulting cDNA multimers are restriction digested into monomer copies. (4) Sequencing adapters and additional barcodes () are added through subsequent PCR steps. (5) SARS-CoV-2 reads are enriched through hybrid capture, followed by post-capture PCR. (6) Final library is sequenced, reads are organized into families by barcode, and collapsed into consensus sequences. This process of error correction removes technical artifacts (●) and identifies true RNA variants () that occur at the same position across duplicates. The non-targeted sister protocol to tARC-seq is outlined in grey (steps 2-4, 6).
Figure 2 |
Figure 2 |. Spectrum and frequency of RNA variants in SARS-CoV-2.
a, tARC-seq reproduces known variant frequencies in E. coli. b, RNA variants were measured in ancestral SARS-CoV-2 (WT), the B.1.1.7 lineage (Alpha), and the B.1.617.2 lineage (Delta) using tARC-seq. Variants occurred at a frequency of 1.16 x 10⁻⁴ in WT virus, with higher rates observed in both Alpha and Delta. c, RNA variants were dominated by C>T and G>A transitions. d, Most variants are nonsynonymous. e, Genes encoding structural proteins like Spike show higher variant frequencies (Fisher exact test). f, Mapping variant allele fractions (VAF) by position across the SARS-CoV-2 genome reveals an uneven landscape. g, Base substitution frequencies by codon mapped against Spike protein illustrate the distribution of hot and cold spots for RNA variants. h, RNA variant hot spots show strong GC bias in vivo. Error bars represent Wilson score 95% confidence intervals. For analysis, a maximum 5% clonality cutoff was applied to the data and positions were filtered for ≥50X depth. A more stringent depth filter (≥10,000X) was applied to the position-wise analyses (f, g) to minimize skewing due to inadequate sampling.
Figure 3 |
Figure 3 |. RdRp template switching at sites of sequence complementarity models rare events in SARS-CoV-2.
a, Using a spliced aligner (STAR) for mapping, chimeric reads are detected in WT virus. Recurrent jumps between canonical TRSs are visualized as arcs connecting the 5’ and 3’ ends of each chimeric junction. These jumps signify programmed RdRp template switching that functions in viral gene expression. b, TRS regions had a higher RNA variant frequency compared to control regions in both WT and Alpha, suggesting that programmed polymerase jumping reduces overall fidelity in these regions. c, Among other low-fidelity regions are indel hot spots, or loci with significantly elevated frequencies of insertions and deletions. Indel hot spots are calculated by Fisher exact test, filtered for ≥10,000X depth, and graphed by position for both Alpha and WT. d, The size spectrum of insertions and deletions in WT virus reveals rare, large events, many of which appear templated from within the SARS-CoV-2 genome. e, f, Templated indels can be explained by non-programmed RdRp jumping and realignment at sites of sequence complementarity outside of canonical TRSs. Three events from tARC-seq data are modeled, all occurring at the same indel hot spot in the S gene (g.23308, indicated by the red arrow in panel c). The full sequence of the 41-nt insertion (f) is: TGGTTAAAAACAAATGTGTCAATTTCAACTTCAATGGTTTA.
Figure 4 |
Figure 4 |. On the origin of Omicron.
Pandemic data shows that many complex mutations in SARS-CoV-2 appeared suddenly (red arrows). They likely did not accumulate gradually but were driven by a single event: RdRp template switching. In the events modeled here, 3’ complementarity facilitates the misalignment and realignment of RdRp, creating complex mutations that have fueled viral evolution. a, Phylogenetic tree based on sequence alterations that define the 20B and Omicron clades; not drawn to any scale. Discrete, coordinated nucleotide alterations are coded by color, and each template switching event is mapped out below (b-e). b, A GGG>AAC mutation in the N gene occurred once early in the pandemic and helped define the 20B clade. c, A small hairpin in S has spawned the same 6-nt deletion on more than 3 separate occasions, while other single events are specific to Omicron (d-e). Phylogenetic trees were constructed in Nextstrain v2.35.0 from genomes sequenced between Dec. 2019 and March 2022.
Figure 5 |
Figure 5 |. Spectrum and frequency of RNA variants in the Pfizer-BioNTech COVID-19 mRNA vaccine.
Total ARC-seq was applied to SARS-CoV-2 Spike mRNA purified from the Pfizer-BioNTech COVID-19 vaccine to assess the fidelity of T7 RNA polymerase in vaccine production. a, The variant frequency for vaccine mRNA is 2.24 x 10⁻⁴ (n=2). Samples come from separate vials (labeled Pfizer “A” and “B”) of the same lot. G>A transition was the dominant event subtype in vaccine samples (b) and most variants were nonsynonymous (c). Overall, the type of variants observed in Spike differs between vaccine and viral samples. d, e, Positional frequencies are less variable and fewer hot spots are observed in the vaccine (VAF = variant allele fraction). f, Compared to T7 IVT transcripts, vaccine mRNA has significantly more variants, and high GC content was associated with fewer polymerase errors in vitro. Analysis as in Figure 2.

Similar articles

References

Main references

    1. Snijder E. J., Decroly E. & Ziebuhr J. Chapter Three - The Nonstructural Proteins Directing Coronavirus RNA Synthesis and Processing. in Advances in Virus Research (ed. Ziebuhr J.) vol. 96 59–126 (Academic Press, 2016). - PMC - PubMed
    1. Sahin U., Karikó K. & Türeci Ö. mRNA-based therapeutics--developing a new class of drugs. Nat Rev Drug Discov 13, 759–780 (2014). - PubMed
    1. Bradley C. C., Gordon A. J. E., Halliday J. A. & Herman C. Transcription fidelity: New paradigms in epigenetic inheritance, genome instability and disease. DNA Repair (Amst) 81, 102652 (2019). - PMC - PubMed
    1. Bar-On Y. M., Flamholz A., Phillips R. & Milo R. SARS-CoV-2 (COVID-19) by the numbers. Elife 9, e57309 (2020). - PMC - PubMed
    1. Muik A. et al. Neutralization of SARS-CoV-2 Omicron by BNT162b2 mRNA vaccine-elicited human sera. Science 375, 678–680 (2022). - PMC - PubMed

Methods references

    1. Hadfield J. et al. Nextstrain: real-time tracking of pathogen evolution. Bioinformatics 34, 4121–4123 (2018). - PMC - PubMed
    1. Harcourt J. et al. Severe Acute Respiratory Syndrome Coronavirus 2 from Patient with Coronavirus Disease, United States. Emerg Infect Dis 26, 1266–1273 (2020). - PMC - PubMed
    1. Rio D. C., Ares M., Hannon G. J. & Nilsen T. W. Purification of RNA Using TRIzol (TRI Reagent). Cold Spring Harb Protoc 2010, pdb.prot5439 (2010). - PubMed
    1. Stead M. B. et al. RNAsnap™: a rapid, quantitative and inexpensive, method for isolating total RNA from bacteria. Nucleic Acids Res 40, e156 (2012). - PMC - PubMed
    1. Reverse Engineering the source code of the BioNTech/Pfizer SARS-CoV-2 Vaccine. Bert Hubert’s writings https://berthub.eu/articles/posts/reverse-engineering-source-code-of-the... (2020).

Publication types