. 2022 May 18;5(2):ooac041.
doi: 10.1093/jamiaopen/ooac041. eCollection 2022 Jul.

Evaluation of a machine learning approach utilizing wearable data for prediction of SARS-CoV-2 infection in healthcare workers

Affiliations

Evaluation of a machine learning approach utilizing wearable data for prediction of SARS-CoV-2 infection in healthcare workers

Robert P Hirten et al. JAMIA Open. .

Abstract

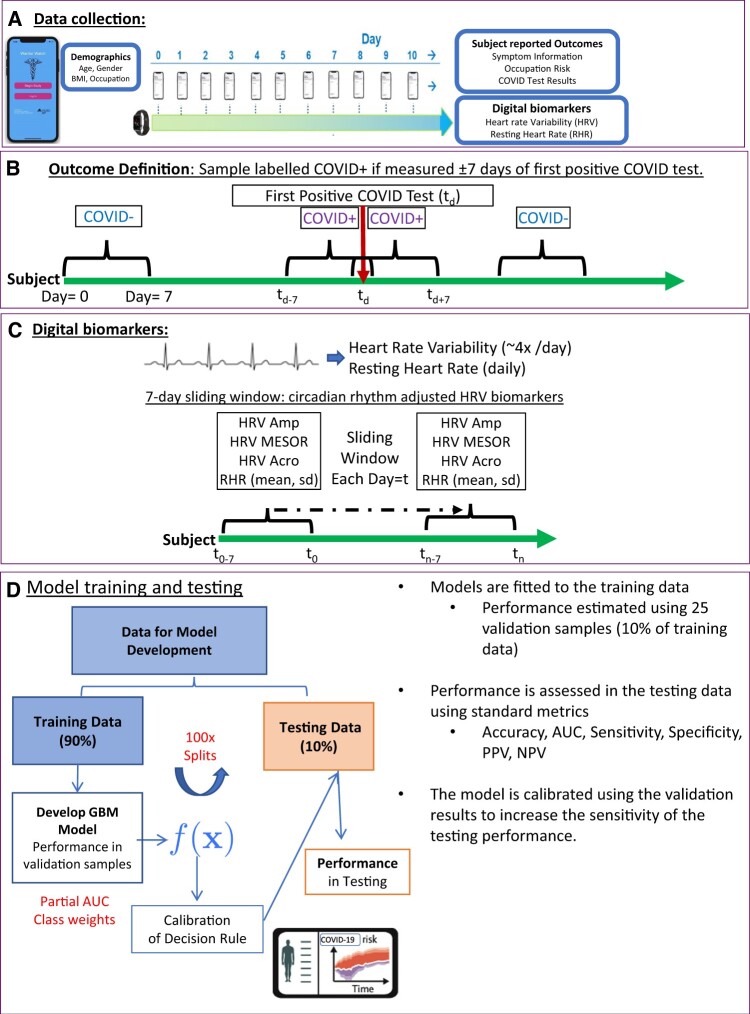
Objective: To determine whether a machine learning model can detect SARS-CoV-2 infection from physiological metrics collected from wearable devices.

Materials and methods: Health care workers from 7 hospitals were enrolled and prospectively followed in a multicenter observational study. Subjects downloaded a custom smart phone app and wore Apple Watches for the duration of the study period. Daily surveys related to symptoms and the diagnosis of Coronavirus Disease 2019 were answered in the app.

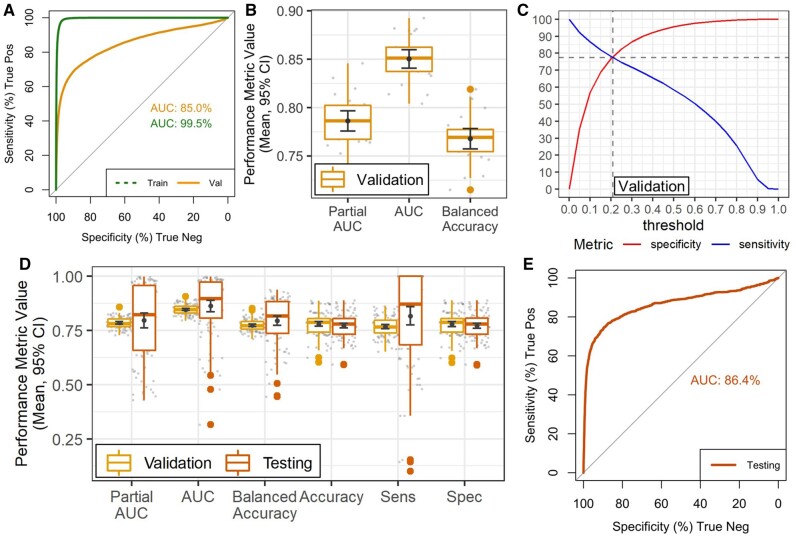
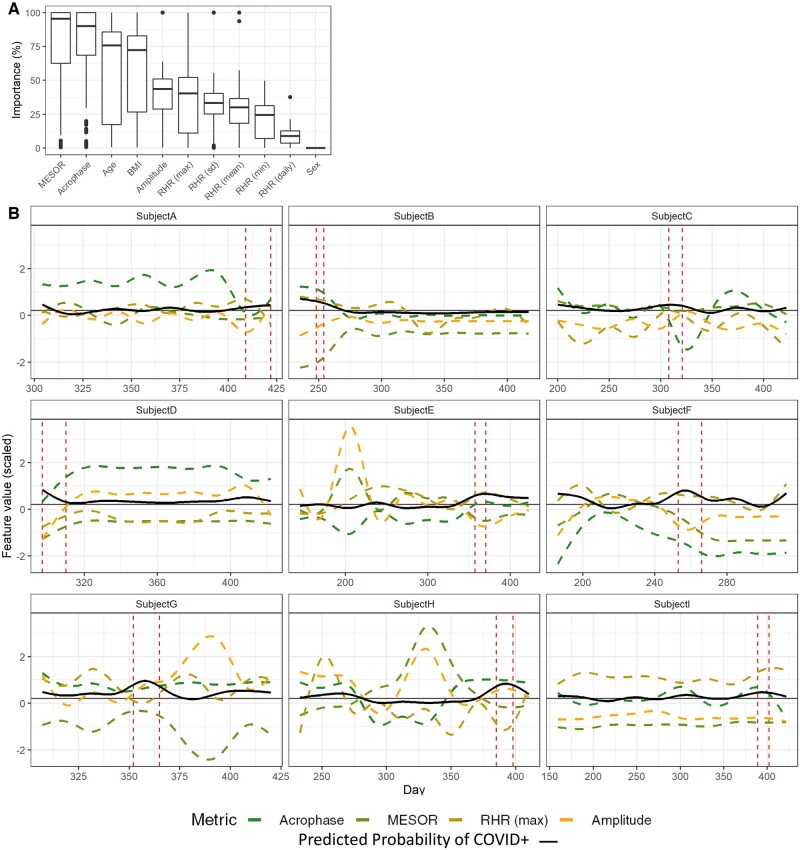
Results: We enrolled 407 participants with 49 (12%) having a positive nasal SARS-CoV-2 polymerase chain reaction test during follow-up. We examined 5 machine-learning approaches and found that gradient-boosting machines (GBM) had the most favorable validation performance. Across all testing sets, our GBM model predicted SARS-CoV-2 infection with an average area under the receiver operating characteristic (auROC) = 86.4% (confidence interval [CI] 84-89%). The model was calibrated to value sensitivity over specificity, achieving an average sensitivity of 82% (CI ±∼4%) and specificity of 77% (CI ±∼1%). The most important predictors included parameters describing the circadian heart rate variability mean (MESOR) and peak-timing (acrophase), and age.

Discussion: We show that a tree-based ML algorithm applied to physiological metrics passively collected from a wearable device can identify and predict SARS-CoV-2 infection.

Conclusion: Applying machine learning models to the passively collected physiological metrics from wearable devices may improve SARS-CoV-2 screening methods and infection tracking.

Keywords: COVID-19; apple watch; coronavirus; machine learning; wearable device.


Figures

Figure 1.
Figure 1.
General Strategy for training and testing statistical classifiers. Diagram illustrating the general strategy for developing the statistical classifier. (A) Subjects wore smartwatches that collect measurements of HRV and RHR. Subjects answer daily surveys to provide health outcomes including COVID test results. (B) Each day each subject is labeled as either; COVID+ if observation was made within ±7 days of the patients first positive COVID-19 test, otherwise the observation is labeled COVID−. (C) HRV measurements were too sparse to estimate HRV COSINOR parameters (MESOR, Amplitude, and Acrophase) for each day, thus, we estimated smoothed parameters using a 7-day sliding window. RHR (mean, standard deviation, minimum, and maximum) was also estimated over this window. (D) The data were split into 100 training and testing sets, models were fit to the training data and performance was estimated using 10-fold CV. 10-CV predictions were used define a decision rule that increases sensitivity, this decision rule was applied to the predictions in the testing data to get the final performance. COVID-19: Coronavirus Disease 2019; CV: cross-validation; HRV: heart rate variability; RHR: resting heart rate.
Figure 2.
Figure 2.
Model performance in training and testing data. (A) ROC curve and AUC over all training and validation samples. (B) Boxplots show distribution of validation performance metrics in over all 100 training sets. (C) Plot shows specificity (red, upward sloping line) and sensitivity (blue, downward sloping line) at different response thresholds for all validation samples, a threshold ∼0.21 achieved a sensitivity of 77% and a specificity of 78%. (D) Boxplots show distribution of performance metrics over all 100 training and test sets using the 0.21 threshold decision rule. (E) ROC curve and AUC over all testing samples. AUC: area under the curve; ROC: receiver operating characteristic.
Figure 3.
Figure 3.
Changes in HRV parameters and model predictions over time. (A) Box plots show the importance of each variable selected by the GBM models over all 100 training sets. (B) Line plots show daily measurements of HRV parameters (Acrophase, MESOR, and Amplitude), and Maximum resting heart rate, as well as the probability of infection (black, solid line) predicted by the model. Feature values are centered, scaled and smoothed to facilitate comparison. Daily measurements for 9 subjects are shown, predictions for each of these 9 subjects all had AUC > 65% in validation. Vertical red-dashed lines indicate the infection window for each patient, horizontal gray solid line indicates the .18 probability threshold used for the decision rule. AUC: area under the curve; GBM: gradient-boosting machines; HRV: heart rate variability.

References

    1. Huang C, Wang Y, Li X, et al. Clinical features of patients infected with 2019 novel coronavirus in Wuhan, China. Lancet 02 2020; 395 (10223): 497–506. - PMC - PubMed
    1. He X, Lau EHY, Wu P, et al. Temporal dynamics in viral shedding and transmissibility of COVID-19. Nat Med 2020; 26 (5): 672–5. - PubMed
    1. Anand NM, Liya DH, Pradhan AK, et al. A comprehensive SARS-CoV-2 genomic analysis identifies potential targets for drug repurposing. PLoS One 2021; 16 (3): e0248553. - PMC - PubMed
    1. Hirten RP, Stanley S, Danieletto M, et al. Wearable devices are well accepted by patients in the study and management of inflammatory Bowel disease: a survey study. Dig Dis Sci 2020; 66 (6): 1836–44. - PubMed
    1. Li X, Dunn J, Salins D, et al. Digital health: tracking physiomes and activity using wearable biosensors reveals useful health-related information. PLoS Biol 2017; 15 (1): e2001402. - PMC - PubMed

LinkOut - more resources