. 2022 May 23:13:872335.
doi: 10.3389/fphar.2022.872335. eCollection 2022.

Impedance-Based Phenotypic Readout of Transporter Function: A Case for Glutamate Transporters

Affiliations

Impedance-Based Phenotypic Readout of Transporter Function: A Case for Glutamate Transporters

Hubert J Sijben et al. Front Pharmacol. .

Abstract

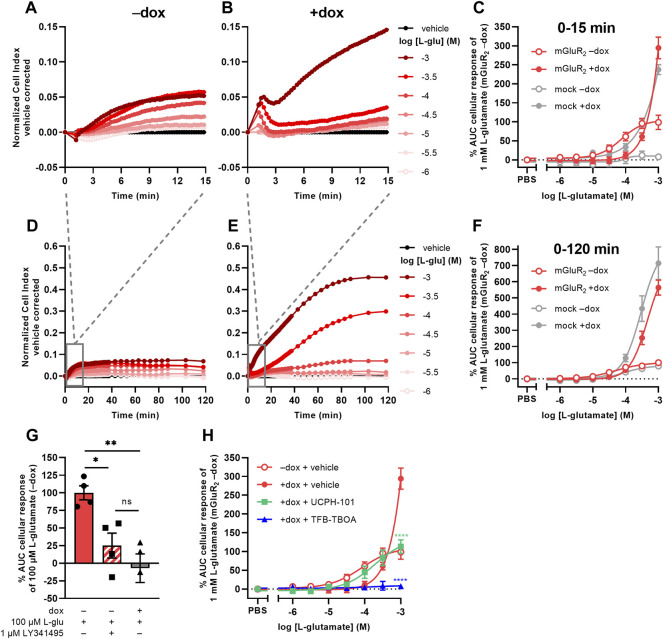
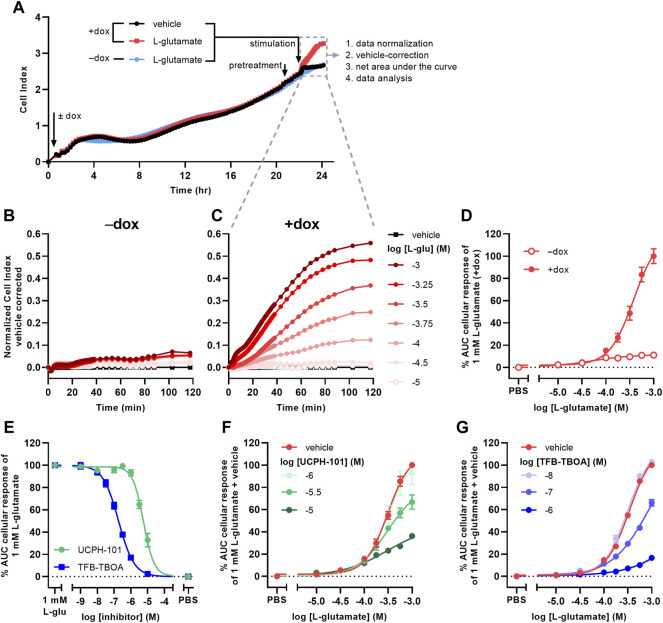
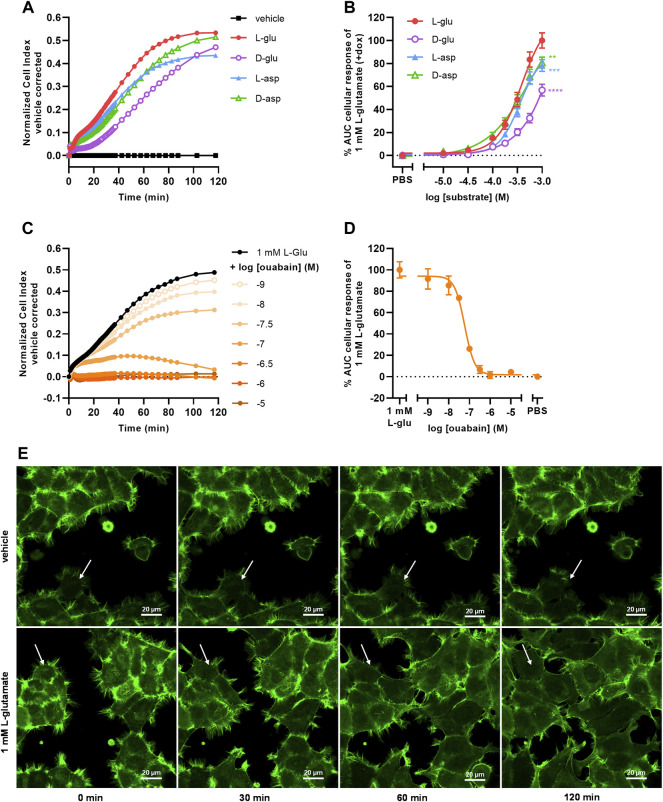
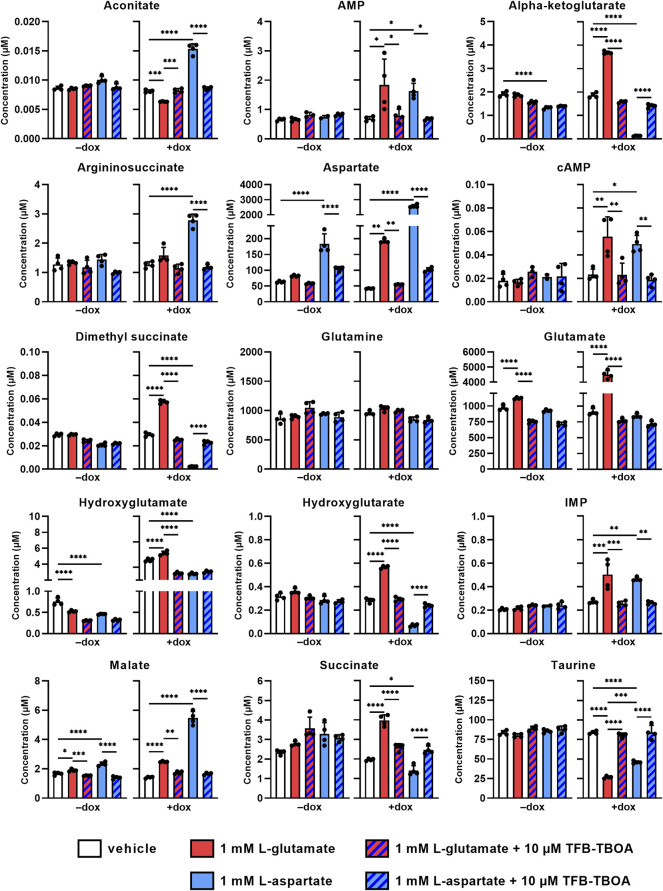
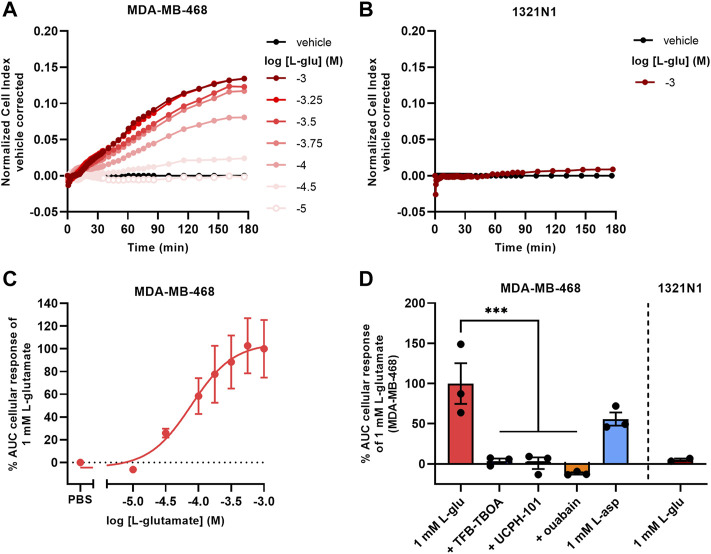
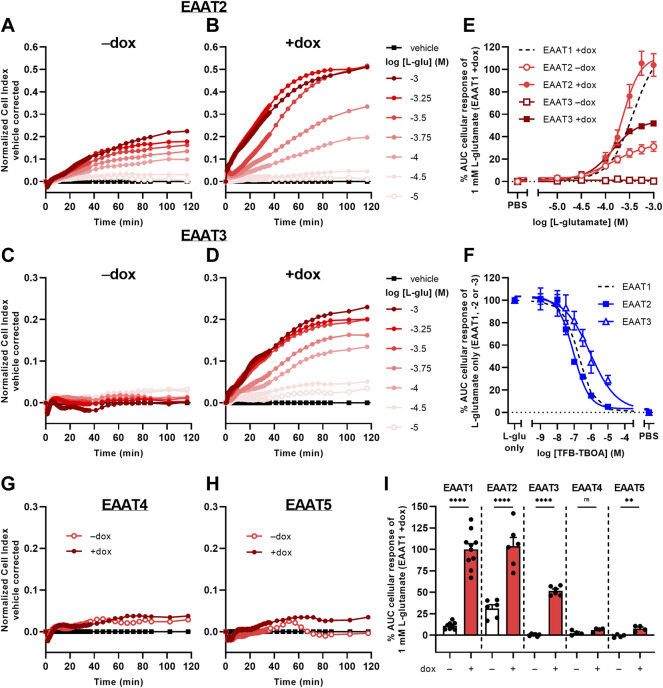
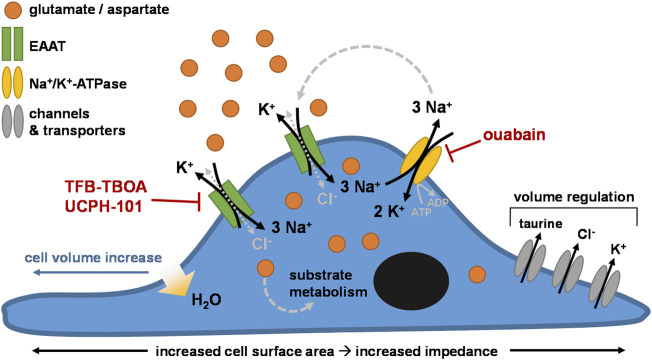
Excitatory amino acid transporters (EAAT/SLC1) mediate Na+-dependent uptake of extracellular glutamate and are potential drug targets for neurological disorders. Conventional methods to assess glutamate transport in vitro are based on radiolabels, fluorescent dyes or electrophysiology, which potentially compromise the cell's physiology and are generally less suited for primary drug screens. Here, we describe a novel label-free method to assess human EAAT function in living cells, i.e., without the use of chemical modifications to the substrate or cellular environment. In adherent HEK293 cells overexpressing EAAT1, stimulation with glutamate or aspartate induced cell spreading, which was detected in real-time using an impedance-based biosensor. This change in cell morphology was prevented in the presence of the Na+/K+-ATPase inhibitor ouabain and EAAT inhibitors, which suggests the substrate-induced response was ion-dependent and transporter-specific. A mechanistic explanation for the phenotypic response was substantiated by actin cytoskeleton remodeling and changes in the intracellular levels of the osmolyte taurine, which suggests that the response involves cell swelling. In addition, substrate-induced cellular responses were observed for cells expressing other EAAT subtypes, as well as in a breast cancer cell line (MDA-MB-468) with endogenous EAAT1 expression. These findings allowed the development of a label-free high-throughput screening assay, which could be beneficial in early drug discovery for EAATs and holds potential for the study of other transport proteins that modulate cell shape.

Keywords: EAAT; cell swelling; glutamate transporter; impedance; label-free; phenotypic assay; solute carrier.


Conflict of interest statement

The authors declare that the research was conducted in the absence of any commercial or financial relationships that could be construed as a potential conflict of interest.

Figures

FIGURE 1
FIGURE 1
L-glutamate induces distinct mGluR2- and EAAT1-mediated responses in a TRACT assay. (A,B,D,E) Vehicle-corrected normalized Cell Index (nCI) traces of the first 15 min (A,B) or 120 min (D,E) after stimulation of cells with vehicle (PBS) or L-glutamate (L-glu) in the absence (−dox) (A,D) or presence (+dox) (B,E) of doxycycline, shown as the mean of a representative experiment performed in duplicate. (C,F) Combined concentration-response curves of L-glu on JumpIn-EAAT1-mGluR2 cells (±dox, red) and mock-transfected JumpIn-EAAT1 cells (mock) (±dox, grey). (G) Cellular response of 100 μM L-glu on JumpIn-EAAT1-mGluR2 cells (±dox) pretreated for 1 h with vehicle (PBS/DMSO) or 1 µM LY341495. (H) Combined concentration-response curves of L-glu on JumpIn-EAAT1-mGluR2 cells (±dox) pretreated for 1 h with vehicle (PBS/DMSO) (data derived from Panel 1C), 10 µM UCPH-101 or 10 µM TFB-TBOA. Cellular response is expressed as the net AUC of the first 15 min (C,G,H) or 120 min (F) after L-glu stimulation. Data are normalized to the response of 1 mM (C,F,H) or 100 µM (G) L-glu on JumpIn-EAAT1-mGluR2 (−dox) cells. Data are shown as the mean ± SEM of three or four individual experiments each performed in duplicate. ns = not significant, *p < 0.05, **p < 0.01, ***p < 0.001, ****p < 0.0001; one-way ANOVA with Tukey’s post-hoc test (G) or two-way ANOVA with Šídák’s post-hoc test compared to vehicle-treated +dox cells (H).
FIGURE 2
FIGURE 2
L-glutamate induces EAAT1-specific cellular responses on JumpIn-EAAT1 cells. (A) Experimental layout of an xCELLigence growth curve, the subsequent assay course and data analysis. Shown are traces of two separate wells from a representative experiment. (B,C) Vehicle-corrected nCI traces of cells in the absence (−dox) (B) or presence (+dox) (C) of doxycycline stimulated with vehicle (PBS) or L-glutamate (L-glu), shown as the mean of a representative experiment performed in duplicate. (D) Combined concentration-response curves of L-glu on JumpIn-EAAT1 cells (±dox). (E) Combined concentration-inhibition curves of TFB-TBOA and UCPH-101 on +dox cells pretreated for 1 h with vehicle (PBS/DMSO) or increasing concentrations of TFB-TBOA or UCPH-101 and subsequently stimulated with a submaximal concentration (1 mM) of L-glu. (F) Combined concentration-response curves of L-glu on +dox cells pretreated for 1 h with vehicle (PBS/DMSO), 1 μM, 3.16 µM or 10 µM UCPH-101. (G) Combined concentration-response curves of L-glu on +dox cells pretreated for 1 h with vehicle (PBS/DMSO), 10 nM, 100 nM or 1 µM TFB-TBOA. Cellular response is expressed as the net AUC of the first 120 min after L-glu stimulation. Data are normalized to the response of 1 mM L-glu on +dox cells. Data are shown as the mean ± SEM of three to ten individual experiments each performed in duplicate.
FIGURE 3
FIGURE 3
Substrate-dependent uptake via EAAT1 mediates Na+/K+-ATPase (NKA)-dependent cell spreading. (A) Vehicle-corrected nCI traces of +dox cells stimulated with vehicle (PBS), 1 mM of L-glutamate (L-glu), D-glutamate (D-glu), L-aspartate (L-asp) or D-aspartate (D-asp), shown as the mean of a representative experiment performed in duplicate. (B) Combined concentration-response curves of L-glu (derived from Figure 2D), D-glu, L-asp and D-asp on +dox cells. (C) Vehicle (PBS)-corrected nCI traces of +dox cells pretreated for 1 h with vehicle (PBS/DMSO, black) or increasing concentrations of ouabain and subsequently stimulated with 1 mM L-glu, shown as the mean of a representative experiment performed in duplicate. (D) Combined concentration-inhibition curves of ouabain in +dox cells. Vehicle (PBS)-induced responses were subtracted from L-glu-induced responses for each concentration of ouabain. Cellular response is expressed as the net AUC of the first 120 min after substrate stimulation. Data are normalized to the response of 1 mM L-glu. Data are shown as the mean ± SEM of three to six individual experiments each performed in duplicate. (E) Representative confocal images of JumpIn-EAAT1-LifeAct-GFP (green) cells 0, 30, 60, and 120 min after stimulation with vehicle (PBS) or 1 mM L-glu, scale bar = 20 µm. Stills were selected from a representative live imaging movie from two independent experiments each performed in triplicate. White arrow indicates representative behavior of a single cell, showing increased cell spreading over time.
FIGURE 4
FIGURE 4
Changes in intracellular metabolite levels upon substrate stimulation of JumpIn-EAAT1 cells. Targeted metabolomics was used to measure the concentrations of several metabolites in the absence (−dox) or presence (+dox) of doxycycline. AMP, adenosine monophosphate; cAMP, cyclic AMP; IMP, inosine monophosphate. Cells were pretreated for 1 h with vehicle (PBS/DMSO, plain bars) or 10 µM TFB-TBOA (hatched bars) prior to stimulation with vehicle (PBS, white bars), 1 mM L-glutamate (red bars) or L-aspartate (blue bars). Data are shown as the mean concentration (in µM) ± SD of four replicate experiments. *p < 0.05, **p < 0.01, ***p < 0.001, ****p < 0.0001; one-way ANOVA with Tukey’s post-hoc test.
FIGURE 5
FIGURE 5
L-glutamate induces cellular responses on MDA-MB-468 cells with endogenous EAAT1 expression. (A,B) Vehicle-corrected nCI traces of MDA-MB-468 (A) and 1321N1 (B) cells stimulated with L-glutamate (L-glu), shown as the mean of a representative experiment performed in duplicate. (C) Combined concentration-response curve of L-glu on MDA-MB-468 cells. (D) Cellular response of L-glu or L-aspartate (L-asp) on MDA-MB-468 and 1321N1 cells. MDA-MB-468 cells were pretreated for 1 h with vehicle (PBS/DMSO), 10 µM TFB-TBOA, 10 µM UCPH-101 or 1 µM ouabain prior to stimulation with vehicle (PBS), 1 mM L-glu or L-asp. Data are shown as the mean ± SEM of three (MDA-MB-468) or SD of two (1321N1) individual experiments each performed in duplicate. ***p < 0.001; one-way ANOVA with Dunnett’s post-hoc test.
FIGURE 6
FIGURE 6
L-glutamate-induced cellular responses on JumpIn-EAAT2 and JumpIn-EAAT3 cells. (AD,G,H) Vehicle-corrected nCI traces of JumpIn-EAAT2 (A,B), JumpIn-EAAT3 (C,D), JumpIn-EAAT4 (G) and JumpIn-EAAT5 (H) cells in the absence (−dox) or presence (+dox) of doxycycline stimulated with vehicle (PBS) or L-glutamate (L-glu), shown as the mean of a representative experiment performed in duplicate. (E) Combined concentration-response curves of L-glu on JumpIn-EAAT2 and JumpIn-EAAT3 cells (±dox). Data are normalized to the response of 1 mM L-glu on JumpIn-EAAT1 +dox cells (data is derived from Figure 2D and shown as a black dotted line). (F) Combined concentration-inhibition curves of TFB-TBOA on +dox JumpIn-EAAT2 and JumpIn-EAAT3 cells pretreated for 1 h with vehicle (PBS/DMSO) or increasing concentrations of TFB-TBOA and subsequently stimulated with a submaximal concentration (316 µM) of L-glu. Data are normalized to the response of 1 mM L-glu (JumpIn-EAAT1, data is derived from Figure 2E and shown as a black dotted line) or 316 μM L-glu (JumpIn-EAAT2 and -EAAT3). (I) Cellular response of 1 mM L-glu on−dox and +dox JumpIn cells for all EAAT subtypes. Data on JumpIn-EAAT1, -EAAT2 and -EAAT3 cells were derived from Figure 2D and Panel 6E. Cellular response is expressed as the net AUC of the first 120 min after substrate stimulation. Data are shown as the mean ± SEM of at least three individual experiments each performed in duplicate. ns = not significant, **p < 0.01, ****p < 0.0001; unpaired two-tailed Student’s t-test.
FIGURE 7
FIGURE 7
Proposed mechanism of the phenotypic impedance-based assay. Cells (over)expressing excitatory amino acid transporters (e.g., EAAT1) are stimulated with exogenous substrate (e.g., glutamate). The substrate is taken up into the cell through EAAT together with 3 Na+ in exchange for 1 K+. Cl enters the cells via uncoupled Cl-conductivity of EAAT or other Cl influx mechanisms, counterbalancing the increase in intracellular Na+. The Na+/K+-ATPase (NKA) restores the transmembrane Na+ gradient by ATP-dependent efflux of 3 Na+ in exchange for 2 K+. Over time, the intracellular concentrations of substrate, Na+, K+, and Cl ions initially rise, increasing cell osmolarity. Subsequent cell swelling, via influx of H2O into the cytosol, triggers cell spreading, which increases the surface area of the E-plate that is covered by cells. Regulatory mechanisms lead to dissipation of the high intracellular ion concentrations via channels and/or transporters that mediate efflux of Cl, K+, and osmolytes such as taurine, effectively reducing cell volume over time.

References

    1. Abrahamsen B., Schneider N., Erichsen M. N., Huynh T. H., Fahlke C., Bunch L., et al. (2013). Allosteric Modulation of an Excitatory Amino Acid Transporter: the Subtype-Selective Inhibitor UCPH-101 Exerts Sustained Inhibition of EAAT1 through an Intramonomeric Site in the Trimerization Domain. J. Neurosci. 33, 1068–1087. 10.1523/JNEUROSCI.3396-12.2013 - DOI - PMC - PubMed
    1. Adamczyk A., Gause C. D., Sattler R., Vidensky S., Rothstein J. D., Singer H., et al. (2011). Genetic and Functional Studies of a Missense Variant in a Glutamate Transporter, SLC1A3, in Tourette Syndrome. Psychiatr. Genet. 21, 90–97. 10.1097/YPG.0b013e328341a307 - DOI - PubMed
    1. Andersen J. V., Markussen K. H., Jakobsen E., Schousboe A., Waagepetersen H. S., Rosenberg P. A., et al. (2021). Glutamate Metabolism and Recycling at the Excitatory Synapse in Health and Neurodegeneration. Neuropharmacology 196, 108719. 10.1016/j.neuropharm.2021.108719 - DOI - PubMed
    1. Arinze I. J. (2005). Facilitating Understanding of the Purine Nucleotide Cycle and the One-Carbon Pool: Part I: The Purine Nucleotide Cycle. Biochem. Mol. Biol. Educ. 33, 165–168. 10.1002/bmb.2005.494033032469 - DOI - PubMed
    1. Armbruster M., Dulla C. G., Diamond J. S. (2020). Effects of Fluorescent Glutamate Indicators on Neurotransmitter Diffusion and Uptake. Elife 9, 1900–1930. 10.7554/eLife.54441 - DOI - PMC - PubMed