. 2022 May 30:2022:6737241.
doi: 10.1155/2022/6737241. eCollection 2022.

Classification of Muscle Invasive Bladder Cancer to Predict Prognosis of Patients Treated with Immunotherapy

Affiliations

Classification of Muscle Invasive Bladder Cancer to Predict Prognosis of Patients Treated with Immunotherapy

Zhifeng Wang et al. J Immunol Res. .

Abstract

Background: Recently, immunotherapies have been approved for advanced muscle invasive bladder cancer (MIBC) treatment, but only a small fraction of MIBC patients could achieve a durable drug response. Our study is aimed at identifying tumor microenvironment (TME) subtypes that have different immunotherapy response rates.

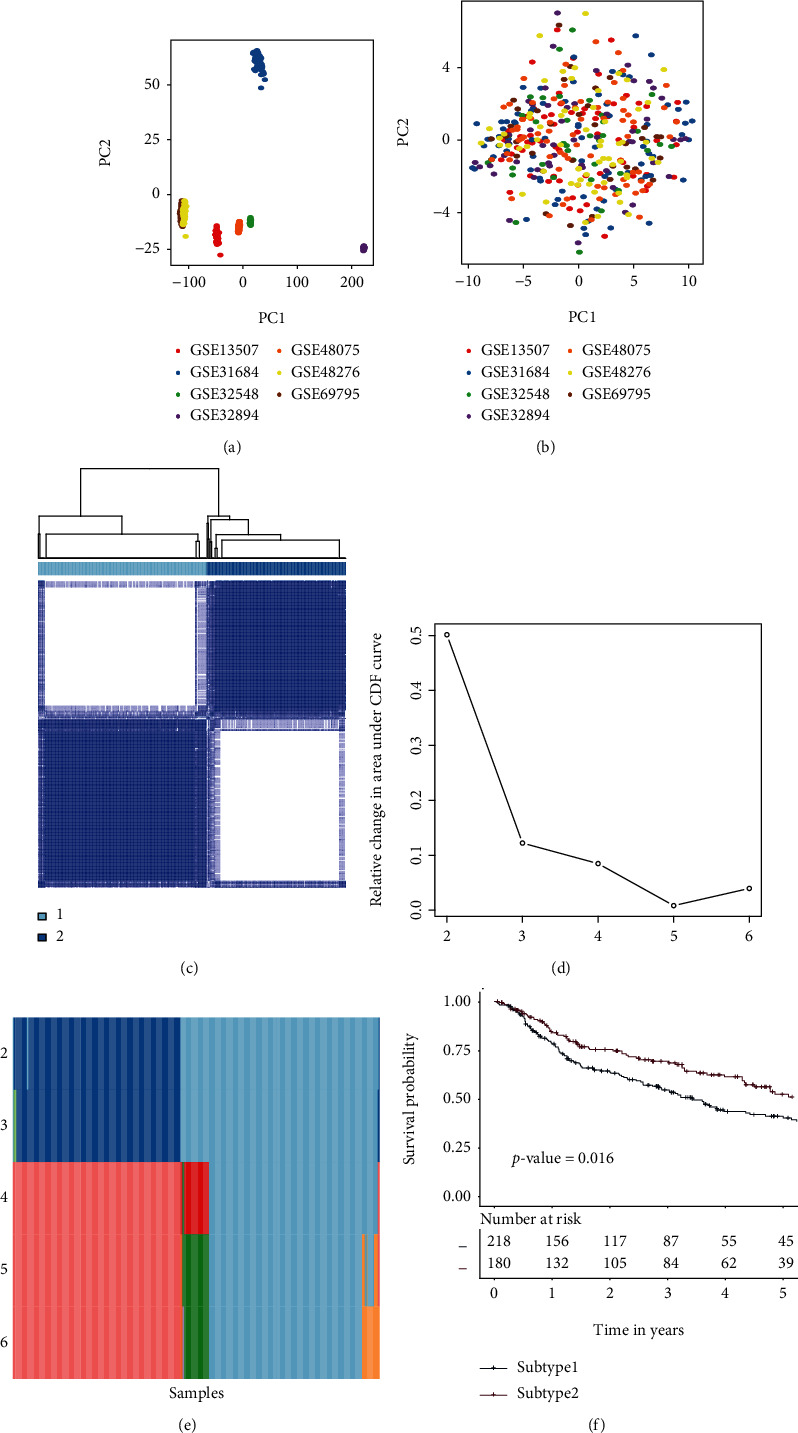
Methods: The mRNA expression profiles of MIBC samples from seven discovery datasets (GSE13507, GSE31684, GSE32548, GSE32894, GSE48075, GSE48276, and GSE69795) were analyzed to identify TME subtypes. The identified TME subtypes were then validated by an independent dataset (TCGA-MIBC). The subtype-related biomarkers were discovered using computational analyses and then utilized to establish a random forest predictive model. The associations of TME subtypes with immunotherapy therapeutic responses were investigated in a group of patients who had been treated with immunotherapy. A prognostic index model was constructed using the subtype-related biomarkers. Two nomograms were built by the subtype-related biomarkers or the clinical parameters.

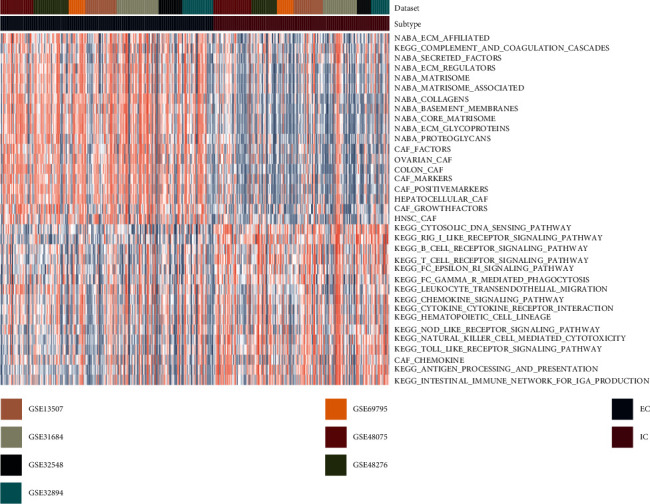
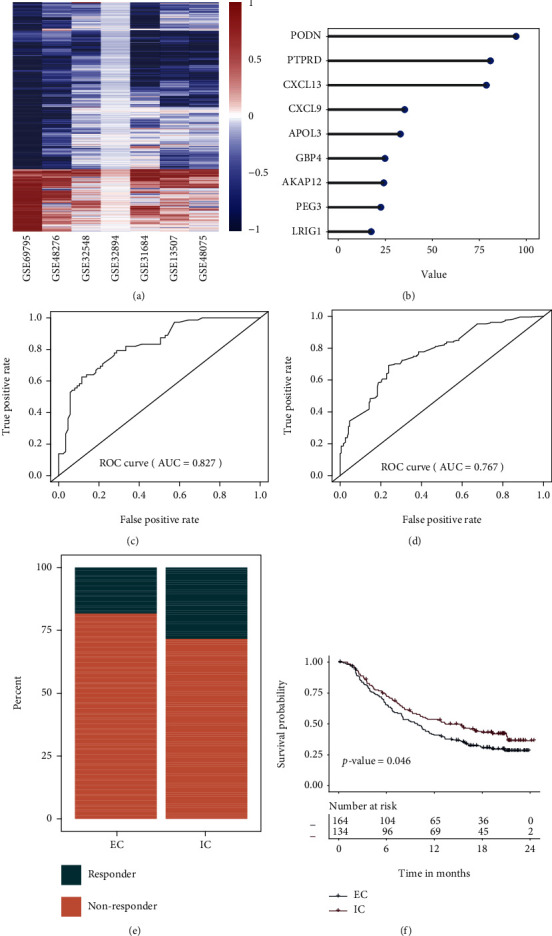
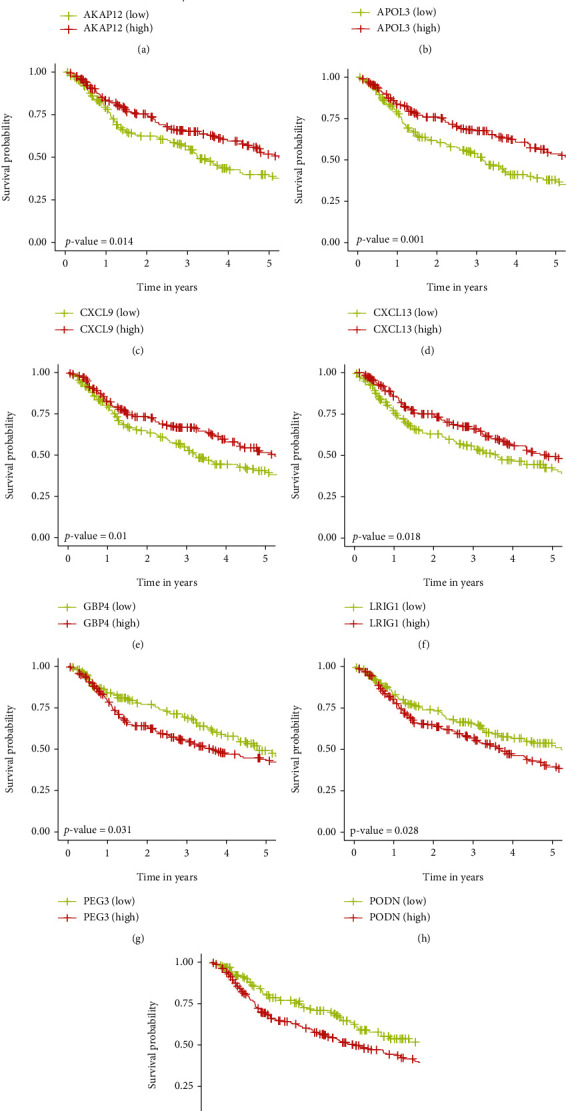
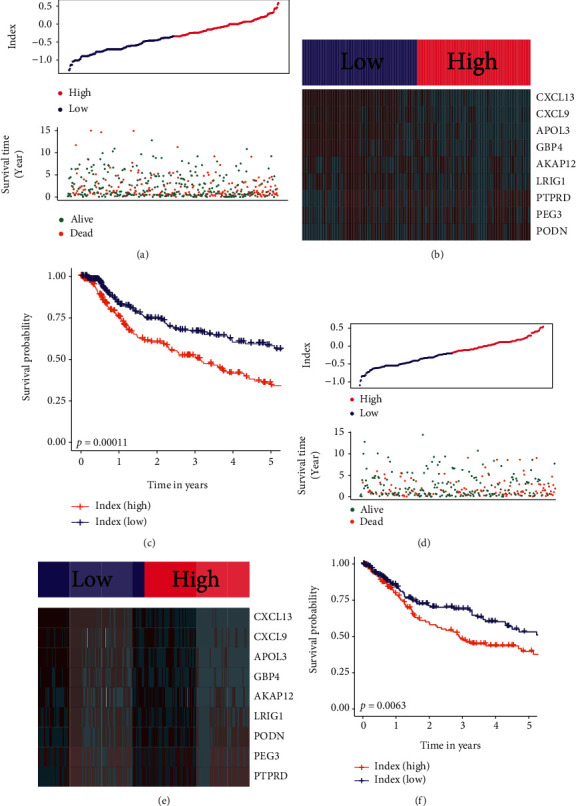
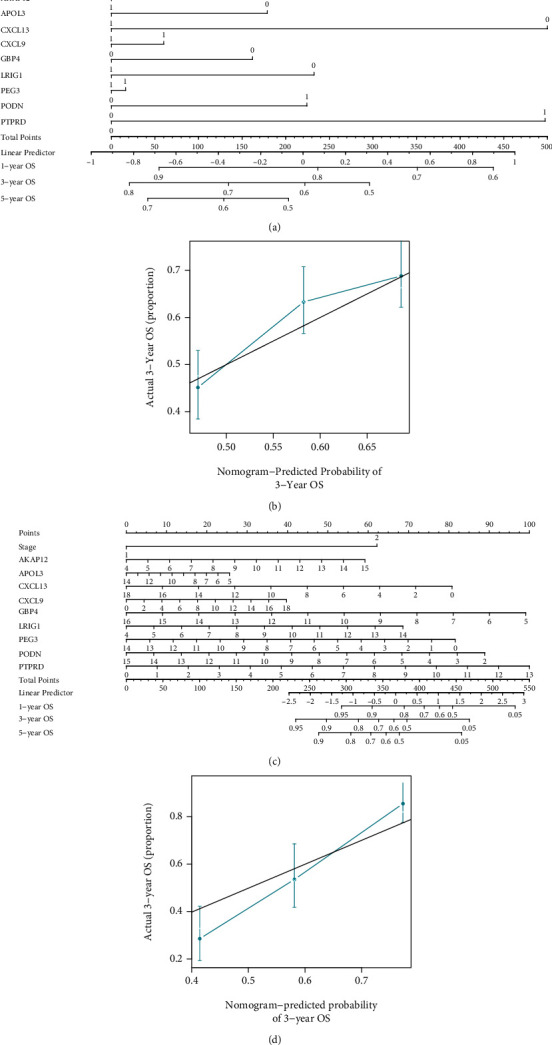
Results: Two TME subtypes, including ECM-enriched class (EC) and immune-enriched class (IC), were found. EC was associated with greater extracellular matrix (ECM) pathways, and IC was correlated with immune pathways, respectively. Overall survival was significantly greater for tumors classified as IC, whereas the EC subtype had a worse prognosis. A total of nine genes (AKAP12, APOL3, CXCL13, CXCL9, GBP4, LRIG1, PEG3, PODN, and PTPRD) were selected by computational analyses to construct the random forest model. The area under the curve (AUC) values for this model were 0.827 and 0.767 in the testing and external validation datasets, respectively. Therapeutic response rates were greater in IC patients than in EC patients (28 percent vs. 18 percent). Patients with a high prognostic index had a poorer prognosis than those with a low prognostic index. The nomogram constructed from nine genes and stage achieved a C-index of 0.71.

Conclusion: The present investigation defined two distinct TME subtypes and developed models to assess immunotherapeutic treatment outcomes.


Conflict of interest statement

The authors declare that there is no conflict of interest regarding the publication of this paper.

Figures

Figure 1
Figure 1
Consensus clustering for MIBC discovery datasets (GSE13507, GSE31684, GSE32548, GSE32894, GSE48075, GSE48276, and GSE69795). (a) PCA of the mRNA expression matrix of 7 discovery datasets. (b) PCA of the TME gene set matrix of 7 discovery datasets. (c) Consensus matrix heatmap of two subtypes. (d) Relative change area values for optimal subtype numbers: 2 to 6. The optimal subtype number in this plot should be the one at which the value starts to drop. (e) The sample distributions from different subtype numbers. The samples in each subtype were illustrated by distinct colors within every row. (f) Subtype-specific survival curves for five-year OS in individuals with MIBC. The log-rank test was used to determine the p value among the TME subtypes. Abbreviations: OS: overall survival; MIBC: muscle invasive bladder cancer; PCA: principal component analysis; TME: tumor microenvironment.
Figure 2
Figure 2
The scores of TME pathways in 2 subtypes from the discovery datasets (GSE13507, GSE31684, GSE32548, GSE32894, GSE48075, GSE48276, and GSE69795). Abbreviation: TME: tumor microenvironment.
Figure 3
Figure 3
Identification of biomarkers and construction of prediction model. A heatmap depicts the log2(fold change) values of robust DEGs. A row represents a single gene, while a column represents a single dataset. Genes that are upregulated are highlighted in red, whereas those that are downregulated are highlighted in blue. The creation and assessment of a random forest classifier for the prediction of TME subtypes. (a) The 9 genes with the highest importance value were selected for classifier construction in the training dataset. (b) Validation of classifier in the testing dataset. (c) Validation of classifier in the independent validation dataset (TCGA-MIBC). (d) Correlation between TME subtype and therapeutic success rate IMvigor210. (e) Correlation between TME subtype and survival outcome in IMvigor210. DEGs: differentially expressed genes; RRA: robust rank aggregation.
Figure 4
Figure 4
Five-year Kaplan–Meier (K-M) curves for overall survival of MIBC patients in the discovery datasets. The p values were calculated by the log-rank test.
Figure 5
Figure 5
Analysis of prognosis signatures in the training and testing datasets. (a) Distribution of prognostic index and surviving condition in the low and high prognostic index groups from the training dataset. (b) Expression values of genes between two groups in the training dataset. Red color represents high expression value, and green color represents low expression value. (c) Survival curves of the high- and low-index groups in the training dataset. (d) Distribution of prognostic index and surviving condition in the low and high prognostic index groups from the testing dataset. (e) Expression values of genes between two groups in the testing dataset. Red color represents high expression value, and green color represents low expression value. (f) Survival curves of the high- and low-index groups in the testing dataset.
Figure 6
Figure 6
The nomograms. (a) The nomogram constructed by genes in the combination dataset of GEO datasets and TCGA-MIBC cohorts. (b) Calibration lines for 3-year survival prediction in the combination dataset of GEO datasets and TCGA-MIBC cohorts. (c) The nomogram constructed by genes and clinical parameters in TCGA-MIBC cohort. Stages I-II and stages III-IV were represented by “1” and “2,” respectively. (d) Calibration lines for 3-year survival prediction in TCGA-MIBC cohort. Abbreviation: OS: overall survival.

Similar articles

Cited by

References

    1. Siegel R. L., Miller K. D., Jemal A. Cancer statistics, 2020. CA: a Cancer Journal for Clinicians . 2020;70(1):7–30. doi: 10.3322/caac.21590. - DOI - PubMed
    1. Yamada Y., Kato M., Arai T., et al. Aberrantly expressed PLOD1 promotes cancer aggressiveness in bladder cancer: a potential prognostic marker and therapeutic target. Molecular Oncology . 2019;13(9):1898–1912. doi: 10.1002/1878-0261.12532. - DOI - PMC - PubMed
    1. Chou R., Selph S. S., Buckley D. I., et al. Treatment of muscle-invasive bladder cancer: a systematic review. Cancer . 2016;122(6):842–851. doi: 10.1002/cncr.29843. - DOI - PubMed
    1. Tian Z., Meng L., Long X., et al. Identification and validation of an immune-related gene-based prognostic index for bladder cancer. American Journal of Translational Research . 2020;12(9):5188–5204. - PMC - PubMed
    1. Sharma P., Retz M., Siefker-Radtke A., et al. Nivolumab in metastatic urothelial carcinoma after platinum therapy (CheckMate 275): a multicentre, single-arm, phase 2 trial. The Lancet Oncology . 2017;18(3):312–322. doi: 10.1016/S1470-2045(17)30065-7. - DOI - PubMed

Substances