

Sugar-Sweetened Beverages and Depressive and Social Anxiety Symptoms Among Children and Adolescents Aged 7-17 Years, Stratified by Body Composition
- PMID: 35677554
- PMCID: PMC9168881
- DOI: 10.3389/fnut.2022.888671
Sugar-Sweetened Beverages and Depressive and Social Anxiety Symptoms Among Children and Adolescents Aged 7-17 Years, Stratified by Body Composition
Abstract
Background: Rare studies investigated the associations between sugar-sweetened beverage (SSB) consumption with depressive and social anxiety symptoms among children and adolescents, particularly in different stratification of body composition, which was our purpose.
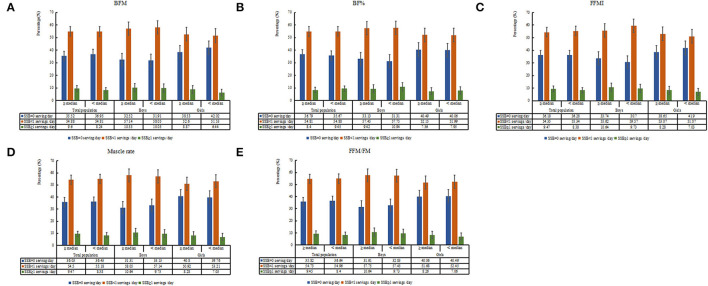
Methods: A cross-sectional survey of children and adolescents aged 7-17 years was conducted in Beijing, China, in 2020, with an average age of 12.07 (SD: 3.09) years. Children's Depression Inventory (CDI) questionnaires and social anxiety scale for children (SASC) were completed in the baseline questionnaires. SSB consumption and body composition were assessed using child-reported questionnaires and a GE Healthcare Lunar iDXA dual-energy X-ray bone densitometer. Multivariate logistic regression was used to assess the associations between SSB consumption with depressive and social anxiety symptoms. Confounders were evaluated by child-reported and parental questionnaires, including age, sex, parental educational attainment, maternal smoking status, single-child status, BMI, incomes, fruit consumption, physical activity, screen time, and the frequency of fried food consumption. Stratified analyses were performed to explore whether the associations were influenced by body composition.
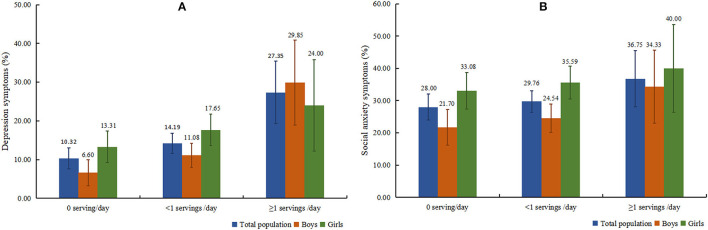
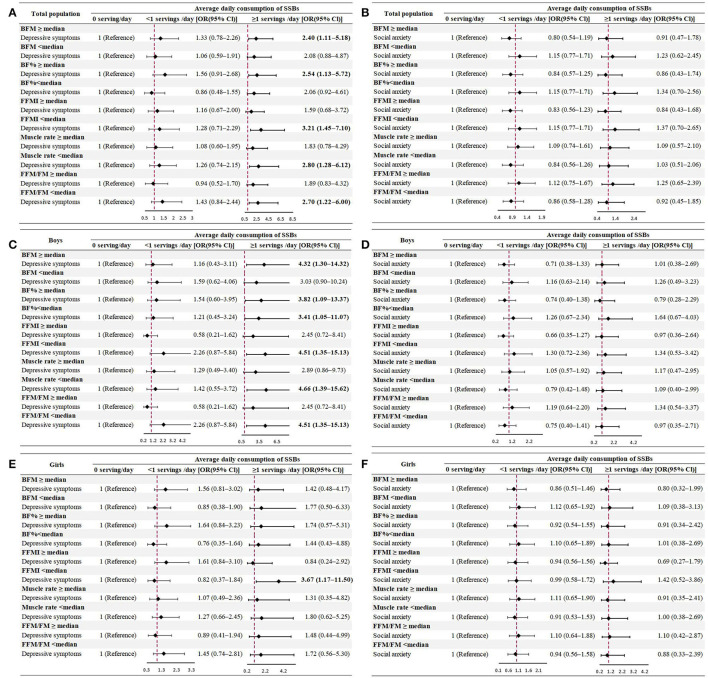
Results: A total of 1,311 children and adolescents, including 658 boys and 653 girls, were included in the final analysis. There were 13.96 and 29.75% of the study population with depressive and social anxiety symptoms, respectively. Overall, about 63.77% of the children and adolescents consumed SSB, and the average SSB intake was 0.35 servings per day. In the fully adjusted model, compared to participants who did not consume SSB each day, SSB consumption of ≥1 servings/day was positively associated with depressive symptoms [odds ratio (OR) = 2.28, 95% CI = 1.30-4.01] and social anxiety (OR = 1.10, 95% CI = 0.69-1.77), though the latter did not reach statistical significance. When individuals had higher body fat or lower fat-free mass (FFM) or muscle, the ORs of depressive symptoms were more evident among children and adolescents who drank SSB for ≥1 servings/day (P < 0.05).
Conclusion: Higher consumption of SSB could be associated with increased OR of depressive symptoms in children and adolescents. The association remained robust, especially in groups with higher body fat or lower fat-free mass or muscle.
Keywords: body composition; children and adolescents; depression; social anxiety; sugar-sweetened beverages.
Copyright © 2022 Liu, Chen, Chen, Ma, Ma, Gao, Li, Ma, Chen, Wang, Zhang, Ma and Dong.
Conflict of interest statement
The authors declare that the research was conducted in the absence of any commercial or financial relationships that could be construed as a potential conflict of interest.
Figures
Similar articles
-
Prospective association of family members' sugar-sweetened beverages intake with children's sugar-sweetened beverages consumption in China.Eur J Nutr. 2023 Feb;62(1):175-184. doi: 10.1007/s00394-022-02971-3. Epub 2022 Aug 5. Eur J Nutr. 2023. PMID: 35931834 Free PMC article.
-
Sugar-Sweetened Beverage Consumption and Risks of Obesity and Hypertension in Chinese Children and Adolescents: A National Cross-Sectional Analysis.Nutrients. 2017 Nov 30;9(12):1302. doi: 10.3390/nu9121302. Nutrients. 2017. PMID: 29189729 Free PMC article.
-
Beverage intake among preschool children and its effect on weight status.Pediatrics. 2006 Oct;118(4):e1010-8. doi: 10.1542/peds.2005-2348. Pediatrics. 2006. PMID: 17015497
-
Sugar-sweetened beverage consumption and age at menarche in a prospective study of US girls.Hum Reprod. 2015 Mar;30(3):675-83. doi: 10.1093/humrep/deu349. Epub 2015 Jan 27. Hum Reprod. 2015. PMID: 25628346 Free PMC article.
-
Prospective Associations of Sugar-Sweetened Beverage Consumption During Adolescence with Body Composition and Bone Mass at Early Adulthood.J Nutr. 2022 Feb 8;152(2):399-407. doi: 10.1093/jn/nxab389. J Nutr. 2022. PMID: 34791346 Free PMC article.
Cited by
-
Associations between sugar-sweetened beverage consumption, weight-adjusted-waist index, with psychological symptoms: a cross-sectional survey of adolescents in mainland China.Front Psychiatry. 2025 Mar 28;16:1558919. doi: 10.3389/fpsyt.2025.1558919. eCollection 2025. Front Psychiatry. 2025. PMID: 40225846 Free PMC article.
-
Maternal monosaccharide diets evoke cognitive, locomotor, and emotional disturbances in adolescent and young adult offspring rats.Front Nutr. 2023 May 9;10:1176213. doi: 10.3389/fnut.2023.1176213. eCollection 2023. Front Nutr. 2023. PMID: 37229474 Free PMC article.
-
Sugar-sweetened beverage consumption and depressive symptoms among college students in northeastern China: The mediating role of mobile phone use addiction.Prev Med Rep. 2025 Jun 2;55:103123. doi: 10.1016/j.pmedr.2025.103123. eCollection 2025 Jul. Prev Med Rep. 2025. PMID: 40529599 Free PMC article.
-
Combination of sugar-sweetened beverage consumption, screen-based sedentary time, and sleep duration and their association with South Korean adolescents' mental health.Front Public Health. 2024 Jan 19;11:1293505. doi: 10.3389/fpubh.2023.1293505. eCollection 2023. Front Public Health. 2024. PMID: 38312139 Free PMC article.
-
Association Between Diet and Mental Health Outcomes in a Sample of 13,887 Adolescents in Canada.Prev Chronic Dis. 2024 Oct 24;21:E82. doi: 10.5888/pcd21.240187. Prev Chronic Dis. 2024. PMID: 39447323 Free PMC article.
References
LinkOut - more resources
Full Text Sources