. 2022 May 29:2022:9141117.
doi: 10.1155/2022/9141117. eCollection 2022.

Development of a Prognostic Model Based on Pyroptosis-Related Genes in Pancreatic Adenocarcinoma

Affiliations

Development of a Prognostic Model Based on Pyroptosis-Related Genes in Pancreatic Adenocarcinoma

Kaifeng Su et al. Dis Markers. .

Abstract

Background: The importance of pyroptosis in tumorigenesis and cancer progression is becoming increasingly apparent. However, the efficacy of using pyroptosis-related genes (PRGs) in predicting the prognosis of pancreatic adenocarcinoma (PAAD) patients is unknown.

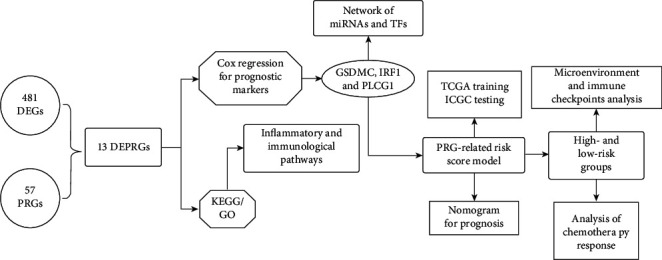
Methods: This investigation used two databases to obtain expression data for PAAD patients. Differentially expressed PRGs (DEPRGs) were identified between PAAD and control samples. Several bioinformatic approaches were used to analyze the biological functions of DEPRGs and to identify prognostic DERPGs. A miRNA-prognostic DEPRG-transcription factor (TF) regulatory network was created via the miRNet online tool. A risk score model was created after each patient's risk score was calculated. The microenvironments of the low- and high-risk groups were assessed using xCell, the expression of immune checkpoints was determined, and gene set variation analysis (GSVA) was performed. Finally, the efficacy of certain potential drugs was predicted using the pRRophetic algorithm, and the results in the high- and low-risk groups were compared.

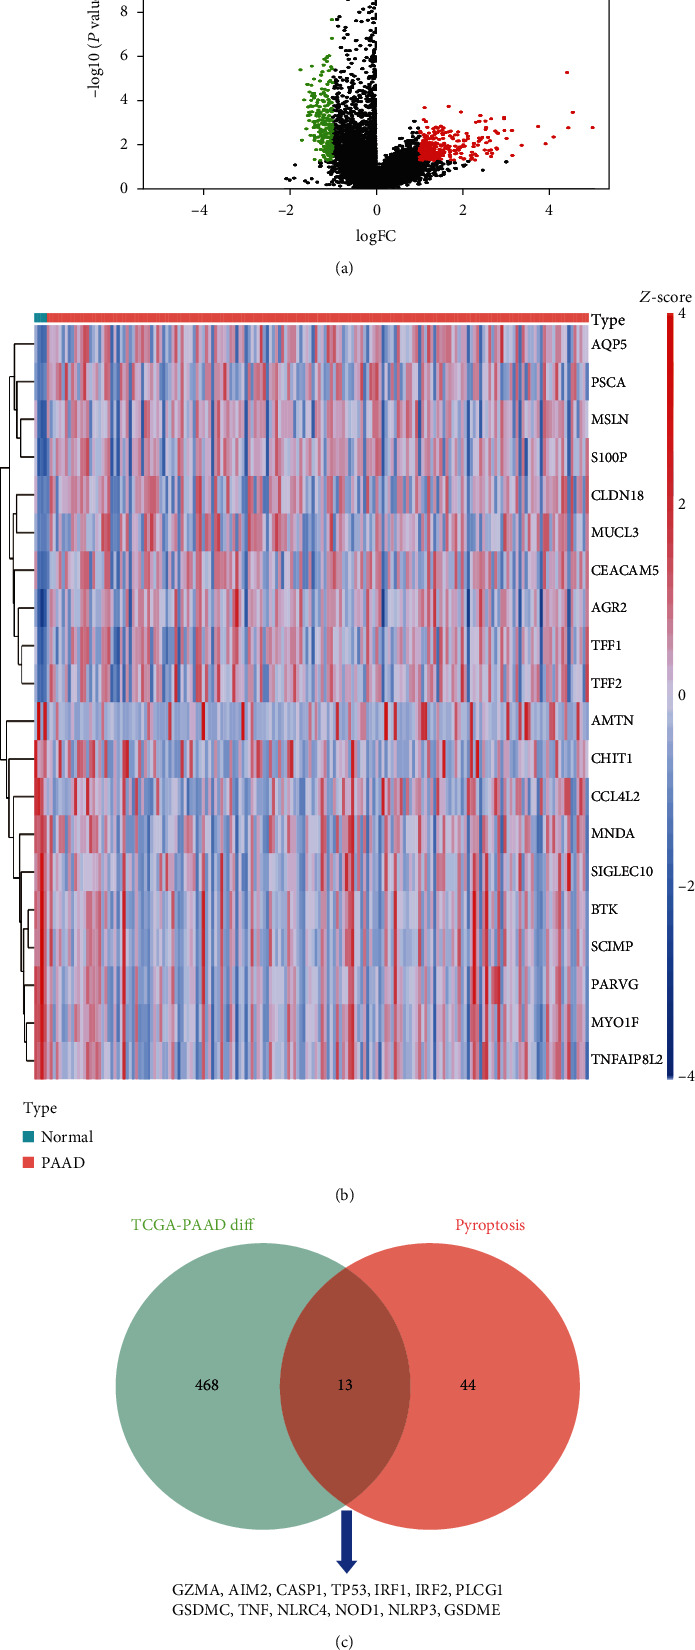
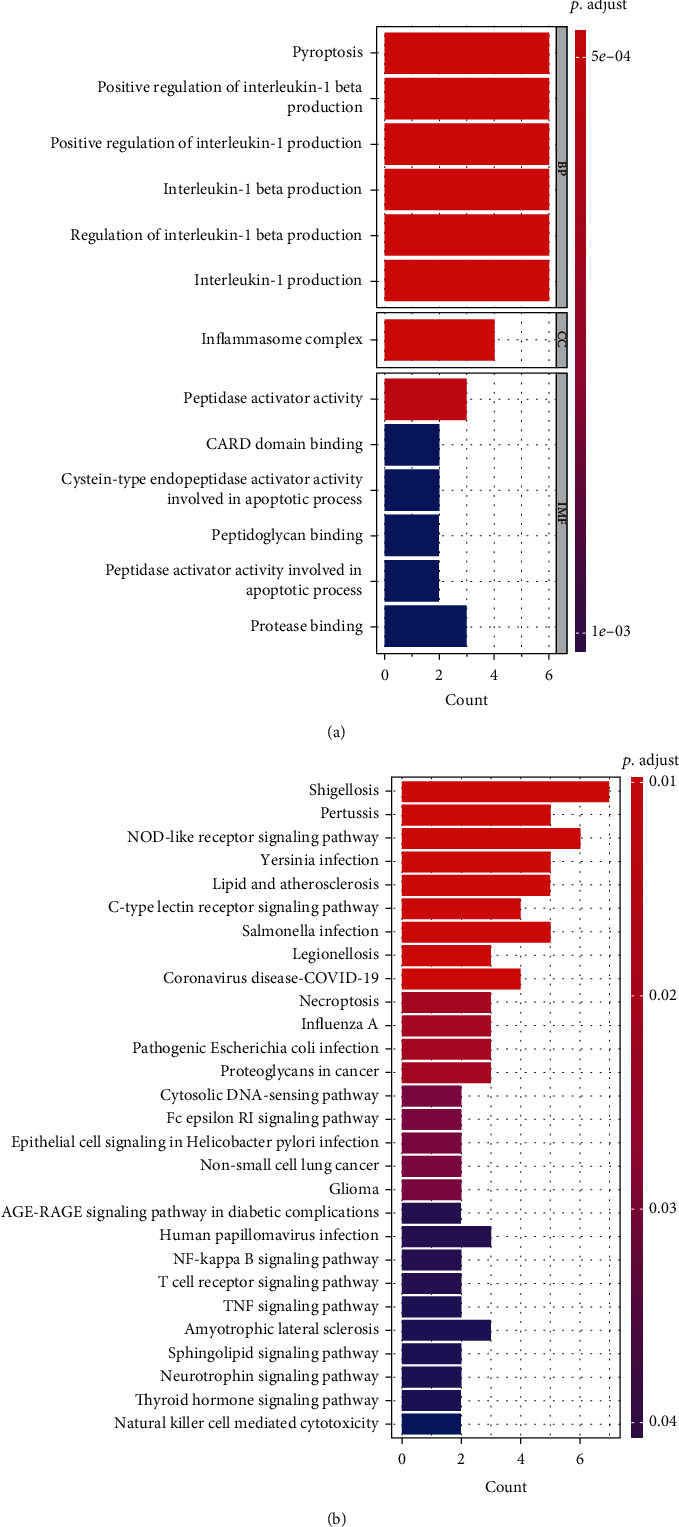
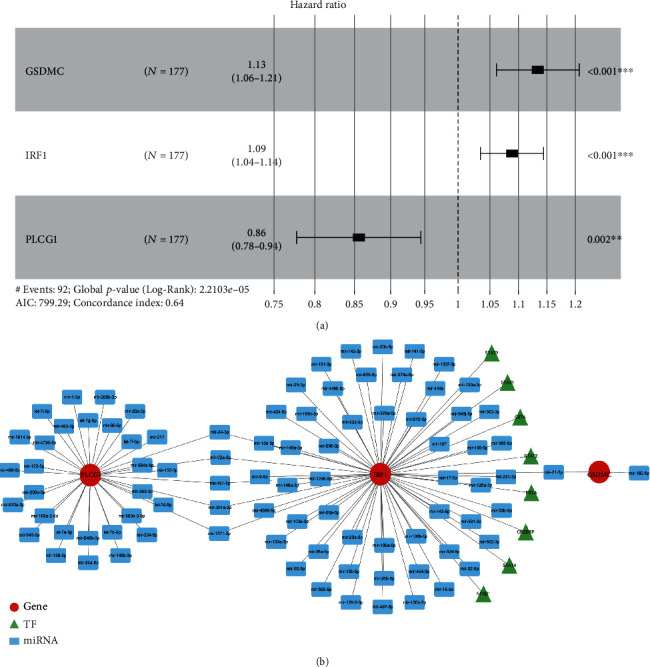
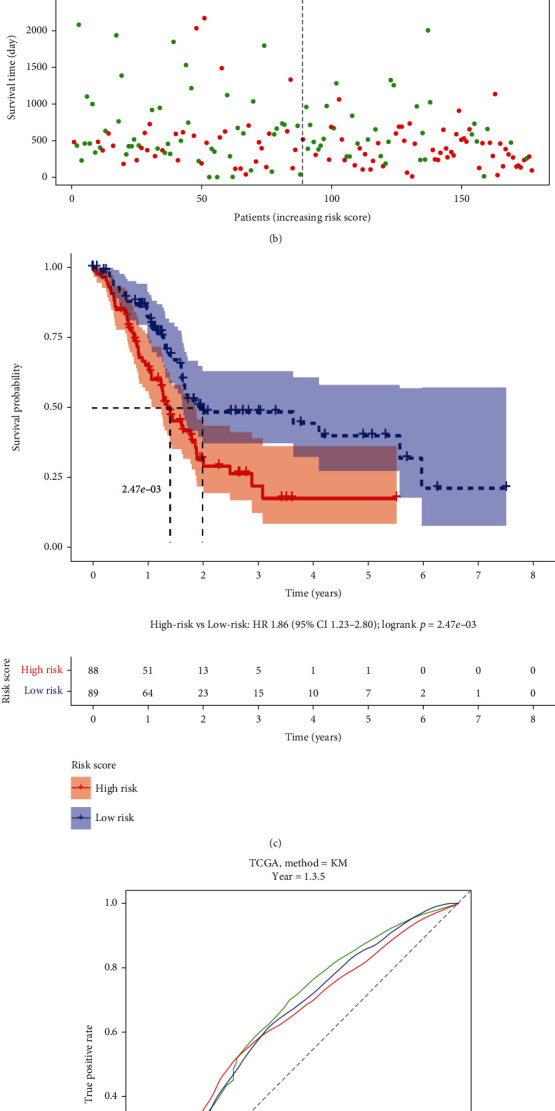
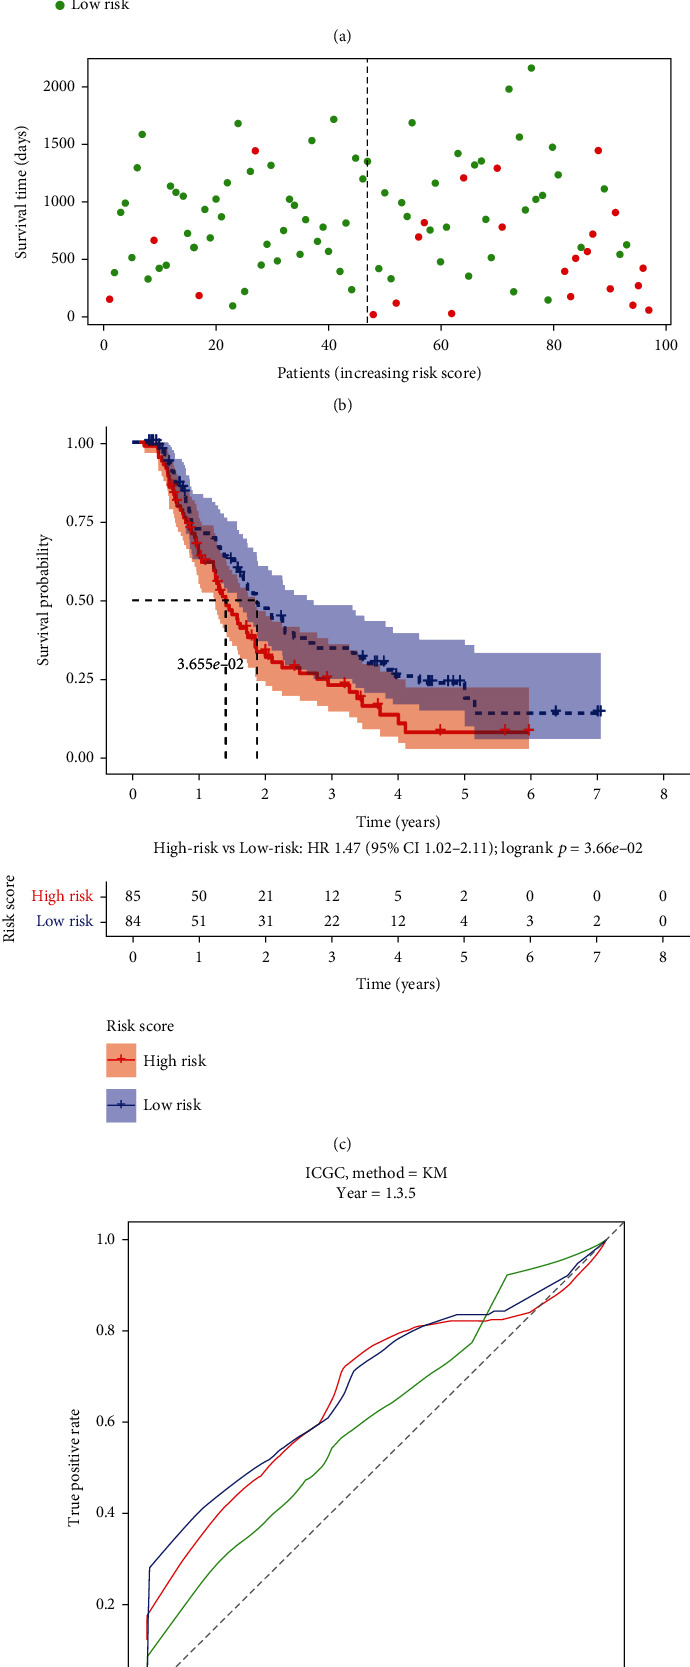
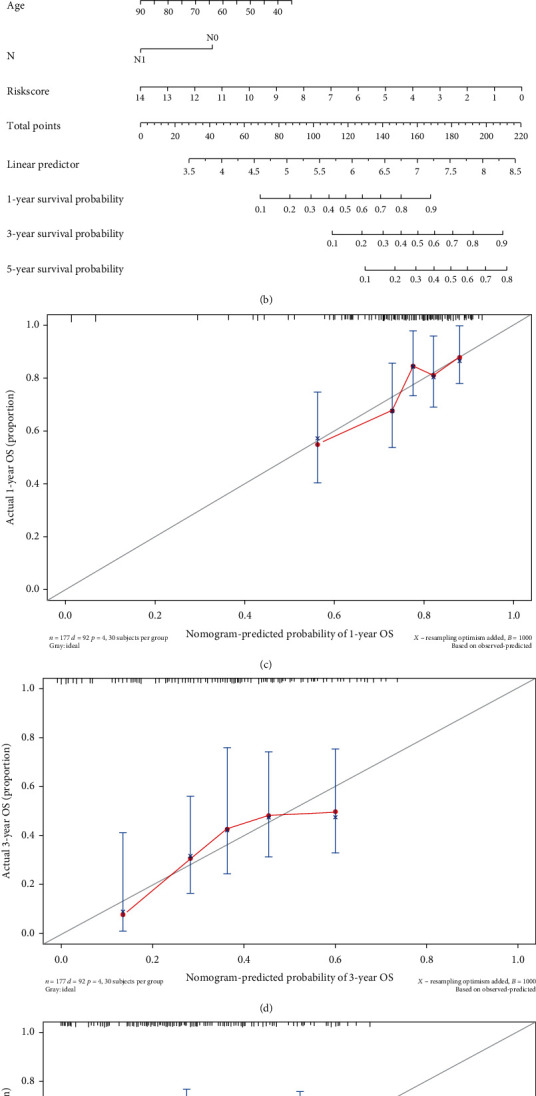
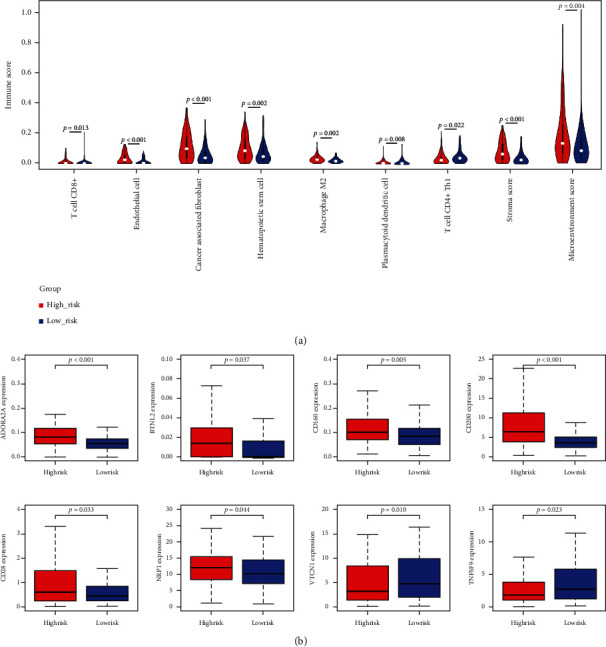
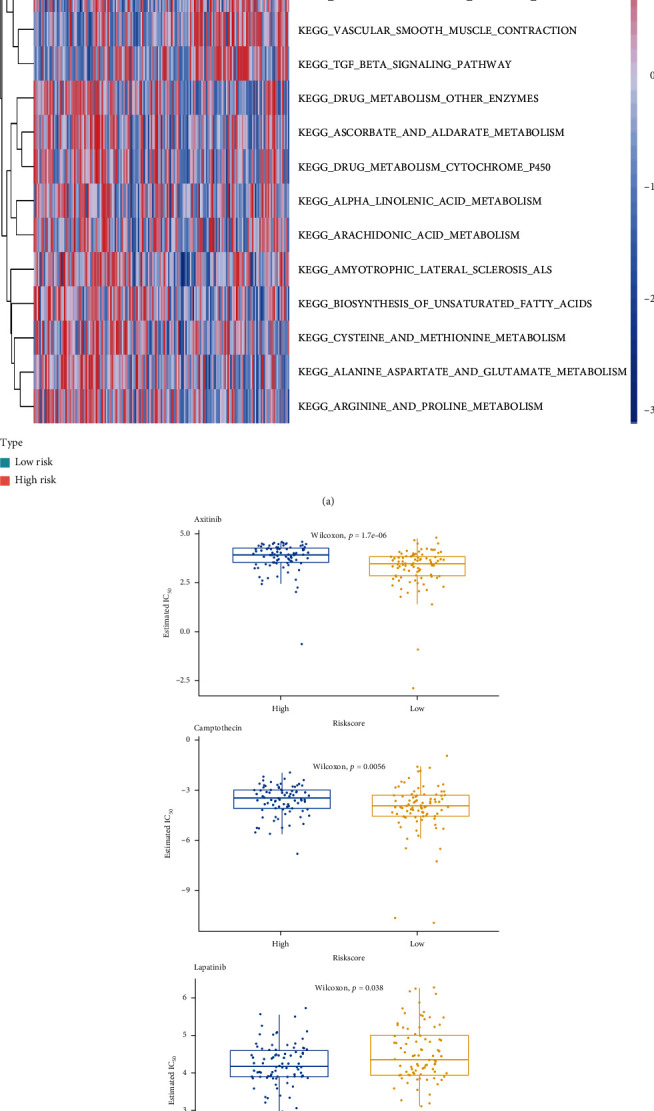
Results: A total of 13 DEPRGs were identified between PAAD and control samples. Functional enrichment analysis showed that the DEPRGs had a close relationship with inflammation. In univariate and multivariate Cox regression analyses, GSDMC, IRF1, and PLCG1 were identified as prognostic biomarkers in PAAD. The results of the miRNA-prognostic DEPRG-TF regulatory network showed that GSDMC, IRF1, and PLCG1 were regulated by both specific and common miRNAs and TFs. Based on the risk score and other independent prognostic indicators, a nomogram with a good ability to predict the survival of PAAD patients was developed. By evaluating the tumor microenvironment, we observed that the immune and metabolic microenvironments of the two groups were substantially different. In addition, individuals in the low-risk group were more susceptible to axitinib and camptothecin, whereas lapatinib might be preferred for patients in the high-risk group.

Conclusion: Our study revealed the prognostic value of PRGs in PAAD and created a reliable model for predicting the prognosis of PAAD patients. Our findings will benefit the prognostication and treatment of PAAD patients.


Conflict of interest statement

The authors declare that they have no competing interests.

Figures

Figure 1
Figure 1
Identification of the expression of 13 different PRGs. (a) Volcano plot presenting differentially expressed genes between normal and tumor tissues from the TCGA dataset. Red plot: upregulated genes in tumor samples. Green plot: downregulated genes in tumor samples. (b) Heatmap (green: low expression level, red: high expression level) of differentially expressed genes between the normal (blue) and PAAD (red) samples. (c) Venn diagram: the green circle on the left includes the 481 TCGA-PAAD cohort differentially expressed genes, the red circle on the right includes the 57 pyroptosis-related genes, and the intersection of the two circles includes the 13 differentially expressed pyroptosis-related genes.
Figure 2
Figure 2
Functional enrichment analysis of DEPRGs in the TCGA cohort. (a) Bar graph for GO analysis category. (b) Bar graph for the KEGG analysis. A longer bar means that more genes were enriched, and an increasing depth of red means that the differences were more obvious. BP: Biological process; CC: Cellular component: MF: Molecular function. DEPRGs differentially expressed pyroptosis-related genes.
Figure 3
Figure 3
Multivariate Cox regression analysis of the three DEPRGs and construction of a miRNA–mRNA–TF regulatory network. (a) Forest plot presenting the HRs for the three DEPRG prognostic models. (b) The miRNA–mRNA–TF regulatory network including the three DEPRGs, 89 miRNAs, and eight TFs.
Figure 4
Figure 4
Clinical evaluation based on the risk score. Scatter diagram showing (a) age, (b) sex, (c) M stage, (d) N stage, (e) T stage, (f) tumor grade, and (g) clinical stage based on the risk score. The statistical test used by nonparametric tests.
Figure 5
Figure 5
Prognostic analysis of the risk signature model in the TCGA cohort. (a) Distribution of patients based on the risk score. (b) Survival status for each patient (low-risk population: on the left side of the dotted line; high-risk population: on the right side of the dotted line; green plot: alive; red plot: dead). (c) Kaplan–Meier curves for the OS of patients in the high- and low-risk groups. (d) ROC curves showing the predictive efficiency of the risk score.
Figure 6
Figure 6
Validation of the risk model in the ICGC cohort. (a) Distribution of the ICGC cohort based on the risk score. (b) Survival status for each patient. (c) Kaplan–Meier curves for the OS of patients in the high- and low-risk groups. (d) ROC curves for PAAD.
Figure 7
Figure 7
Combination of the risk model and clinical characteristics for predicting PAAD prognosis. (a) Multivariate Cox regression analysis of independent prognostic factors for the risk model. (b) Nomogram constructed to predict the probability of OS in PAAD patients at 1, 3, and 5 years. (c)–(e) Calibration curves for 1-, 3-, and 5-year survival probabilities in the TCGA cohort.
Figure 8
Figure 8
Association of the risk score with the microenvironment and immune checkpoints. (a) Comparison of immune cells and the stroma between the low- and high-risk groups in the TCGA cohort. (b) Comparison of immune checkpoints between the low- and high-risk groups in the TCGA cohort. The statistical test used by nonparametric tests.
Figure 9
Figure 9
GSVA and determination of response to chemotherapy. (a) GSVA showing the activation states of biological pathways between the high- and low-risk groups. A heatmap was used to visualize the enriched biological processes. Red represents activated pathways, and blue represents inhibited pathways. (b) Correlation analysis between chemotherapeutic drug sensitivity and the model: the low-risk group had lower IC50 values for axitinib and camptothecin and a higher IC50 value for lapatinib.
Figure 10
Figure 10
Workflow diagram. Specific workflow diagram for data analysis.

Similar articles

Cited by

References

    1. Ferlay J., Colombet M., Soerjomataram I., et al. Cancer incidence and mortality patterns in Europe: estimates for 40 countries and 25 major cancers in 2018. European Journal of Cancer . 2018;103:356–387. doi: 10.1016/j.ejca.2018.07.005. - DOI - PubMed
    1. Rahib L., Smith B. D., Aizenberg R., Rosenzweig A. B., Fleshman J. M., Matrisian L. M. Projecting cancer incidence and deaths to 2030: the unexpected burden of thyroid, liver, and pancreas cancers in the United States. Cancer Research . 2014;74(11):2913–2921. doi: 10.1158/0008-5472.CAN-14-0155. - DOI - PubMed
    1. Cascinu S., Falconi M., Valentini V., Jelic S., ESMO Guidelines Working Group Pancreatic cancer: ESMO clinical practice guidelines for diagnosis, treatment and follow-up. Annals of Oncology . 2010;21(Suppl 5):v55–v58. doi: 10.1093/annonc/mdq165. - DOI - PubMed
    1. Latenstein A. E. J., van der Geest L., Bonsing B. A., et al. Nationwide trends in incidence, treatment and survival of pancreatic ductal adenocarcinoma. European Journal of Cancer . 2020;125:83–93. doi: 10.1016/j.ejca.2019.11.002. - DOI - PubMed
    1. Lepage C., Capocaccia R., Hackl M., et al. Survival in patients with primary liver cancer, gallbladder and extrahepatic biliary tract cancer and pancreatic cancer in Europe 1999-2007: results of EUROCARE-5. European Journal of Cancer . 2015;51(15):2169–2178. doi: 10.1016/j.ejca.2015.07.034. - DOI - PubMed