. 2022 May 25;25(6):104468.
doi: 10.1016/j.isci.2022.104468. eCollection 2022 Jun 17.

Genetic background and sex control the outcome of high-fat diet feeding in mice

Affiliations

Genetic background and sex control the outcome of high-fat diet feeding in mice

Alexis Maximilien Bachmann et al. iScience. .

Abstract

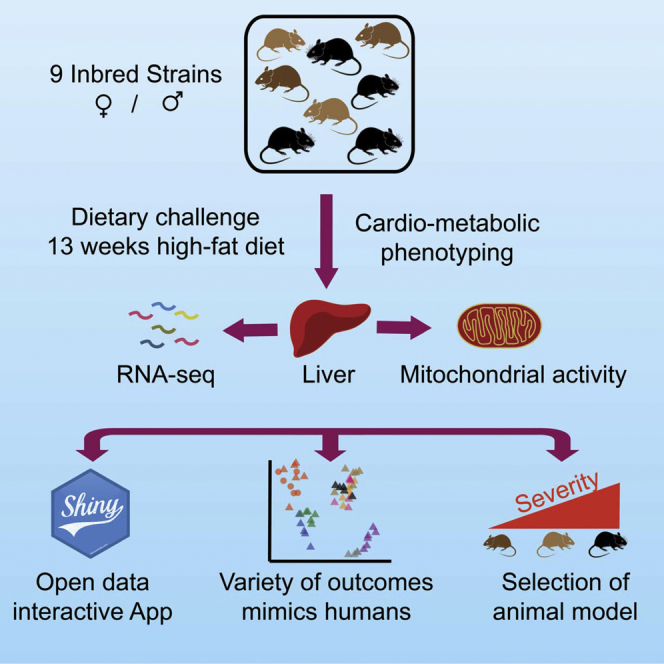
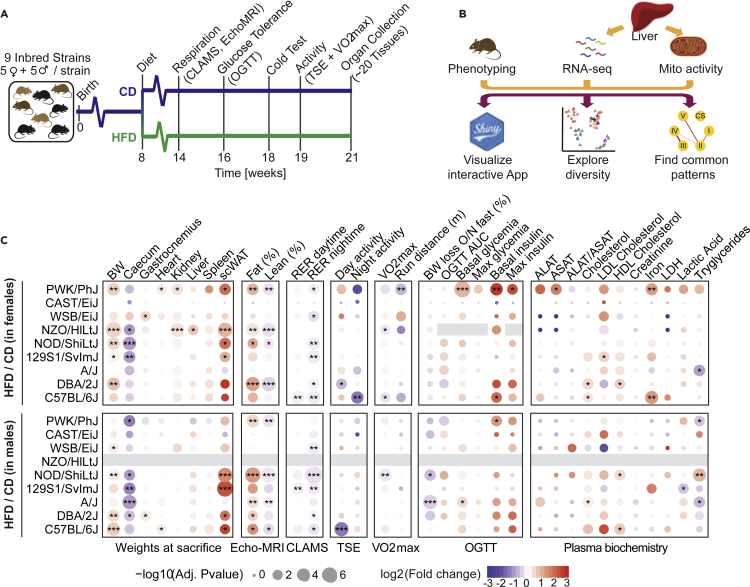
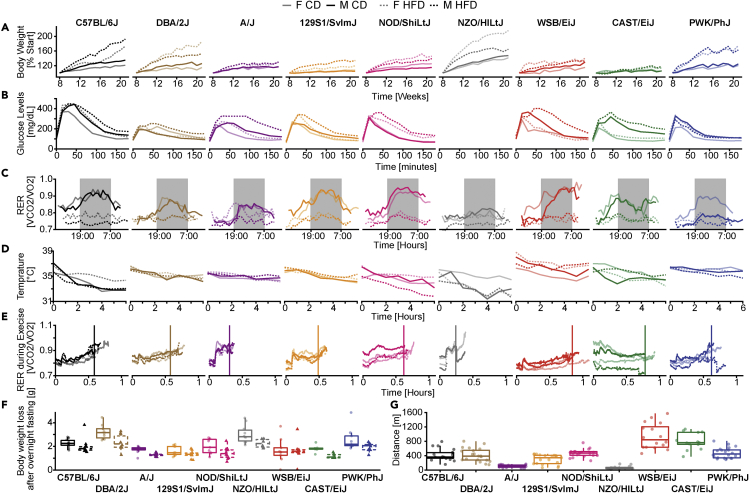
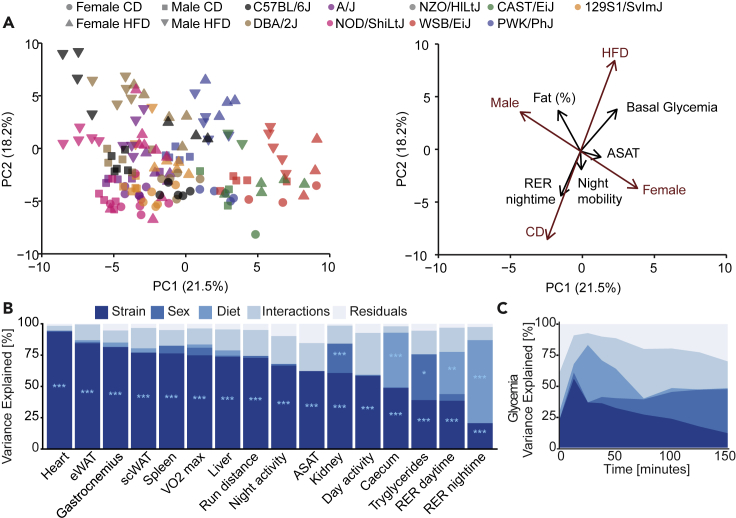
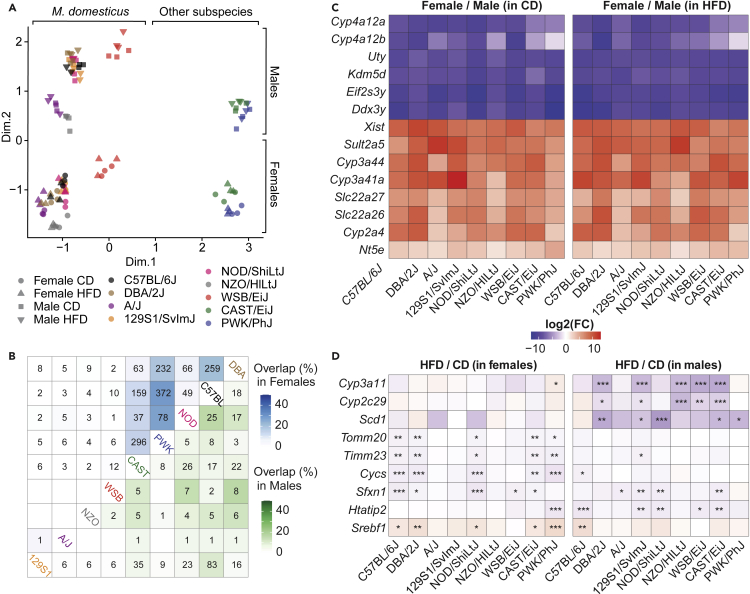
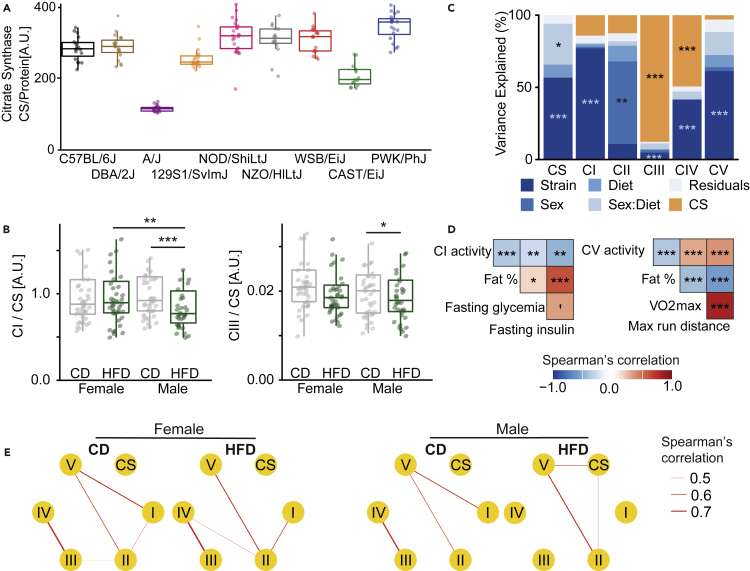
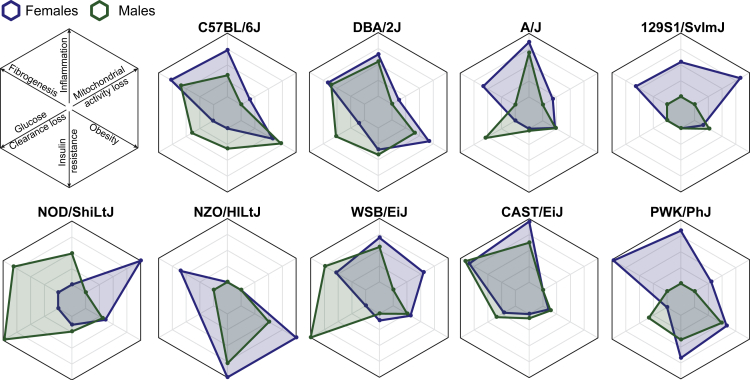
The sharp increase in obesity prevalence worldwide is mainly attributable to changes in physical activity and eating behavior but the metabolic and clinical impacts of these obesogenic conditions vary between sexes and genetic backgrounds. This warrants personalized treatments of obesity and its complications, which require a thorough understanding of the diversity of metabolic responses to high-fat diet intake. By analyzing nine genetically diverse mouse strains, we show that much like humans, mice exhibit a huge variety of physiological and biochemical responses to high-fat diet. The strains exhibit various degrees of alterations in their phenotypic makeup. At the transcriptome level, we observe dysregulations of immunity, translation machinery, and mitochondrial genes. At the biochemical level, the enzymatic activity of mitochondrial complexes is affected. The diversity across mouse strains, diets, and sexes parallels that found in humans and supports the use of diverse mouse populations in future mechanistic or preclinical studies on metabolic dysfunctions.

Keywords: Biological sciences; Endocrinology; Obesity medicine.


Conflict of interest statement

The authors declare no competing interests.

Figures

None
Graphical abstract
Figure 1
Figure 1
Study design and phenotypic diversity across strain, diet, and sex (A) Scheme of the phenotyping pipeline of the study. Nine mouse inbred strains were tested (C57BL/6J, DBA/2J, A/J, 129S1/SvImJ, NOD/ShiLtJ, NZO/HILtJ, WSB/EiJ, CAST/EiJ, and PWK/PhJ). Five females or five males per diet (CD or HFD) were measured per strain. Five mice per condition were fed an HFD from 8 to 21 weeks of age with CD matched animals. Respiration, tolerance to glucose and cold, exercise capacity, and spontaneous activity were tested. Mice were sacrificed at 21 weeks of age after an overnight fast, and organ collection was performed. (B) Schematic of the liver molecular phenotyping and data analysis. Livers were used for RNA-Seq and measurements of mitochondrial activity. (C) Heatmap of the effects of diet on a selection of measured metabolic traits, in males or females. ∗p < 0.05, ∗∗p < 0.01, ∗∗∗p < 0.001, t test (HFD versus CD), corrected for multiple testing with the Benjamin-Hochberg false discovery rate (BH-FDR) procedure.
Figure 2
Figure 2
Time-resolved variation of metabolic traits collected in this study (A) Body weight (expressed as percentage from the individual starting body weight before HFD). (B) Glucose levels during the course of an oral glucose gavage test (OGTT). (C) Circadian respiratory exchange ratio (RER) over a day using a metabolic chamber. (D) Rectal temperature taken during a cold test. (E) Uphill exercise respiratory exchange ratio (RER) during a VO2max experiment. Vertical line represents the mean time run per strain. (F) Body weight loss after an overnight fasting. Male and female mice showed similar trends and are pictured together. Left boxplots: CD; right boxplots: HFD. (G) Distance run by the HFD-fed mice during the VO2max experiment. Male and female mice showed similar trends and are pictured together. Boxplot lower and upper hinges correspond to the first and third quartiles, and center line is the median. The whiskers extend from the hinge to the largest value no further than 1.5 ∗ inter-quartile range.
Figure 3
Figure 3
Variation in metabolic traits is driven by distinct contributions of genetic background, sex, and diet (A) Principal component analysis plot of the metabolic and clinical traits measured in the study. Individual mice are shown (left). Loadings are shown for selected phenotypes as well as gender and diet (right). Principal component 1 is associated with a combination of strain and sex, whereas PC2 is associated with the diet. Black arrows: phenotypic traits. Brown arrows: covariates. (B) Proportion of variance of metabolic traits explained by a linear combination of strain, sex, and diet effects, their interactions, and the residuals of the linear model (Phenotype ∼ Strain ∗ Sex ∗ Diet), expressed as the mean type II sums of squares divided by the total mean type II sum of squares. Mean sum of squares is equal to the sum of squares divided by the corresponding degrees of freedom. ∗p < 0.05, ∗∗p < 0.01, ∗∗∗p < 0.001, ANOVA test corrected for multiple testing. (C) Variance of glycemia explained by strain, sex, and diet effects, their interactions during oral glucose gavage test (OGTT) over time.
Figure 4
Figure 4
The transcriptome signature of HFD differ between strains and sexes (A) Multidimensional scaling (MDS) plot of liver RNA-Seq separates animals by subspecies and sex. Euclidean distances between each animal were calculated pairwise based on the leading log2-fold changes for the 500 most differentially expressed genes. Each dot or triangle represents a single female or male mouse, respectively. Each color is assigned to a specific strain. (B) Number of overlapping differentially expressed genes (diet effect; HFD/CD) across strains of the same sex (female: top left, male: bottom right). Color code representing the percentage of overlapping genes is based on the Jaccard index. (C) Heatmaps of log2 fold change of the 14 most conserved sexually dimorphic genes across strains and diets. All the fold changes are significant with BH-FDR adjusted p value<0.05. (D) Heatmaps of log2 fold change of the 9 genes affected by diet in the highest number of strains at the same time. The same color scale was used for panel C & D. Moderated t test; ∗p < 0.05, ∗∗p < 0.01, ∗∗∗p < 0.001; adjusted p value corrected for multiple testing with the BH-FDR procedure.
Figure 5
Figure 5
HFD affects immunity, lipid metabolism, and liver translation in a sex- and strain-dependent manner (A) Scheme of gene set enrichment analysis based on variance explained by diet, sex, and their interaction. (1) For each transcript, we computed the variance explained based on a linear model of strain, sex, diet, and their interactions (Transcript ∼ Strain + Diet + Sex + Diet:Sex). Then the percentage of variance explained of each transcript was assigned to specific parameters (diet, sex, and their interactions); (2) for ranking of the genes; and then (3) to perform gene set enrichment analysis for each parameter. (B) Results of gene set enrichment analysis based on variance explained by diet, sex, and their interaction. From left to right, each enrichment was performed on gene ontology of biological processes (GOBP), cellular component (GOCC), and transcription factors. Percentage of variance explained was measured using variantPartition package. (C) Enrichment analysis of the diet effect on liver gene expression separated by sex and strain. Gene set enrichment analysis was performed on the sign (log2 (FC)) ∗ –log10 (adjusted p value) per strain per sex. The selected gene sets add the highest score for the global response to the diet in a specific sex. GSEA permutation test; ∗p < 0.05, ∗∗p < 0.01, ∗∗∗p < 0.001; adjusted p value corrected for multiple testing with the BH-FDR procedure.
Figure 6
Figure 6
Liver mitochondrial activity correlates with metabolic phenotypes, and correlations between complexes are disrupted by HFD in males (A) Citrate synthase activity (A.U.). All sexes and diets are pictured together as they differed only minorly, showing that CS is principally affected by strain. Boxplot lower and upper hinges correspond to the first and third quartiles, and center line is the median. The whiskers extend from the hinge to the largest value no further than 1.5 ∗ inter-quartile range. (B) Complex II and complex III activity (normalized by citrate synthase activity) is affected by diet in sex-specific manner. (C) Proportion of variance of liver mitochondrial activity explained by strain, sex, diet, sex-by-diet interactions (sex:diet), and citrate synthase (CS) activity. Each bar corresponds to the activity of the different complexes of the electron transport chain as well as the citrate synthase activity or a model that takes all the complexes together into account (ALL). ∗p < 0.05, ∗∗p < 0.01, ∗∗∗p < 0.001, ANOVA test. (D) Spearman’s correlations between the activity of liver mitochondrial complexes and essential cardio-metabolic traits. ∗p < 0.05, ∗∗p < 0.01, ∗∗∗p < 0.001, correlation test, corrected for multiple testing with the BH-FDR procedure. (E) Correlation network of liver mitochondrial complex activities in each condition. The width of the edges corresponds to the magnitude of positive correlation between complexes. Only significant edges are shown (Benjamini-Hochberg adjusted-p <0.05).
Figure 7
Figure 7
Strain-specific response signatures to obesogenic diet Radar plots of some hallmarks reflecting predisposition to metabolic disease in each strain. Each parameter is expressed as a percentage of the highest strain. Fibrogenesis and inflammation scores are based on the normalized enrichment score of the GSEA for “collagen-containing extracellular matrix” and “humoral immune response,” respectively. Insulin resistance is based on Homa-IR value under HFD. Obesity is based on body weight gain relative to the starting weight before HFD. Finally, glucose clearance loss is the change in the slope of glucose clearance in the OGTT test upon HFD (missing data in the NZO strain, due to a too severe phenotype).

References

    1. Alhindi Y., Vaanholt L.M., Al-Tarrah M., Gray S.R., Speakman J.R., Hambly C., Alanazi B.S., Gabriel B.M., Lionikas A., Ratkevicius A. Low citrate synthase activity is associated with glucose intolerance and lipotoxicity. J. Nutr. Metab. 2019;2019:1–14. doi: 10.1155/2019/8594825. - DOI - PMC - PubMed
    1. Atsumi A., Ueda K., Irie F., Sairenchi T., Iimura K., Watanabe H., Iso H., Ota H., Aonuma K. Relationship between cold temperature and cardiovascular mortality, with assessment of effect modification by individual characteristics. Circ. J. 2013;77:1854–1861. doi: 10.1253/circj.cj-12-0916. - DOI - PubMed
    1. Barrington W.T., Wulfridge P., Wells A.E., Rojas C.M., Howe S.Y.F., Perry A., Hua K., Pellizzon M.A., Hansen K.D., Voy B.H., et al. Improving metabolic health through precision dietetics in mice. Genetics. 2018;208:399–417. doi: 10.1534/genetics.117.300536. - DOI - PMC - PubMed
    1. Blüher M. Obesity: global epidemiology and pathogenesis. Nat. Rev. Endocrinol. 2019;15:288–298. doi: 10.1038/s41574-019-0176-8. - DOI - PubMed
    1. Bournat J.C., Brown C.W. Mitochondrial dysfunction in obesity. Curr. Opin. Endocrinol. Diabetes Obes. 2010;17:446–452. doi: 10.1097/MED.0b013e32833c3026. - DOI - PMC - PubMed