. 2022 May 23:13:866681.
doi: 10.3389/fmicb.2022.866681. eCollection 2022.

High-Pressure Microfluidics for Ultra-Fast Microbial Phenotyping

Affiliations

High-Pressure Microfluidics for Ultra-Fast Microbial Phenotyping

Anaïs Cario et al. Front Microbiol. .

Abstract

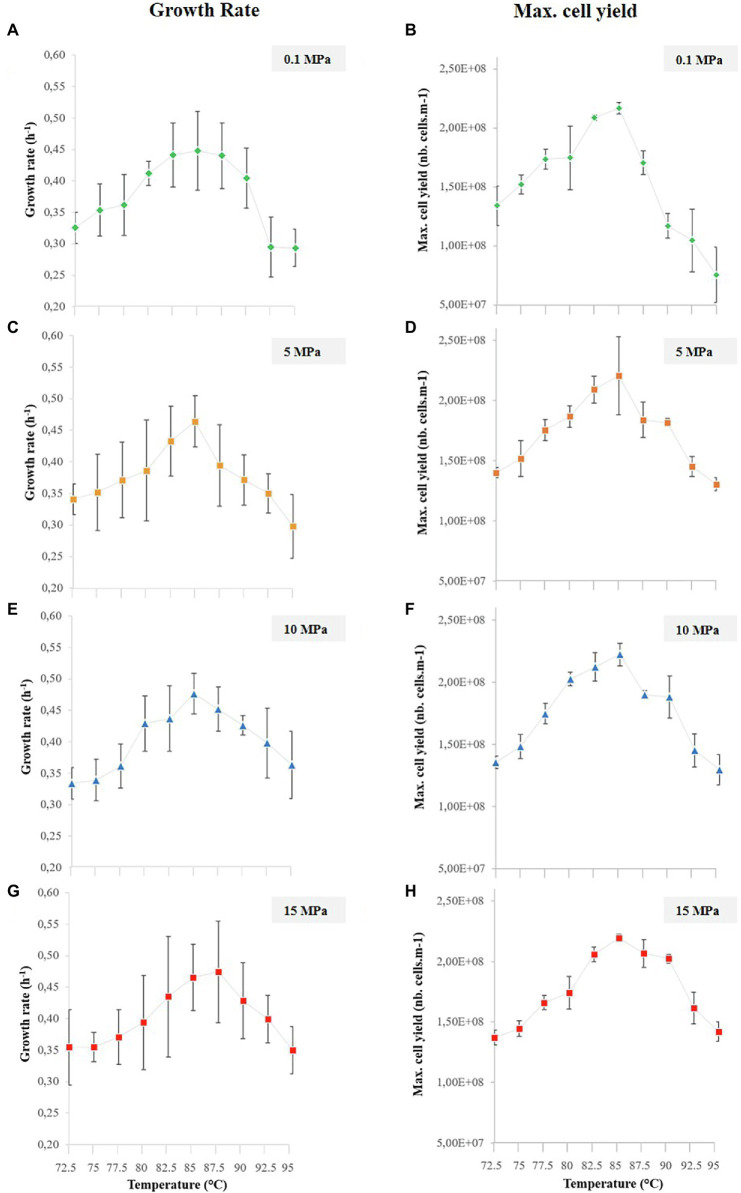
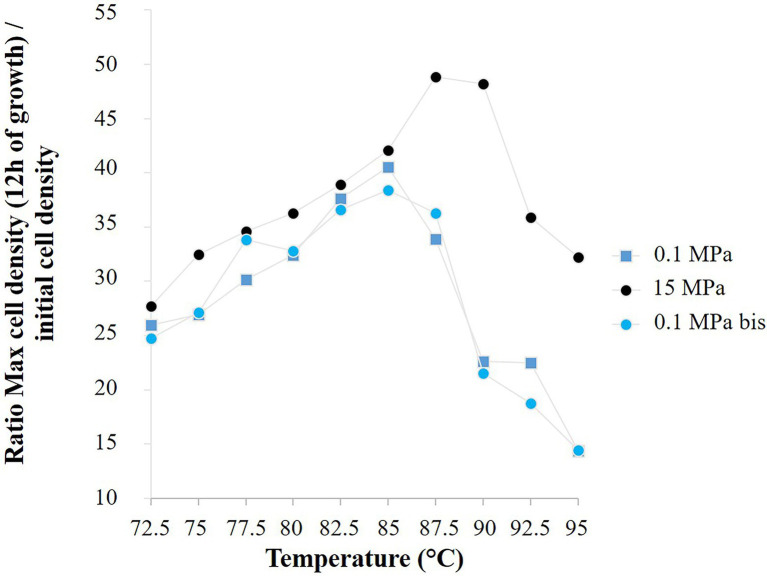
Here, we present a novel methodology based on high-pressure microfluidics to rapidly perform temperature-based phenotyping of microbial strains from deep-sea environments. The main advantage concerns the multiple on-chip temperature conditions that can be achieved in a single experiment at pressures representative of the deep-sea, overcoming the conventional limitations of large-scale batch metal reactors to conduct fast screening investigations. We monitored the growth of the model strain Thermococcus barophilus over 40 temperature and pressure conditions, without any decompression, in only 1 week, whereas it takes weeks or months with conventional approaches. The results are later compared with data from the literature. An additional example is also shown for a hydrogenotrophic methanogen strain (Methanothermococcus thermolithotrophicus), demonstrating the robustness of the methodology. These microfluidic tools can be used in laboratories to accelerate characterizations of new isolated species, changing the widely accepted paradigm that high-pressure microbiology experiments are time-consuming.

Keywords: deep-sea microorganisms; fast screening; high-pressure microfluidics; phenotyping; real time investigations.


Conflict of interest statement

The authors declare that the research was conducted in the absence of any commercial or financial relationships that could be construed as a potential conflict of interest.

Figures

Figure 1
Figure 1
(A) Design of the temperature-gradient microreactor developed and used in this study with a microscope picture of the micropools used for both Thermococcus barophilus and Methanothermococcus thermolithotrophicus cultivation. (B) Different feeding strategies implemented into the microfluidic setup using growth medium phases and several interfaces. (C) Pictures of the concerning cultivation interfaces into the microreactor.
Figure 2
Figure 2
Set-up of the high-pressure microfluidics platform for phenotyping microorganisms at temperature (see the description in the text).
Figure 3
Figure 3
Schematic flowsheet for determination of cell concentration in each pool. (A) Determination of micropool volumes using 3D confocal microscopy and ImageJ analysis and (B) examples of pictures of Thermococcus barophilus growth over time with the corresponding cell number (n) at 15 MPa and 85°C (scale bar = 25 μm), allowing determination of cell concentration (cells.ml−1). (C) Growth curve with cell number versus time (15 MPa, 85°C).
Figure 4
Figure 4
Thermococcus barophilus growth rates (left column) and maximal cell yields (right column) over 10 temperature conditions (i.e., 72.5°C–95°C) for several pressure conditions, while growing in the temperature gradient on-a-chip: (A) T. barophilus growth rates at 0.1 MPa. (B) T. barophilus maximum cell densities at 0.1 MPa. (C) T. barophilus growth rates at 5 MPa. (D) T. barophilus maximum cell densities at 5 MPa. (E) T. barophilus growth rates at 10 MPa. (F) T. barophilus maximum cell densities at 10 MPa. (G) T. barophilus growth rates at 15 MPa. (H) T. barophilus maximum cell densities at 15 MPa. Error bars represent the SD from the four replicates on a single experiment using the gradient on chip microfluidic setup.
Figure 5
Figure 5
Methanothermococcus thermolithotrophicus growth comparison in a temperature gradient-on-a-chip between two-pressure conditions, 5 and 10 MPa total pressure (2 and 3 MPa of partial pressure of H2/CO2, respectively). Ratio of the mean cell density after 18 h of growth to the corresponding mean initial cell density, for two temperature gradient microfluidic experiments (temperature: 60.1°C–70°C).
Figure 6
Figure 6
Ratio of the mean cell density of Thermococcus barophilus after 12 h of growth to the corresponding mean initial cell density, for three temperature gradient microfluidic experiments (72.5°C–95°C): atmospheric pressure (0.1 MPa) in a microchip of 1.5 nl pool volume, both 15 MPa and atmospheric pressure (0.1 MPa bis) in a microchip of 1.9 nl pool volume.

References

    1. Adan A., Alizada G., Kiraz Y., Baran Y., Nalbant A. (2017). Flow cytometry: basic principles and applications. Crit. Rev. Biotechnol. 37, 163–176. doi: 10.3109/07388551.2015.1128876, PMID: - DOI - PubMed
    1. Alain K., Querellou J. (2009). Cultivating the uncultured: limits, advances and future challenges. Extremophiles 13, 583–594. doi: 10.1007/s00792-009-0261-3, PMID: - DOI - PubMed
    1. Bao C., Gai Y., Lou K., Jiang C., Ye S. (2010). High-hydrostatic-pressure optical chamber system for cultivation and microscopic observation of deep-sea organisms. Aquat. Biol. 11, 157–162. doi: 10.3354/ab00303 - DOI
    1. Bar-On Y. M., Phillips R., Milo R. (2018). The biomass distribution on earth. Proc. Natl. Acad. Sci. U. S. A. 115, 6506–6511. doi: 10.1073/pnas.1711842115, PMID: - DOI - PMC - PubMed
    1. Beaton A. D., Schaap A. M., Pascal R., Hanz R., Martincic U., Cardwell C. L., et al. . (2022). Lab-on-chip for in situ analysis of nutrients in the deep sea. ACS sensors 7, 89–98. doi: 10.1021/acssensors.1c01685, PMID: - DOI - PubMed

LinkOut - more resources