

Morphological and transcriptional evaluation of multiple facial cutaneous hyperpigmented spots
- PMID: 35677918
- PMCID: PMC9168023
- DOI: 10.1002/ski2.96
Morphological and transcriptional evaluation of multiple facial cutaneous hyperpigmented spots
Abstract
Background: Morphological characteristics of major facial hyperpigmented spots have been well documented. However, detailed alterations of respective transcriptional profile for each spot and in-depth comparisons across multiple spot types have not been reported.
Objectives: To comprehensively assess and compare multiple facial hyperpigmented spot types at the morphological and molecular levels by utilising transcriptional expression profiling with correlation to quantified histological features.
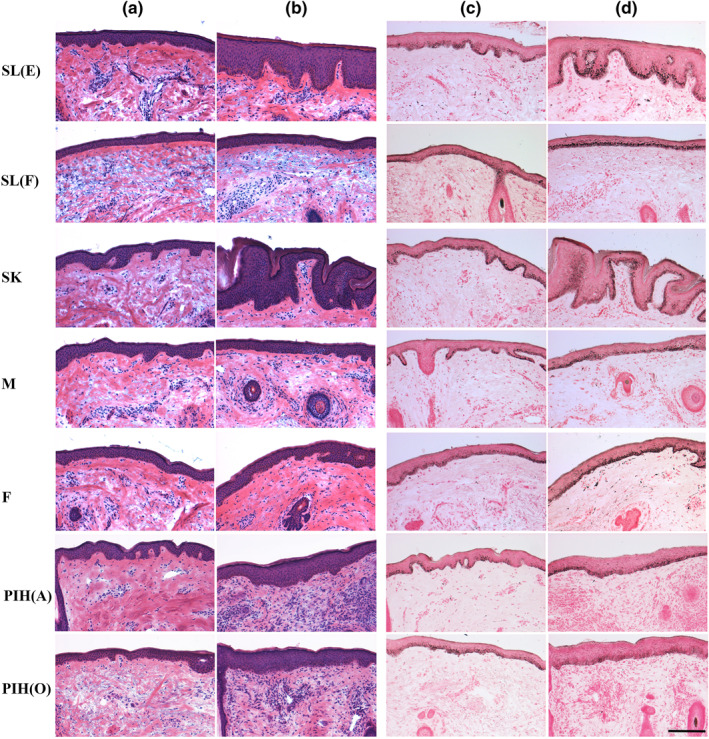
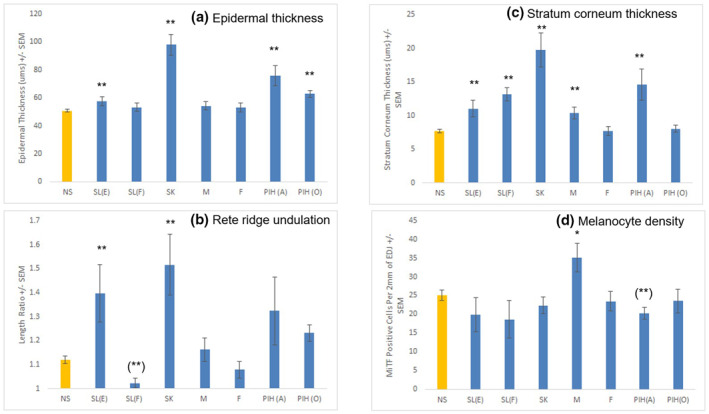
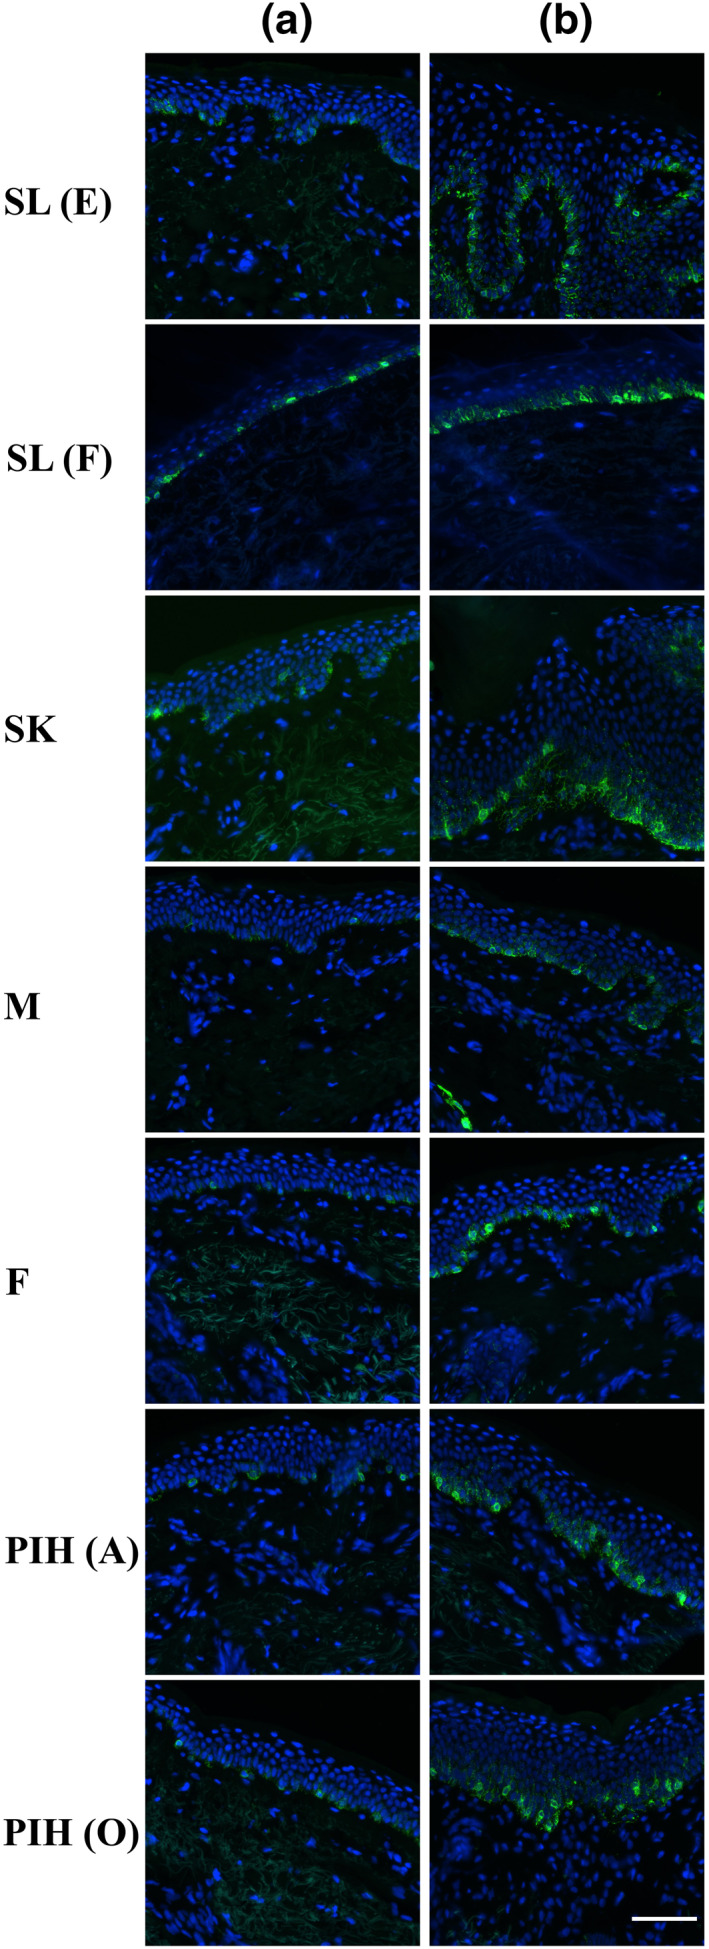
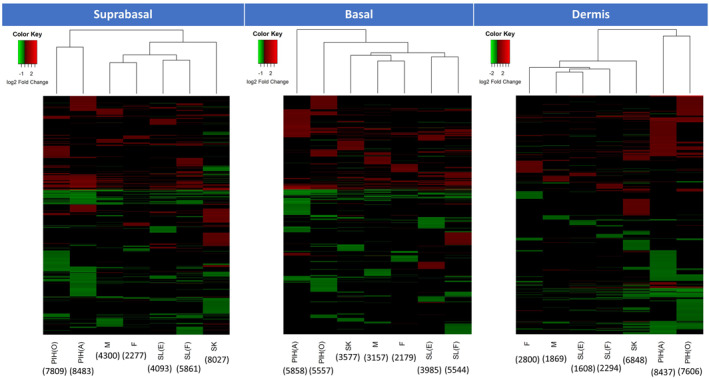
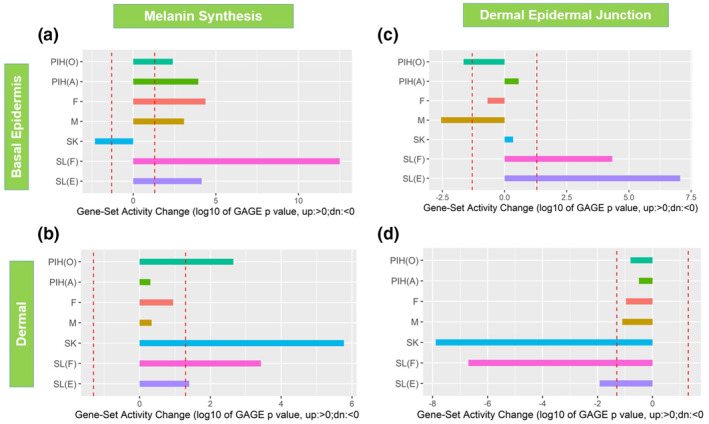
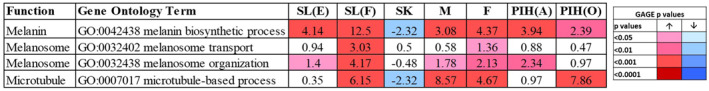
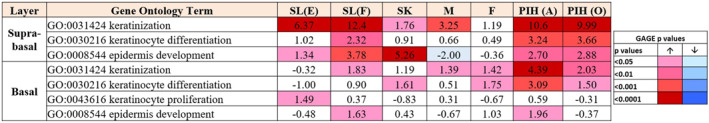
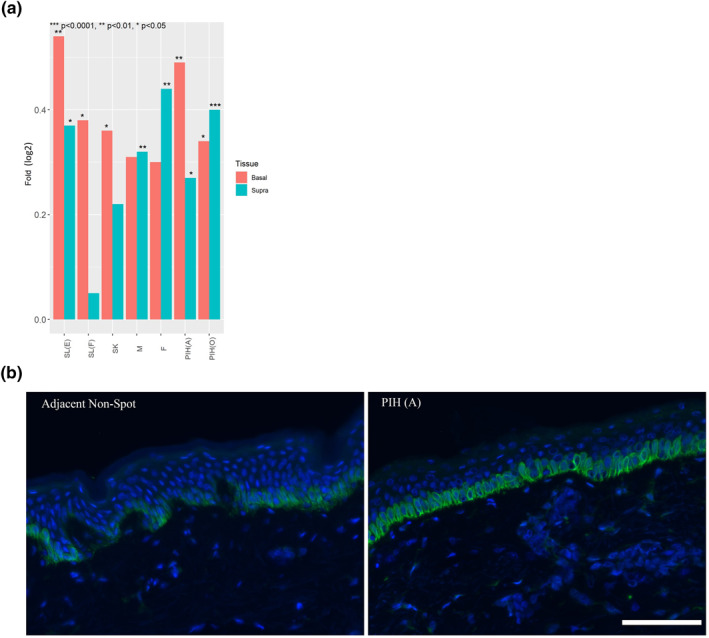
Methods: Multiple types of facial spot biopsies were collected from Chinese women and compared to additional biopsies taken from adjacent healthy skin. The types of spots included Solar Lentigos with both elongated dermal-epidermal junction (DEJ) (SL[E]) and flat DEJ (SL[F]), Seborrhoeic Keratosis (SK), Melasma, Freckles, Post-inflammatory hyperpigmentation of resolving acne (PIH[A]) and other stimuli (PIH[O]). Combined histomorphometry, immunohistology, and transcriptome analysis for suprabasal-epidermis, basal-epidermis, and dermal compartments dissected by Laser Capture Microdissection (LCM) were conducted and compared across different spot types.
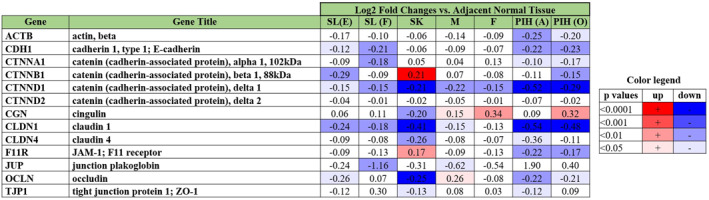
Results: Each spot type was confirmed to have the unique histological pathology already documented elsewhere. Most of the spot types except Melasma and PIH (A) revealed similar melanocyte density to adjacent skin. All spots exhibited increased melanin synthesis, melanosome transportation, as well as enhanced melanocyte dendricity, however, each spot revealed a distinct transcriptome regulation pattern in pigmentation pathways. Upregulation of pigmentation genes was also observed in the dermis of SL(F), SL(E), SK and PIH(O), associated with significant modulation of DEJ related genes in basal-epidermis and/or dermal compartments, suggesting potential melanocyte infiltration into the dermis due to impaired DEJ quality. Beyond upregulated pigmentation, for most spots, gene expression in the suprabasal-epidermis regulating keratinisation was significantly upregulated in conjunction with thickened stratum corneum. Furthermore, downregulation of tight junction related genes represented by claudin-1 was observed in majority of spot types, suggesting compromised barrier function could be a similarity across spots. Additionally, Cyclin-Dependent Kinase Inhibitor 2A (CDKN2A) was upregulated in all types of spots, indicating involvement of cell senescence as a common theme.
Conclusion: This comprehensive and comparative study based on the histological and transcriptional analysis of three skin compartments provided unique insights into specific causations as well as differences and similarities across multiple hyperpigmented spot types.
© 2022 The Authors. Skin Health and Disease published by John Wiley & Sons Ltd on behalf of British Association of Dermatologists.
Conflict of interest statement
The authors declare they have no conflicts of interest.
Figures
References
-
- Slominski A, Tobin DJ, Shibahara S, Wortsman J. Melanin pigmentation in mammalian skin and its hormonal regulation. Physiol Rev. 2004;84(4):1155–228. - PubMed
-
- Aoki H, Moro O, Tagami H, Kishimoto J. Gene expression profiling analysis of solar lentigo in relation to immunohistochemical characteristics. Br J Dermatol. 2007;156:1214–23. - PubMed
-
- Nordlund JJ, Boissy RE, Hearing VJ, King RA, Oetting WS, Ortonne J‐P. The pigmentary system. 2nd ed. Oxford: Blackwell Publishing; 2006.
-
- Ortonne J‐P, Bissett DL. Latest insights into skin hyperpigmentation. J Invest Dermatol Symp Proc. 2008;13:10–4. - PubMed
LinkOut - more resources
Full Text Sources
Miscellaneous