. 2022 Nov;59(11):e14108.
doi: 10.1111/psyp.14108. Epub 2022 Jun 9.

The influence of temporal unpredictability on the electrophysiological mechanisms of neural entrainment

Affiliations

The influence of temporal unpredictability on the electrophysiological mechanisms of neural entrainment

Adrià Vilà-Balló et al. Psychophysiology. 2022 Nov.

Abstract

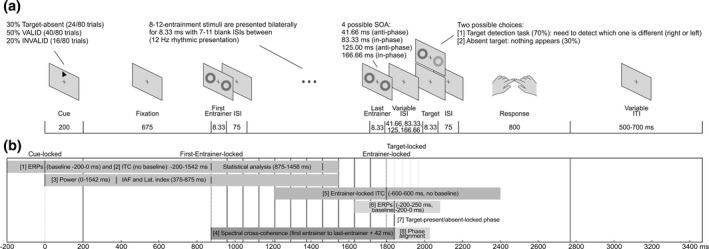
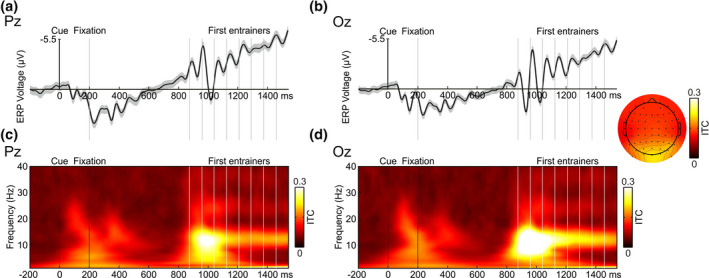
Neural entrainment, or the synchronization of endogenous oscillations to exogenous rhythmic events, has been postulated as a powerful mechanism underlying stimulus prediction. Nevertheless, studies that have explored the benefits of neural entrainment on attention, perception, and other cognitive functions have received criticism, which could compromise their theoretical and clinical value. Therefore, the aim of the present study was [1] to confirm the presence of entrainment using a set of pre-established criteria and [2] to establish whether the reported behavioral benefits of entrainment remain when temporal predictability related to target appearance is reduced. To address these points, we adapted a previous neural entrainment paradigm to include: a variable entrainer length and increased target-absent trials, and instructing participants to respond only if they had detected a target, to avoid guessing. Thirty-six right-handed women took part in this study. Our results indicated a significant alignment of neural activity to the external periodicity as well as a persistence of phase alignment beyond the offset of the driving signal. This would appear to indicate that neural entrainment triggers preexisting endogenous oscillations, which cannot simply be explained as a succession of event-related potentials associated with the stimuli, expectation and/or motor response. However, we found no behavioral benefit for targets in-phase with entrainers, which would suggest that the effect of neural entrainment on overt behavior may be more limited than expected. These results help to clarify the mechanistic processes underlying neural entrainment and provide new insights on its applications.

Keywords: EEG; alpha rhythm; endogenous oscillations; entrainment; phase synchronization; temporal unpredictability.


Conflict of interest statement

The project leading to these results has received funding from “la Caixa” Foundation under the project code LCF/PR/PR16/51110005 and has been co‐funded with 50% by the European Regional Development Fund under the framework of the ERFD Operative Programme for Catalunya 2014–2020, with a grant of 1.527.637,88€. AVB is supported by the Spanish MICINN Juan de la Cierva postdoctoral grant (FJC2018‐036804‐I), and AMM by a predoctoral grant from the “Fundació Institut de Recerca Hospital Universitari Vall d'Hebron” (VHIR/BEQUESPREDOC/2020/MARTI). AVB and AMM have received a postdoctoral and a predoctoral contract respectively, from the “La Caixa” Foundation. SS‐F is supported by grants from the Ministerio de Ciencia e Innovación (PID2019‐108531GB‐I00 AEI/FEDER) and AGAUR Generalitat de Catalunya (2017 SGR 1545). PPR has received honoraria as a consultant and speaker for Allergan, Almirall, Biohaven, Chiesi, Eli Lilly, Medscape, Neurodiem, Novartis, and Teva. Her research group has received research grants from Allergan, AGAUR, la Caixa foundation, Migraine Research Foundation, Instituto Investigación Carlos III, MICINN, PERIS; and has received funding for clinical trials from Alder, Electrocore, Eli Lilly, Novartis, and Teva. She is a trustee member of the board of the International Headache Society and a member of the Council of the European Headache Federation. She is on the editorial board of Revista de Neurologia. She is an editor for Frontiers of Neurology and the Journal of Headache and Pain. She is a member of the Clinical Trials Guidelines Committee of the International Headache Society. She has edited the Guidelines for the Diagnosis and Treatment of Headache of the Spanish Neurological Society. She is the founder of www.midolordecabeza.org. PPR does not own stocks from any pharmaceutical company. Despite the above mentioned funding, the authors declare have no conflict of interest, financial or otherwise, related directly or indirectly to this work.

Figures

FIGURE 1
FIGURE 1
(a) Schematic illustration of a single trial of the cued, visual detection paradigm with bilateral entrainment. Participants were instructed to fixate on a central cross at all times. Each trial began with the appearance of a directional cue arrow pointing either to the right or to the left. After a fixed delay, a flashing sequence of synchronous bilateral annuli (entrainers) of variable length (8 to 12), with fixed inter‐stimulus intervals, was presented around the target location. The inter‐stimulus interval between the last entrainer and the target consisted of one of four possible options, with two target onsets occurring in‐phase and two anti‐phase with the rhythmic entrainers. On 70% of trials, otherwise referred to as target‐present trials, a target could be presented at the spatially valid location (gray) or the spatially invalid one (black) and consisted of the same bilateral annuli but with one of the annuli containing a Gabor patch. Gabor patch contrast was set to a 60% detection threshold using a single‐interval adjustment matrix prior to beginning the detection task. On the remaining 30% of trials, referred to as absent‐target trials, the target was absent, and no annuli or Gabor patch were presented. Finally, participants were asked to indicate using the appropriate response keys the side on which the target had appeared, or to withhold their response if they did not see a target. The next trial began after a variable inter‐trial interval. (b) Schematic illustration of the time windows used for each one of the analyses. For illustration purposes, entrainer stream length was fixed at 12 entrainers and target‐locked analyses were fixed to the first anti‐phase target onset. The first set of analyses were carried out using cue‐locked data and were comprised of the following and their respective time windows. [1] ERP/SSVEP analyses, time window: 200 ms to 1542 ms (baseline: −200 ms to 0 ms). [2] ITC analysis, same analysis as [1] but without a baseline. The time window of interest to assess that data were significantly concentrated throughout the entire entrainer stream was from 875 ms to 1458 ms (from the 1st to the 8th entrainer). [3] Power analyses to explore IAF and lateralized alpha activity, time window: 0 ms to 1542 ms, once again no baseline was employed. The spectral power for the IAF and time‐frequency for the lateralization index analysis were obtained from 375 ms to 875 ms. Additionally, [4] for the spectral cross coherence analysis, we selected from the onset of the first entrainer to the offset of the last entrainer plus one half‐cycle (+42 ms), which corresponds to the first anti‐phase target onset. The time window varied depending on the last entrainer (from 8 to 12). The next analysis was carried out using entrainer‐locked data and is presented with its respective time window. Please note, that due to the variable length of the entrainer stream, the last entrainer could correspond to either one of the ordinal values between 8 and 12. [5] ITC analysis, time window: −600 ms to 600 ms, no baseline. The final set of analyses were carried out on target‐locked (target‐present/target‐absent) data, along with their respective time windows. [6] ERP analyses, as a function of relative phase (anti‐phase/in‐phase) on target‐present and target‐absent trials, time window: −200 ms to 250 ms (baseline: −200 ms to 90 ms). [7] 12 Hz phase at target onset analysis. Here data were separately time‐locked to target onset times (target‐present trials) or to the moments in‐time where targets were expected to occur (target‐absent trials) and divided as a function of relative phase (anti‐phase/in‐phase). Finally, [8] to examine whether the phase continued aligned after the disappearance of the external rhythm, we restricted the analysis to target‐absent correct trials. The time window was selected to contain 3 cycles of possible target onset times, where 1 cycle was equivalent to one anti‐phase and consecutive in‐phase presentation. The specific time window was 41.5 ms to 250 ms with respect to the last entrainer. (c) Schematic illustration of the time windows used for the control analyses which were performed using STFT instead of complex Morlet wavelets. For illustrative purposes, entrainer stream length was fixed at 12 entrainers and only one of the multiple contrasts was shown for each analysis. Please, note than the time‐window and conditions employed for entrained‐locked ITC [1] and for the [2] phase analyses at target‐present/target‐absent trials were the same as described above. [3] Circular correlations between the phase obtained at the offset of the last entrainer (10 ms post‐onset) and the four target onsets (anti‐phase 1, in‐phase 1, anti‐phase 2, and in‐phase 2), on target‐absent trials. [4] Circular correlation between the 12 Hz phase 166 ms pre‐target onset and the reaction‐times for target‐present trials, separated as a function of the four possible target onset times (anti‐phase 1, in‐phase 1, anti‐phase 2, and in‐phase 2). [5] Phase (166 ms pre‐target) opposition analysis between correct and incorrect trials. The four possible target onset times were collapsed into two groups (anti‐phase and in‐phase) to ensure we had a sufficient number of trials
FIGURE 2
FIGURE 2
(a) Line graph of the mean hit rates and standard errors of the mean, as a function of relative phase (x axis) and spatial validity (separate lines). (b) Violin plots of the hit rates, separated as a function of spatial validity, while collapsing the four possible target onset times into two relative phases (anti‐phase and in‐phase). Dots represent individual data, the central squares the median, and vertical lines the interquartile range. (c) Line graph of the mean reaction‐times and standard errors of the mean, as a function of relative phase (x axis) and spatial validity (separate lines). (d) Violin plots of the reaction‐times, separated as a function of spatial validity, while collapsing the four possible target onset times into two relative phases (anti‐phase and in‐phase). Dots represent individual data, the central squares the median, and vertical lines the interquartile range. Line and bar colors indicate spatial validity (valid: dark gray, invalid: light gray). (e) Hazard Rate (HR) at each of the 12 times of our task and for the four times of Kizuk and Mathewson's (2017) task. (f) Violin plot of the IAF obtained between 5 and 15 Hz at the selected ROI. An alpha peak was detected in all participants with one exception
FIGURE 3
FIGURE 3
(a) Cue‐locked grand average ERP with its SEM at Pz electrode. (b) Cue‐locked grand average ERP with its SEM at Oz electrode. (c) Cue‐locked ITC at Pz electrode. (d) Cue‐locked ITC at Oz electrode. The time window selected for these graphs was −200 ms to 1542 ms (baseline from −200 ms to 0 ms). The cue, fixation cross, and first eight entrainers are depicted as vertical lines. Only correct trials were included, and epochs were collapsed across relative phase and spatial validity, as well as target‐present and target‐absent trials. An increase of ITC around 12 Hz was clearly observed throughout the entrainer period. A topographical map of the ITC at 10–14 Hz during the time‐period comprising the first to the eighth entrainer is depicted
FIGURE 4
FIGURE 4
Entrainer‐locked ITC graphs at 12 Hz obtained using complex Morlet wavelets. (a) Represents target‐present trials at Pz electrode. (b) Represents target‐absent trials at Pz electrode. (c) Represents target‐present trials at Oz electrode. (d) Represents target‐absent trials at Oz electrode. The time window for these graphs was −600 ms to 675 ms (no baseline). White, solid, vertical lines denote the last eight entrainers. Black, solid, vertical lines depict anti‐phase and in‐phase times (41.5, 83.3, 125, 166.6 ms after the last entrainer), whereas black, discontinuous, vertical lines represent one additional cycle of anti‐phase and in‐phase times (208.25 ms, 250 ms after the last entrainer) considered for the phase alignment analysis. Only correct trials were included and epochs were collapsed across relative phase and spatial validity. An increase of ITC around 12 Hz was clearly observed throughout the entrainer period and right through the target period. Separate topographical maps for target‐present (left) and target‐absent (right) trials of the ITC at 10–14 Hz are depicted. The time‐period used for these maps consists of the time from the onset of the last entrainer to the last possible time point at which the target could appear
FIGURE 5
FIGURE 5
Schematic illustrations of the difference in activity on target‐locked trials. Analyses were performed separately, using correct trials only, for target‐present and target‐absent data. Phases were obtained using complex Morlet wavelets. (a) Represents target‐present trials at Pz electrode. (b) Represents target‐absent trials at Pz electrode. (c) Represents target‐present trials at Oz electrode. (d) Represents target‐absent trials at Oz electrode. In each representation, four graphs are depicted. On the top right, the graphs represent the broadband ERPs with its SEMs, time‐locked to target appearance (target‐present trials) or expected target appearance (target‐absent trials) (−200 ms to 250 ms, baseline: −200 ms to 0 ms). On the left, the circular graphs represent, for each participant (dots), the mean angular difference of the phase between in‐phase and anti‐phase trials. The length of the arrow is representative of the grand average of the mean differences. A clear 180° phase difference at 12 Hz between the phase of in‐phase (red) and anti‐phase (black) trials, with respect to the entrainers can be observed. Finally, the bottom rows show circular histograms where the bars represent the proportion of trials (pooled across all participants with no phase re‐alignment for the 20 possible phase bins) for anti‐phase (left) and in‐phase (right). Upon closer examination, an opposite phase preference for in‐phase and anti‐phase can be observed on both target‐present and target‐absent trials
FIGURE 6
FIGURE 6
(a) Representation of alpha (7–14 Hz) power lateralization from 0 ms to 1542 ms post‐cue (no baseline was used). Only correct trials were included in this analysis. The lateralization index was obtained by subtracting the previously obtained attended‐left average alpha power (ipsi left‐contra left) from the attended‐right average alpha power (ipsi right‐contra right) and dividing by the sum of the two. For the topographic plots, the average alpha power (7–14 Hz) for each electrode ipsilateral and contralateral to the cue on both left and right cue (attended‐left/attended‐right) trials was computed, at the time window 375 ms to 875 ms relative to cue onset (500 ms before the onset of the first entrainer). Please, note that we used the real activity for the left electrodes and the simulated activity for the right electrodes. Similarly, for the left cue, we used the real activity for the right electrodes, and the simulated for the left electrodes. (b) The bar graph represents the average power at 7–14 Hz, at the time window 375 ms to 875 ms relative to cue onset, for the electrodes contralateral (red) and ipsilateral (blue) to the cue on both left and right cue sides (attended‐left/attended‐right). (c) Finally, the lateralization index (explained above) for each participant was represented using a violin plot

References

    1. Adaikkan, C. , & Tsai, L.‐H. (2020). Gamma entrainment: Impact on neurocircuits, glia, and therapeutic opportunities. Trends in Neurosciences, 43(1), 24–41. 10.1016/j.tins.2019.11.001 - DOI - PubMed
    1. Alamia, A. , & VanRullen, R. (2019). Alpha oscillations and traveling waves: Signatures of predictive coding? PLoS Biology, 17(10), e3000487. 10.1371/journal.pbio.3000487 - DOI - PMC - PubMed
    1. Aydore, S. , Pantazis, D. , & Leahy, R. M. (2013). A note on the phase locking value and its properties. NeuroImage, 74, 231–244. 10.1016/j.neuroimage.2013.02.008 - DOI - PMC - PubMed
    1. Azzopardi, P. , & Cowey, A. (1998). Blindsight and visual awareness. Consciousness and Cognition, 7, 292–311. 10.1006/ccog.1998.0358 - DOI - PubMed
    1. Beck, A. , Steer, R. , & Brown, G. (Eds.). (1996). Manual for the Beck Depression Inventory‐II. Psychological Corporation.

Publication types