

The Impact of Suboptimal 25-Hydroxyvitamin D Levels and Cholecalciferol Replacement on the Pharmacokinetics of Oral Midazolam in Control Subjects and Patients With Chronic Kidney Disease
- PMID: 35678297
- PMCID: PMC12121630
- DOI: 10.1002/jcph.2104
The Impact of Suboptimal 25-Hydroxyvitamin D Levels and Cholecalciferol Replacement on the Pharmacokinetics of Oral Midazolam in Control Subjects and Patients With Chronic Kidney Disease
Abstract
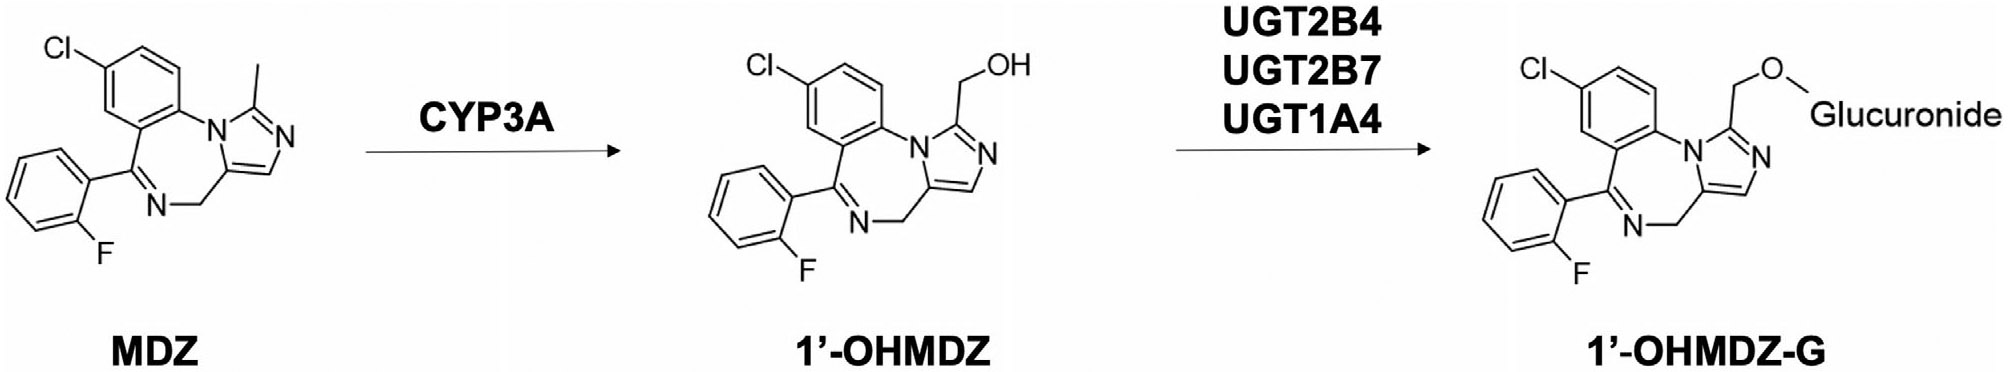
The aim of this study was to investigate the impact of suboptimal 25-hydroxyvitamin D (25-VitD) and cholecalciferol (VitD3 ) supplementation on the pharmacokinetics of oral midazolam (MDZ) in control subjects and subjects with chronic kidney disease (CKD). Subjects with CKD (n = 14) and controls (n = 5) with suboptimal 25-VitD levels (<30 ng/mL) were enrolled in a 2-phase study. In phase 1 (suboptimal), subjects were administered a single oral dose of VitD3 (5000 IU) and MDZ (2 mg). In phase 2 (replete) subjects who achieved 25-VitD repletion after receiving up to 16 weeks of daily cholecalciferol were given the identical single oral doses of VitD3 and MDZ as in phase 1. Concentrations of MDZ and metabolites, 1'-hydroxymidazolam (1'-OHMDZ), and 1'-OHMDZ glucuronide (1'-OHMDZ-G) were measured by liquid chromatography-tandem mass spectrometry and pharmacokinetic analysis was performed. Under suboptimal 25-VitD, reductions in MDZ clearance and renal clearance of 47% and 87%, respectively, and a 72% reduction in renal clearance of 1'-OHMDZ-G were observed in CKD vs controls. In phase 1 versus phase 2, MDZ clearance increased in all control subjects, with a median (interquartile range) increase of 10.5 (0.62-16.7) L/h. No changes in MDZ pharmacokinetics were observed in subjects with CKD between phases 1 and 2. The effects of 25-VitD repletion on MDZ disposition was largely observed in subjects without kidney disease. Impaired MDZ metabolism and/or excretion alterations due to CKD in a suboptimal 25-VitD state may not be reversed by cholecalciferol therapy. Suboptimal 25-VitD may augment the reductions in MDZ and 1'-OHMDZ-G clearance values observed in patients with CKD.
Keywords: CYP3A4; cholecalciferol; chronic kidney disease; metabolism; midazolam; pharmacokinetics; vitamin D.
© 2022, The American College of Clinical Pharmacology.
Conflict of interest statement
Conflicts of Interest
The authors have no conflicts of interest to declare.
Figures


References
-
- United States Renal Data System. 2021. USRDS annual data report. https://adr.usrds.org/2021. Accessed on May 1, 2022.
-
- Gonzalez EA, Sachdeva A, Oliver DA, Martin KJ. Vitamin D insufficiency and deficiency in chronic kidney disease. A single center observational study. Am J Nephrol. 2004;24(5):503–510. - PubMed
-
- Holick MF. Vitamin D deficiency. N Engl J Med. 2007;357(3):266–281. - PubMed
-
- Isakova T, Nickolas TL, Denburg M, et al. KDOQI US commentary on the 2017 KDIGO clinical practice guideline update for the diagnosis, evaluation, prevention, and treatment of chronic kidney disease–mineral and bone disorder (CKD-MBD). Am J Kidney Dis. 2017;70(6):737–751. - PubMed
Publication types
MeSH terms
Substances
Grants and funding
LinkOut - more resources
Full Text Sources
Medical
