. 2022 Sep;11(17):e2200031.
doi: 10.1002/adhm.202200031. Epub 2022 Jun 19.

Non-PCR Ultrasensitive Detection of Viral RNA by a Nanoprobe-Coupling Strategy: SARS-CoV-2 as an Example

Affiliations

Non-PCR Ultrasensitive Detection of Viral RNA by a Nanoprobe-Coupling Strategy: SARS-CoV-2 as an Example

Zhiguo Yu et al. Adv Healthc Mater. 2022 Sep.

Abstract

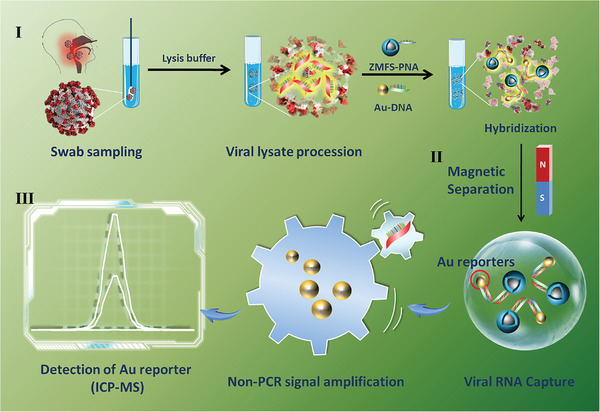
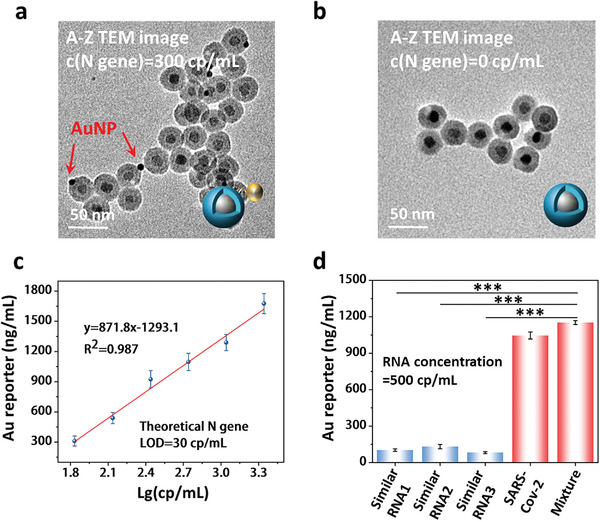
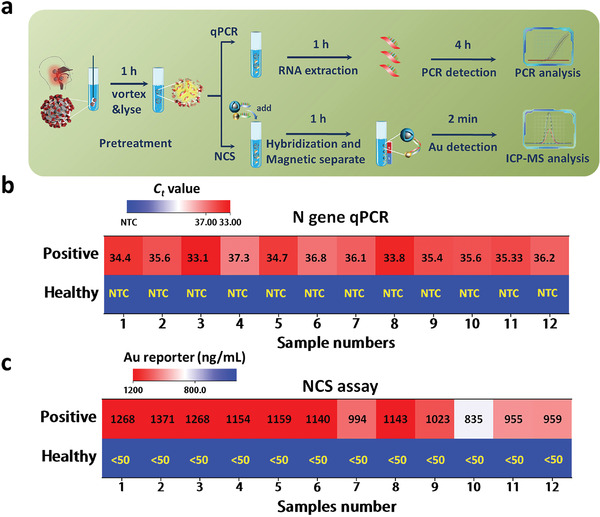
Developing efficient and highly sensitive diagnostic techniques for early detections of pathogenic viruses such as Severe Acute Respiratory Syndrome Coronavirus 2 (SARS-CoV-2) is vitally important for preventing its widespread. However, the conventional polymerase chain reaction (PCR)-based detection features high complexity, excessive time-consumption, and labor-intensiveness, while viral protein-based detections suffer from moderate sensitivity and specificity. Here, a non-PCR but ultrasensitive viral RNA detection strategy is reported based on a facile nanoprobe-coupling strategy without enzymatic amplification, wherein PCR-induced bias and other shortcomings are successfully circumvented. This approach endows the viral RNA detection with ultra-low background to maximum signal ratio in the linear signal amplification by using Au nanoparticles as reporters. The present strategy exhibits 100% specificity toward SARS-CoV-2 N gene, and ultrasensitive detection of as low as 52 cp mL-1 of SARS-CoV-2 N gene without pre-PCR amplification. This approach presents a novel ultrasensitive tool for viral RNA detections for fighting against COVID-19 and other types of pathogenic virus-caused diseases.

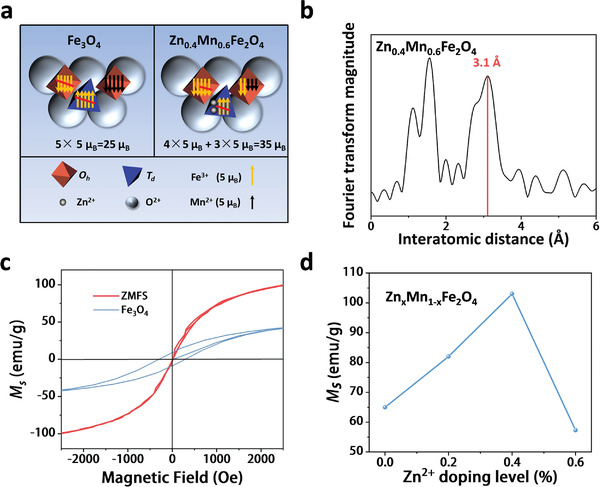
Keywords: SARS-CoV-2 N gene; Zn2+ doping; magnetic nanoparticles; nanoprobe-coupling strategy; nucleic acid quick detection.


Conflict of interest statement

The authors declare no conflict of interest.

Figures

Figure 1
Figure 1
Schematic diagram of nanoprobe‐coupling strategy (NCS) for SARS‐CoV‐2 detection. I) Samples are collected with a swab, then vortexed and split to prepare lysis solutions; II) ZnMnFe2O4@SiO2‐PNA (ZMFS‐PNA) and Au‐DNA hybridize with SARS‐CoV‐2 N gene resulting in nanoprobe coupling, and the coupled nanoprobes are collected by magnetic separation; III) NCS signal output amplified by using Au nanoparticles as reporters via ICP‐MS.
Figure 2
Figure 2
a) Undoped and Zn2+ doped (x = 0.4) magnetic spin alignment diagrams of Zn x Mn1− x Fe2O4. b) Zn K‐edge EXAFS spectra of Zn0.4Mn0.6Fe2O4 nanoparticles. c) Hysteresis curves of Zn0.4Mn0.6Fe2O4 and Fe3O4 nanoparticles. d) Plot of M s versus Zn2+ doping level of Zn x Mn1− x Fe2O4 nanoparticles.
Figure 3
Figure 3
a) TEM image of Zn0.4Mn0.6Fe2O4 (ZMF) nanoparticles. Inset, DLS size distribution of ZMF nanoparticles in hexamethylene. b) XRD patterns of ZMF (the red line) and Fe3O4 nanoparticles (the blue line). c) TEM image of Zn0.4Mn0.6Fe2O4@SiO2 (ZMFS) nanoparticles, scale bar: 50 nm. d) EDS elemental mapping images of ZMFS. e) TEM image of Au nanoparticles (AuNPs). f) UV–vis absorption spectra of AuNP (the black line) and AuNP‐DNA (the red line). The peak at 267 nm belongs to the absorption by DNA.
Figure 4
Figure 4
TEM images of A‐Z NPs after the hybridization reaction among the designed nanoprobes (A‐D and Z‐P) and the N gene, magnetic separation and re‐dispersion for a) 300 cp mL−1 of N gene, and b) 0 ng mL−1 of N gene, scale bar: 50 nm. c) Linear correlation between the concentrations of Au reporter (ng mL−1) measured by ICP‐MS, and that of SARS‐CoV‐2 N gene (cp mL−1), for serving as a standard curve. Theoretical limit of detection (LOD) of N gene is 30 cp mL−1. Three parallel samples were set up in each group, and every experiment was repeated for three times. d) NCS complimentary to SARS‐CoV‐2 was challenged with other three other types of different but similar‐sequenced RNA (500 cp mL−1, respectively), and a mixed sample containing both N gene and the three types of RNA at the same 500 cp mL−1 for each.
Figure 5
Figure 5
a) The assay procedures of qRT‐PCR and NCS. The time intervals above the arrows in (a) indicate the time‐consumptions of each step. b) The heat map of C t values in the blind tests via qRT‐PCR. NTC means no template control. c) The heat map of Au reporter concentration in the blind tests via NCS assay.

Similar articles

References

    1. Chan J. F. W., Yuan S. F., Kok K. H., To K. K. W., Chu H., Yang J., Xing F. F., Liu J. L., Yip C. C. Y., Poon R. W. S., Tsoi H. W., Lo S. K. F., Chan K. H., Poon V. K. M., Chan W. M., Ip J. D., Cai J. P., Cheng V. C. C., Chen H. L., Hui C. K. M., Yuen K. Y., Lancet 2020, 395, 514. - PMC - PubMed
    1. a) Li Z. T., Yi Y. X., Luo X. M., Xiong N., Liu Y., Li S. Q., Sun R. L., Wang Y. Q., Hu B. C., Chen W., Zhang Y. C., Wang J., Huang B. F., Lin Y., Yang J. S., Cai W. S., Wang X. F., Cheng J., Chen Z. Q., Sun K. J., Pan W. M., Zhan Z. F., Chen L. Y., Ye F., J. Med. Virol. 2020, 92, 1518; - PMC - PubMed
    2. b) Sun M., Liu S., Wei X., Wan S., Huang M., Song T., Lu Y., Weng X., Lin Z., Chen H., Song Y., Yang C., Angew. Chem., Int. Ed. 2021, 60, 10266. - PMC - PubMed
    1. a) Udugama B., Kadhiresan P., Kozlowski H. N., Malekjahani A., Osborne M., Li V. Y. C., Chen H. M., Mubareka S., Gubbay J. B., Chan W. C. W., ACS Nano 2020, 14, 3822; - PubMed
    2. b) Jiang X., Loeb J. C., Manzanas C., Lednicky J. A., Fan Z. H., Angew. Chem., Int. Ed. 2018, 57, 17211. - PubMed
    1. Xiong E., Jiang L., Tian T., Hu M., Yue H., Huang M., Lin W., Jiang Y., Zhu D., Zhou X., Angew. Chem., Int. Ed. 2021, 60, 5307. - PubMed
    1. Zainol Rashid Z., Othman S. N., Abdul Samat M. N., Ali U. K., Wong K. K., Malays. J. Pathol. 2020, 42, 13. - PubMed

Publication types