. 2022 Jun;57(6):e4869.
doi: 10.1002/jms.4869.

Normalization techniques for high-throughput screening by infrared matrix-assisted laser desorption electrospray ionization mass spectrometry

Affiliations

Normalization techniques for high-throughput screening by infrared matrix-assisted laser desorption electrospray ionization mass spectrometry

Kevan T Knizner et al. J Mass Spectrom. 2022 Jun.

Abstract

Mass spectrometry (MS) is an effective analytical tool for high-throughput screening (HTS) in the drug discovery field. Infrared matrix-assisted laser desorption electrospray ionization (IR-MALDESI) MS is a high-throughput platform that has achieved analysis times of sub-seconds-per-sample. Due to the high-throughput analysis speed, methods are needed to increase the analyte signal while decreasing the variability in IR-MALDESI-MS analyses to improve data quality and reduce false-positive hits. The Z-factor is used as a statistic of assay quality that can be improved by reducing the variation of target ion abundances or increasing signal. Herein we report optimal solvent compositions for increasing measured analyte abundances with direct analysis by IR-MALDESI-MS. We also evaluate normalization strategies, such as adding a normalization standard that is similar or dissimilar in structure to the model target drug, to reduce the variability of measured analyte abundances with direct analyses by IR-MALDESI-MS in both positive and negative ionization modes.

Keywords: IR-MALDESI; Orbitrap mass spectrometer; high-throughput screening; normalization.


Conflict of interest statement

The authors declare no competing financial interests.

Figures

FIGURE 1
FIGURE 1
Measured abundances of caffeine (blue circles) and the sum‐of‐lipids (orange circles) within Splashmix over varying solvent compositions of (A) MeOH and (B) ACN. The average of the caffeine and sum‐of‐lipid abundances is represented by a black circle. Regions shaded in green represent the optimal solvent compositions. Regions shaded in blue represent a sample composition for a relatively greater amount of organic solvent. The orange region represents the solvent composition from which the sum of the lipid abundances is significantly higher compared to other compositions
FIGURE 2
FIGURE 2
(A) Chronograms of the TIC and each analyte of interest. The 100‐μM sorbic acid, benzoic acid, GSH, and hGSH were sampled out of 100‐μl wells. The 1‐μM SIL‐GSH was infused in the electrospray to monitor the electrospray variability during the analysis. The popout boxes show similarities in the chronograms from species sampled from the well plates and show the relative stability of the electrospray ionization (ESI) solution shown by the orthogonality of the SIL‐GSH chronogram. (B) The structure of each molecule of interest. hGSH was used as a similar normalization standard to GSH while sorbic acid and benzoic acid were used as dissimilar normalization standards for GSH. The asterisks (*) represent either 15N or 13C based on the atom it indicates
FIGURE 3
FIGURE 3
Abundances of (A) GSH (m/z 306.0765), and (B) benzoic acid (m/z 121.0295) measured over 100 scans. Abundances of (C) GSH normalized to hGSH (m/z 320.0922), and (D) benzoic acid normalized to sorbic acid (m/z 111.0452). The black line indicates the average unnormalized abundance or normalized abundance for each species over 100 scans. The corresponding %RSD and its decrease are displayed above each plot (n = 100)
FIGURE 4
FIGURE 4
The abundances of (A) GSH (m/z 306.0765) measured over 100 scans are shown. The abundances of GSH normalized to (B) sorbic acid (m/z 121.0295), (C) benzoic acid (m/z 121.0295), and the (D) total ion current (TIC) are also shown. The abundances of the SIL‐GSH (m/z 309.0803) were subtracted from the TIC abundances before normalization. The black line indicates the average normalized abundance for each specie over 100 scans the corresponding percent relative standard deviation (%RSD) and the %RSD decrease is displayed above each respective plot (n = 100)
FIGURE 5
FIGURE 5
(A) Chronograms of the total ion current (TIC) and each analyte of interest. The 100 μM of riboflavin, caffeine, and theophylline were sampled out of 100‐μl well plates. The 1‐μM SIL‐caffeine was added to the electrospray solvent to monitor the stability. The popout boxes show similarities in the chronograms from species sampled from the well plates and to show the relative stability of the electrospray ionization (ESI) shown by the orthogonality of the SIL‐caffeine chronogram. (B) The structure of each molecule of interest. Theophylline was used as a similar normalization standard to caffeine and riboflavin was used as a dissimilar normalization standard. The asterisks (*) represent 13C in SIL‐caffeine
FIGURE 6
FIGURE 6
(A) Caffeine (m/z 195.0877) abundances measured over 100 scans. Caffeine abundances normalized to (B) theophylline (m/z 181.0720), (C) riboflavin (m/z 377.1456), and the (D) total ion current (TIC). The abundances of SIL‐caffeine (m/z 198.0977) were subtracted from the TIC abundances before normalization. The black line indicates the average unnormalized abundance or normalized abundance for each analysis over 100 scans. The corresponding %RSD and its decrease are displayed above each respective plot (n = 100)
FIGURE 7
FIGURE 7
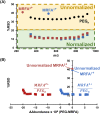
(A) The unnormalized %RSD (circles) of each PEG oligomer (black) with the unnormalied %RSD of MRFA singly (blue) and doubly (red) charge state ions  (n = 100). The %RSD of the singly (blue square) and doubly (red square) charged MRFA ion abundances normalized to each PEG oligomer abundance (MRFAPEGn). (B) The %RSD for singly and doubly charged MRFA ion normalized to each PEG oligomer plotted against the difference in abundance between PEGn abundance and MRFA abundance. The unnormalized %RSD of each MRFA charge state ion is shown as a circle at ΔAbundance = 0

Similar articles

Cited by

References

    1. Hughes JP, Rees S, Kalindjian SB, Philpott KL. Principles of Early Drug Discovery. Br J Pharmacol. 2011;162(6):1239‐1249. doi:10.1111/j.1476-5381.2010.01127.x - DOI - PMC - PubMed
    1. Bretschneider T, Ozbal C, Holstein M, et al. RapidFire BLAZE‐Mode Is Boosting ESI‐MS Toward High‐Throughput‐Screening. SLAS Technol. 2019;24(4):386‐393. doi:10.1177/2472630318822449 - DOI - PubMed
    1. Roddy TP, Horvath CR, Stout SJ, et al. Mass Spectrometric Techniques for Label‐Free High‐Throughput Screening in Drug Discovery. Anal Chem. 2007;79(21):8207‐8213. doi:10.1021/ac062421q - DOI - PubMed
    1. Rohman M, Wingfield J. High‐Throughput Screening Using Mass Spectrometry within Drug Discovery. Methods Mol Biol. 2016;1439:47‐63. doi:10.1007/978-1-4939-3673-1_3 - DOI - PubMed
    1. Haslam C, Hellicar J, Dunn A, et al. The Evolution of MALDI‐TOF Mass Spectrometry toward Ultra‐High‐Throughput Screening: 1536‐Well Format and Beyond. J Biomol Screen. 2016;21(2):176‐186. doi:10.1177/1087057115608605 - DOI - PubMed

MeSH terms

LinkOut - more resources