. 2022 Jun 9:11:e78168.
doi: 10.7554/eLife.78168.

Towards a unified model of naive T cell dynamics across the lifespan

Affiliations

Towards a unified model of naive T cell dynamics across the lifespan

Sanket Rane et al. Elife. .

Abstract

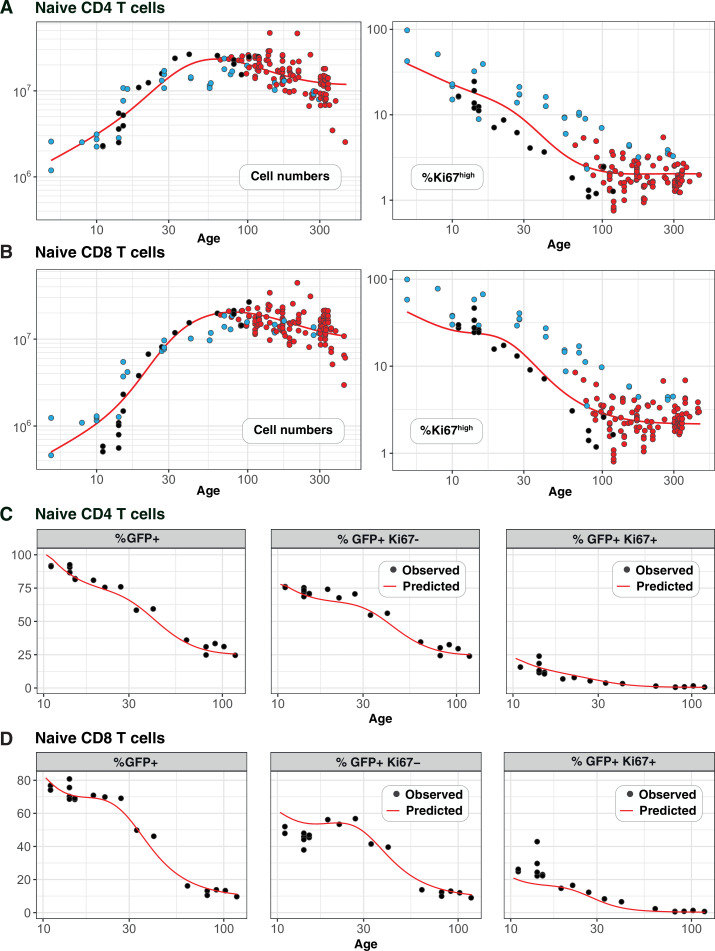
Naive CD4 and CD8 T cells are cornerstones of adaptive immunity, but the dynamics of their establishment early in life and how their kinetics change as they mature following release from the thymus are poorly understood. Further, due to the diverse signals implicated in naive T cell survival, it has been a long-held and conceptually attractive view that they are sustained by active homeostatic control as thymic activity wanes. Here we use multiple modelling and experimental approaches to identify a unified model of naive CD4 and CD8 T cell population dynamics in mice, across their lifespan. We infer that both subsets divide rarely, and progressively increase their survival capacity with cell age. Strikingly, this simple model is able to describe naive CD4 T cell dynamics throughout life. In contrast, we find that newly generated naive CD8 T cells are lost more rapidly during the first 3-4 weeks of life, likely due to increased recruitment into memory. We find no evidence for elevated division rates in neonates, or for feedback regulation of naive T cell numbers at any age. We show how confronting mathematical models with diverse datasets can reveal a quantitative and remarkably simple picture of naive T cell dynamics in mice from birth into old age.

Keywords: computational biology; immunology; inflammation; mathematical modeling; mouse; naive T cells; population dynamics; systems biology.


Conflict of interest statement

SR, TH, EL, BS, AY No competing interests declared

Figures

Figure 1.
Figure 1.. Modeling naive T cell dynamics using busulfan chimeric mice.
(A) Schematic description of the busulfan chimera system, in which congenically labelled donor lymphocytes percolate into peripheral compartments following partial ablation of haematopoietic stem cells and bone marrow transplant (BMT). (B) Candidate models of naive T cell dynamics. In all models, we assume Ki67- and Ki67+ cells are exported from the thymus at rates proportional to the numbers of Ki67- and Ki67+ single positive (SP) thymocytes, respectively. We considered three classes of model; (1) Homogeneous, in which all cells are lost at the same rate and divide at the same rate. In the simplest ‘neutral’ case these rates are constant. We also considered extensions in which loss or division rates were allowed to vary with total cell numbers (density-dependent models). (2) Recent thymic emigrants (RTE) and mature naive (MN) T cells exhibit distinct kinetics, with a constant rate of maturation μ. (3) Loss or division rates vary with post-thymic cell age, a. Here we explicitly model the time-evolution of the population density of cells of post-thymic age a with Ki67 expression k at mouse age t, u(a,k,t). Mathematical details of all models are given in Appendix 1.
Figure 1—figure supplement 1.
Figure 1—figure supplement 1.. Gating strategies for thymocyte and peripheral naive T cell subsets.
Figure 2.
Figure 2.. Modelling naive CD4 and CD8 T cell dynamics in adult busulfan chimeric mice.
(A) The best fitting, age-dependent loss model of naive CD4 T cell dynamics describes the timecourses of their total numbers, chimerism and Ki67 expression in mice (n= 111) who underwent busulfan treatment and BMT in three different age groups (indicated within grey bars). (B) Fits to naive CD8 T cell dynamics (n= 116) yielded by the age-dependent division model (dashed lines) and the age-dependent loss model (solid lines). Envelopes indicate the 95% credible interval on the mean of the model prediction, generated by sampling from the posterior distributions of model parameters. For clarity, these envelopes are omitted in panel B, to allow visual comparison of the two models.
Figure 2—figure supplement 1.
Figure 2—figure supplement 1.. Fits of alternative models to the data from busulfan chimeric mice.
Figure 2—figure supplement 2.
Figure 2—figure supplement 2.. Posterior distributions of key parameters.
(A) CD4 and (B) CD8 T cells derived from fitting the age-dependent loss model to the data from adult busulfan chimeric mice.
Figure 3.
Figure 3.. Distinct survival kinetics of RTE and mature naive T cells favour models with strong cell-age effects.
We simulated the co-transfer experiment described by Houston et al., 2011 in which RTE from 5- to 9-week-old RagGFP reporter mice were co-transferred with equal numbers of mature naive (MN) T cells from mice aged 14 weeks or greater to congenic recipients. Red points represent their observed RTE:MN ratios. We then used the models fitted to the data from busulfan chimeric mice (Figure 2) to predict the outcome of this co-transfer experiment, with the age-dependent division model shown in orange, and the age-dependent loss model in blue. The pale blue envelopes show the median and 2.5% and 97.5% quantiles of the RTE:MN ratio predicted by the models, obtained by sampling from the posterior distribution of parameters. This envelope was too narrow to be shown for the age-dependent division models (orange lines).
Figure 4.
Figure 4.. Predicting the kinetics of establishment of naive CD4 and CD8 T cell pools in early life.
Panels A and B: For naive CD4 and CD8 cells, we extrapolated the age-dependent loss models (red curves) that were fitted to data from adult busulfan chimeric mice (red points) back to age 1 day. We compared these predicted trajectories with independent observations of naive T cell numbers and Ki67 expression in wild-type mice aged between 5–300 days (n=34 mice, blue points), and from RagGFPKi67RFP reporter mice (n=19 mice, black points). Panels C and D: We then estimated one additional parameter – the expected duration of GFP expression – by fitting the age-dependent loss model to the timecourses of total numbers of naive CD4 and CD8 GFP+ cells in these reporter mice (leftmost panels). We could then predict the timecourses of the percentages of GFP+Ki67+ and GFP+Ki67 cells (centre and right panels).
Figure 5.
Figure 5.. Tracking the persistence of cohorts of naive CD8 T cells in vivo – an analysis of data from Reynaldi et al., 2019.
(A) Fitting the age-dependent loss model to the estimated numbers of time-stamped naive CD8 T cells in CD4-CreERT2 reporter mice (n=66) treated with tamoxifen at different ages and sampled longitudinally. We used a hierarchical modelling framework and show mouse-specific fits to these timecourses (colours indicate different animals, dots are observations and lines are model fits). In the best fitting model, estimates of initial cell numbers were mouse-specific, while the net loss rate of RTE of age 0 (λ0=λ(a=0)) was specific to each mouse age group. (B) Corresponding estimates of λ0 for each age group of mice (black horizontal bars), with mouse-specific estimates (grey points) and the fitted, empirical description of λ0 with mouse age (see Appendix 7, Equation 42). (C) Predicting the kinetics of the percentages of GFP+ Ki67 and GFP+ Ki67+ CD8 T cells using the age-dependent loss model, including neonatal age effects in either the loss rate (green dashed line) or in the division rate (blue dashed line). The red line (partly concealed by the blue dashed line) shows the predictions of the original model fitted to the adult busulfan chimeric mice, with no mouse age effects.
Figure 6.
Figure 6.. Markers of proliferation among naive T cells derived from very recent thymic emigrants.
(A) Flow cytometry analyses of late stage single positive thymocytes and naive CD4 and CD8 T cells from lymph nodes in a 41-day-old RagGFP Ki67RFP reporter mouse, showing that Ki67 expression among naive T cells is largely restricted to GFP+ RTE. In the ‘overlaid’ panels, naive T cells are shown in red and mature SP thymocytes in black. (B) Data from a cohort of wild-type mice showing that Ki67 levels in SP thymocytes and peripheral naive T cells correlate throughout life (Spearman’s rank correlation coefficient; ρ= 0.90 (CD4), 0.94 (CD8); both p<10-15).
Appendix 1—figure 1.
Appendix 1—figure 1.. Characteristic curves for (A) the population of age a0 present at t=t0 and (B) the population who divided at time T when they were of age a0.
Appendix 2—figure 1.
Appendix 2—figure 1.. Empirical descriptions of the dynamics of the numbers and Ki67 expression of late-stage thymocytes.
These curves (defined above) were used as inputs to models of the data from adult busulfan chimeric mice.
Appendix 8—figure 1.
Appendix 8—figure 1.. Simulating the outcome of transplanting 6 additional thymi, as described by Berzins et al., 1999.
The change in numbers of naive CD4 and CD8 T cells is equivalent to 3 weeks of thymic output.

Comment in

  • doi: 10.7554/eLife.81077

References

    1. Adkins B. T-cell function in newborn mice and humans. Immunology Today. 1999;20:330–335. doi: 10.1016/s0167-5699(99)01473-5. - DOI - PubMed
    1. Akaike H. On the likelihood of a time series model. The Statistician. 1978;27:217. doi: 10.2307/2988185. - DOI
    1. Akue AD, Lee JY, Jameson SC. Derivation and maintenance of virtual memory CD8 T cells. Journal of Immunology. 2012;188:2516–2523. doi: 10.4049/jimmunol.1102213. - DOI - PMC - PubMed
    1. Almeida AR, Borghans JA, Freitas AA. T cell homeostasis: thymus regeneration and peripheral T cell restoration in mice with a reduced fraction of competent precursors. The Journal of Experimental Medicine. 2001;194:591–599. doi: 10.1084/jem.194.5.591. - DOI - PMC - PubMed
    1. Baliu-Piqué M, van Hoeven V, Drylewicz J, van der Wagen LE, Janssen A, Otto SA, van Zelm MC, de Boer RJ, Kuball J, Borghans JA, Tesselaar K. Cell-density independent increased lymphocyte production and loss rates post-autologous HSCT. eLife. 2021;10:e59775. doi: 10.7554/eLife.59775. - DOI - PMC - PubMed

Publication types