

Cyprinid-specific duplicated membrane TLR5 senses dsRNA as functional homodimeric receptors
- PMID: 35678424
- PMCID: PMC9346489
- DOI: 10.15252/embr.202154281
Cyprinid-specific duplicated membrane TLR5 senses dsRNA as functional homodimeric receptors
Abstract
Membrane-embedded Toll-like receptor 5 (TLR5) functions as a homodimer to detect bacterial flagellin. Cyprinid grass carp (Ctenopharyngodon idella) encodes two TLR5 genes, CiTLR5a and CiTLR5b. Here, we show that cyprinid TLR5a and TLR5b homodimers unexpectedly bind the dsRNA analog poly(I:C) and regulate interferon (IFN) response in early endosomes and lysosomes. Although TLR5 homodimers also bind flagellin, an immune response to flagellin is only triggered by TLR5a/b heterodimer. Moreover, we demonstrate that two TLR5 paralogs have opposite effects on antiviral response: CiTLR5a slightly promotes and powerfully maintains, whereas CiTLR5b remarkably inhibits virus replication. We show that the ectodomain of CiTLR5 is required for dsRNA-induced IFN signaling, and we map the key poly(I:C) binding sites to G240 for CiTLR5a and to N547 for CiTLR5b. Furthermore, we reveal that differential N-glycosylation of CiTLR5a/b affects dsRNA-IFN signaling but has no role in flagellin-mediated NF-κB induction, with paralog-specific roles for CiTLR5a-T101 and corresponding CiTLR5b-I99. Moreover, we provide evidence that the ability to sense dsRNA represents a neofunctionalization specific for membrane-bound TLR5 in cyprinid, bridging viral and bacterial immune responses.
Keywords: N-glycosylation modification; TLR5; dsRNA; hetero- and homodimer; interferon.
© 2022 The Authors.
Figures

- A–C
CFM on FHM cells transfected with CiTLR5a‐GFP and CiTLR5b‐RFP (A), CiTLR5a‐GFP and CiTLR5a‐RFP (B), or CiTLR5b‐GFP and CiTLR5b‐RFP (C). Green, red, blue, and yellow indicate CiTLR5a, CiTLR5b, nucleus, and co‐localization, respectively (scale bars: 10 μm).
- D, E
mRNA and protein expression of CiTLR5a‐HA (D), CiTLR5b‐HA (D), CiTLR5a‐GFP (E), and CiTLR5b‐GFP (E) plasmids in CIK cells were examined by qRT–PCR (upper panel) with EF1α gene as an internal control and by immunoblotting (IB) (lower panel) with β‐tubulin as a reference (n = 4).
- F–H
FHM cells in 10 cm2 dishes were transfected with the indicated plasmids for 24 h. Co‐IP was performed with anti‐HA monoclonal antibody. Mouse IgG was used as control. Immunoblotting was performed with anti‐HA and anti‐GFP antibodies, respectively.

- A
mRNA expression of CiTLR5a and CiTLR5b in CIK cells was examined by qRT–PCR (n = 4). EF1α gene was employed as an internal control.
- B–D
Specific siRNAs of PpTLR5a/5b and negative control siRNA (si.C) were transfected into FHM cells and CIK cells for 12 h, respectively. The cells were analyzed by qRT–PCR to quantify the expression of PpTLR5a/5b (C), CiTLR5a (D), and CiTLR5b (E) (n = 4).
- E, F
FHM cells were transfected with s1, indicated plasmids for 12 h, and then stimulated with poly(I:C) (F) or FlaC (G) for 24 h. IFN1 (F) and NF‐κB2 (G) promoter activities were determined by DLR assay (n = 3).
- G, H
FHM cells were transfected with s2, indicated plasmids for 12 h, and then stimulated with poly(I:C) (H) or FlaC (I) for 24 h. IFN1 (H) and NF‐κB2 (I) promoter activities were examined by DLR assay (n = 3).
- I
CIK cells were transfected with the indicated combinations (Vector (2 μg), CiTLR5a (2 μg), CiTLR5b (2 μg), CiTLR5a (1 μg) + CiTLR5b (2 μg), CiTLR5a (2 μg) + CiTLR5b (2 μg), CiTLR5a (4 μg) + CiTLR5b (2 μg)) for 24 h, Samples were then stimulated with poly(I:C) (1 μg/ml) for 24 h. PBS was employed as a control. The samples were collected and RNA‐seq was carried out. A heatmap of mRNA expression of enriched antiviral immune genes (IFN1, IFN3, TBK1, Vig1, Gig1, Mx1, Mx2, ISG15, ISG56, and IL22) was made based on RNA sequencing.
- J
The samples prepared as the RNA‐seq were employed to verify mRNA expression of antiviral immune genes by qRT–PCR (n = 4). EF1α gene was used as an internal control.

- A
CIK cells were seeded in 12‐well plates for 24 h, stimulated with PBS (control), LPS, PGN, dsDNA, K. pneumonia lysate, poly(I:C), FlaA, FlaB, FlaC, A. hydrophila lysate, or GCRV for different time points (0, 3, 6, 12, 24, 48 h), and then mRNA expression of CiTLR5a and CiTLR5b was measured by qRT–PCR (n = 4).
- B, C
Effects of MAMPs and bacteria on NF‐κB2 (B) and IFN1 (C) promoter activities were measured by DLR assays in FHM cells. PBS serves as a control (n = 3).
- D
mRNA expression in 12 tissues, based on qRT–PCR analysis (n = 4). 18S rRNA gene was employed as an internal control.
- E
mRNA expression of CiTLR5a and CiTLR5b was examined by qRT–PCR in grass carp spleen and head kidney tissues at different time points post FlaC, A. hydrophila, poly(I:C), or GCRV challenge (n = 6).
- F–H
MAMPs (FlaA, FlaB, FlaC, dsDNA, poly(I:C), PGN, LPS, and negative control) were coated to 96‐well plates and then blocked with bovine serum albumin. The binding abilities between CiTLR5a‐ectodomain (E), CiTLR5b‐ectodomain (F), GST (G) and different MAMPs were assessed by ELISA (n = 4).
- I–L
Lysates of FHM cells overexpressing CiTLR5a and CiTLR5b were respectively incubated with FlaA, FlaB, FlaC, biotin‐poly(I:C), and biotin‐ssRNA (1 μg/ml) at pH 5.0 or pH 7.4 for 1 h at 4°C, mixed with HA Ab‐coupled beads or streptavidin agarose beads for 2 h at 4°C, and then analyzed by immunoblotting (IB) with anti‐HA or anti‐His antibodies.
- M
Amino acid sequence alignment of the EJM and putative transmembrane regions of CiTLR5a, CiTLR5b, DrTLR5a, DrTLR5b, and HsTLR5. The acidic amino acid residues in the EJM were highlighted in red. The transmembrane sequences were marked by shadow.
- N, O
CiUNC93B1‐Myc and CiTLR5a‐HA (M) or CiTLR5b‐HA (N) was transfected into FHM cells. Co‐IP and immunoblotting were conducted to test the interactions between CiUNC93B1‐Myc and CiTLR5a‐HA or CiTLR5b‐HA.
- P, Q
Effects of CiUNC93B1 on CiTLR5a‐ and CiTLR5b‐mediated IFN1 (O) and NF‐κB2 (P) promoter activities were examined in FHM cells by DLR assays (n = 3). Both poly(I:C) and FlaC are 1 μg/ml.
- R, S
FHM cells were transfected with CiTLR5a‐GFP (Q) or CiTLR5b‐GFP (R) and RAB5‐RFP, an early endosomes protein marker, RAB7‐RFP, a late endosome protein marker, or LAMP2‐RFP, a lysosome protein marker, seeded on microscope cover glasses in 12‐well plates for 24 h, and then fixed and examined by CFM. Green represents CiTLR5a‐GFP or CiTLR5b‐GFP, red represents RAB5‐RFP, RAB7‐RFP, or LAMP2‐RFP, and blue indicates nucleus. Yellow represents co‐localization between CiTLR5a or CiTLR5b and early endosomes or lysosomes (scale bars: 10 μm).
- T, U
Effects of chloroquine (in 5 μg/ml) on CiTLR5a‐ and CiTLR5b‐dependent signaling were examined by DLR assays in FHM cells (n = 3). HsTLR5 and CiMDA5 (C. idella MDA5) were employed as positive controls.


- A, B
Specific siRNAs of CiTLR5a and CiTLR5b along with negative control si.C were transfected into CIK cells for 12 h, respectively. The cells were harvested for qRT–PCR to quantify the expression levels of CiTLR5a (A) and CiTLR5b (B) (n = 4).

- A
Effects of the indicated constructs on IFN1 and IFN3 promoter activities after GCRV challenge were measured by DLR assays in CIK cells (n = 3).
- B
Standard plaque assays in CIK cells with indicated overexpressing constructs or siRNAs and different dilution of GCRV.
- C, D
Relative plaque intensity ratios of (B) were analyzed by ImageJ (n = 3).
- E, F
CIK cells overexpressing (E) or interfering (F) were infected with GCRV at an MOI = 0.1, and supernatants were collected at 48 h for viral titer assays by TCID50 (n = 3).
- G, H
CIK cells were treated with the supernatants for titer assays for 24 h, and mRNA expression of GCRV VP4, VP5, VP6, VP7, and NS38 genes was quantified by qRT–PCR (n = 4).
- I, J
Antiviral activities (cell viability) of the indicated constructs or siRNAs were measured by MTT assays in CIK cells at deferent time points post GCRV challenge (n = 4).
- K, L
mRNA expression of the antiviral regulator and effector molecules IFN1, Mx2, Gig1, and IL‐22 were quantified by qRT–PCR in overexpressing (K) or interfering (L) CIK cells post GCRV challenge (n = 4).
- M, N
mRNA expression of IFN1, IFN3, NF‐κB1, and NF‐κB2 in spleen tissue was investigated by qRT–PCR after RNAi in vivo for 24 h, and A. hydrophila or GCRV challenge for 24 h (n = 6).
- O, P
Protein expression of IFN1 (O) and NF‐κB1 (P) in spleen tissue was investigated by immunoblotting (IB) after RNAi in vivo for 24 h, and A. hydrophila or GCRV challenge for 24 h (n = 3).
- Q
Viral titers in spleen homogenates were examined with gene knockdown in vivo for 24 h and GCRV challenge for 24 h in CIK cells (n = 6).

- A
Schematic representations of wild type (WT) and chimeric CiTLR5a and CiTLR5b constructs. ECD indicates ectodomain, TM represents the transmembrane region, and ICD stands for intracellular domain.
- B, C
FHM cells were transfected with the indicated combination receptors for 24 h, stimulated with poly(I:C) (B) or FlaC (C) for 24 h. IFN1 (B) and NF‐κB2 (C) promoter activities were examined by DLR assays (n = 3).

- A
Comparison of the structures and relevant sequence regions in CiTLR5a and CiTLR5b with counterparts in DrTLR5a and DrTLR5b. The two representative conserved amino acids in flagellin‐binding regions for the following studies were denoted with triangles. Identical amino acid residues were shown by asterisks (*), and high and low similarities were indicated with colons (:) and points (.), respectively.
- B, C
Effects of the two selected flagellin‐binding sites on NF‐κB2 promoter activity were investigated by site‐directed mutagenesis and DLR assays in FHM cells (n = 3).
- D, E
Lysates of FHM cells overexpressing mutants were incubated with FlaC for pull‐down assays and analyzed by immunoblotting (IB). Vector and wild type (WT) were used as controls. The images of (D) and (E) were one of the three independent biological experiments in Fig EV4A and B. Relative band intensity ratios were analyzed by ImageJ (n = 3).
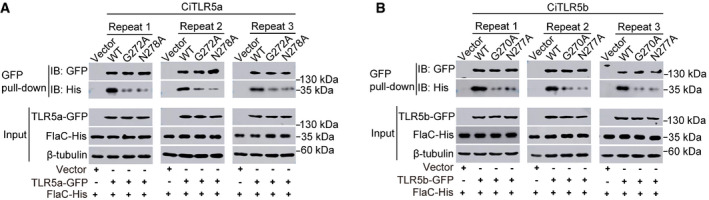
- A, B
Lysates of FHM cells transfected with mutants of CiTLR5a (A) and CiTLR5b (B) were incubated with FlaC and analyzed by immunoblotting (IB). Vector and wild type (WT) were used as controls. Images were from three independent experiments. The images of Fig 5D and E were one of the three independent biological experiments in (A) and (B).

- A
SWISS‐MODEL, AutoDock Vina, and PyMOL software were employed to predict and show the interaction patches and sites of CiTLR5a or CiTLR5b with poly(I:C).
- B
Schematic motif representations of CiTLR5a, CiTLR5b, and their region deletants.
- C
FHM cells were transfected with the indicated constructs; IFN1 promoter activity was detected by DLR assays (n = 3).
- D
Lysates of FHM cells overexpressing CiTLR5a and CiTLR5b (including region deletants) were incubated with biotin‐poly(I:C). Vector was used as a control. Pull down and immunoblotting (IB) were performed.
- E
FHM cells were transfected with the indicated constructs; NF‐κB2 promoter activity was detected by DLR assays (n = 3).
- F, G
FHM cells were transfected with site mutants of CiTLR5a and CiTLR5b and then stimulated with poly(I:C) or FlaC. Vector and wild type (WT) were used as controls. G272A and G270A for key flagellin‐binding sites in CiTLR5a and CiTLR5b were employed as specificity controls. IFN1 (F) and NF‐κB2 (G) promoter activities were examined by DLR assays (n = 3).
- H–K
Lysates of FHM cells overexpressing CiTLR5a and CiTLR5b site mutants were incubated with biotin‐poly(I:C). Vector and wild type were used as controls. Pull down and immunoblotting were carried out (H, J). The images of (H) and (J) were one of the three independent biological experiments in Fig EV5A and B. (I, K) Relative band intensity ratios of (H) and (J) were analyzed by ImageJ, respectively (n = 3).

- A, B
Lysates of FHM cells transfected with mutants of CiTLR5a and CiTLR5b were incubated with biotin‐poly(I:C) and analyzed by immunoblotting (IB). Vector and wild type (WT) were used as controls. Images were from three independent experiments. The images of Fig 6H and J were one of the three independent biological experiments in (A) and (B).

- A
Ribbon diagrams of the structure models of CiTLR5a and CiTLR5b ectodomains. The predicted N‐glycosylation sites were labeled. The conserved Asn (N) residues between CiTLR5a and CiTLR5b are shown in pink, the specific Asn residues in CiTLR5a and CiTLR5b are shown in blue and orange, respectively.
- B
Comparison of predicted N‐glycosylation sites between CiTLR5a and CiTLR5b. The conserved Asn residues were marked by triangles. The differentiated residues were denoted with gray background. “‐” represents non‐N‐glycosylation site in the corresponding sequence.
- C
Lysates of FHM cells overexpressing CiTLR5a or CiTLR5b were, respectively, treated with Endo H and analyzed by immunoblotting (IB) with anti‐HA antibody.
- D, E
Effects of tunicamycin (5 μg/ml) on CiTLR5a‐ and CiTLR5b‐mediated NF‐κB2 (D) and IFN1 (E) signaling were investigated by DLR assays in FHM cells (n = 3). HsTLR5 and CiMDA5 were employed as positive controls, respectively.
- F
Mutants with the predicted N‐glycosylation sites were transfected into FHM cells and examined via immunoblotting to show the change of molecular weight.
- G, H
FHM cells were, respectively, transfected with mutants and the indicated receptor combinations and then stimulated with poly(I:C) or FlaC. Vector and wild type (WT) were used as controls. IFN1 (G) and NF‐κB2 (H) promoter activities were examined by DLR assays (n = 3).
- I–L
Lysates of FHM cells overexpressing CiTLR5a or CiTLR5b mutants were, respectively, incubated with biotin‐poly(I:C) (I) or FlaC (K). Vector and wild type were used as controls. Pull‐down and immunoblotting assays were conducted (I, K). The images of (I) and (K) were one of the three independent biological experiments in Appendix Fig S4A and B. (J, L) Relative band intensity ratios of (I) and (K) were analyzed by ImageJ (n = 3).

- A–E
Lysates of FHM cells overexpressing LoTLR5 (A), DrTLR5a (B), DrTLR5b (B), IpTLR5‐1 (C), IpTLR5‐2 (C), IpTLR5S (C), OmTLR5M (D), OmTLR5S (D), and HsTLR5 (E) were, respectively, incubated with FlaC‐His (1 μg/ml) at pH 5.0 or pH 7.4. Complexes were pulled down by anti‐GFP antibody coupling beads and analyzed by immunoblotting (IB) with anti‐His antibody.
- F–J
Lysates of FHM cells overexpressing LoTLR5 (F), DrTLR5a (G), DrTLR5b (G), IpTLR5‐1 (H), IpTLR5‐2 (H), IpTLR5S (H), OmTLR5M (I), OmTLR5S (I), and HsTLR5 (J) were, respectively, incubated with biotin‐poly(I:C) (1 μg/ml) at pH 5.0 or pH 7.4. Complexes were pulled down by streptavidin beads and analyzed via immunoblotting with anti‐GFP antibody.
- K–M
Effects of DrTLR5a and DrTLR5b constructs on IFN1 (K), IFN3 (L), and NF‐κB2 (M) promoter activities were measured by DLR assays in FHM cells (n = 3).
- N, O
Lysates of FHM cells overexpressing DrTLR5a and DrTLR5b mutants were incubated with biotin‐poly(I:C) and analyzed by immunoblotting (N), and relative band intensity ratios were analyzed by ImageJ (O) (n = 3). Vector and wild type (WT) were used as controls. The images of (N) were one of the three independent biological experiments in Appendix Fig S6A and B.
- P
Summarized models of TLR5‐ligand interaction and immune responses. Upper panel: The solid lines represent that ligand can be recognized by the corresponding types of TLR5, and the dotted lines represent that ligand cannot bind to the corresponding types of TLR5. Lower panel: The arrows indicate that different combinations of duplicated membrane TLR5 promote signal transduction after stimulation by the corresponding ligand; the dotted lines indicate that different combinations bind the corresponding ligand (flagellin) but do not transmit signals. The “⊥” symbol indicates that different combinations slightly suppress signal transduction after stimulation by poly(I:C).
- Q
Representative TLR5 protein sequences were employed to construct the phylogenetic tree by neighbor‐joining method within the MEGA11 program. The tree was bootstrapped 10,000 times.
- R
Summarized model of TLR5 evolution in vertebrates.
Similar articles
-
Isolation and expression of grass carp toll-like receptor 5a (CiTLR5a) and 5b (CiTLR5b) gene involved in the response to flagellin stimulation and grass carp reovirus infection.Fish Shellfish Immunol. 2015 May;44(1):88-99. doi: 10.1016/j.fsi.2015.01.024. Epub 2015 Feb 7. Fish Shellfish Immunol. 2015. PMID: 25665802
-
Characterization analysis of TLR5a and TLR5b immune response after different bacterial infection in grass carp (Ctenopharyngodon idella).Fish Shellfish Immunol. 2023 May;136:108716. doi: 10.1016/j.fsi.2023.108716. Epub 2023 Mar 30. Fish Shellfish Immunol. 2023. PMID: 37001745
-
Duplicated TLR5 of zebrafish functions as a heterodimeric receptor.Proc Natl Acad Sci U S A. 2018 Apr 3;115(14):E3221-E3229. doi: 10.1073/pnas.1719245115. Epub 2018 Mar 19. Proc Natl Acad Sci U S A. 2018. PMID: 29555749 Free PMC article.
-
Functional characterization of chicken TLR5 reveals species-specific recognition of flagellin.Mol Immunol. 2008 Mar;45(5):1298-307. doi: 10.1016/j.molimm.2007.09.013. Epub 2007 Oct 26. Mol Immunol. 2008. PMID: 17964652
-
AsialoGM1 and TLR5 cooperate in flagellin-induced nucleotide signaling to activate Erk1/2.Am J Respir Cell Mol Biol. 2006 Jun;34(6):653-60. doi: 10.1165/rcmb.2005-0441OC. Epub 2006 Jan 26. Am J Respir Cell Mol Biol. 2006. PMID: 16439799 Free PMC article. Review.
Cited by
-
Re-identification and characterization of grass carp Ctenopharyngodon idella TLR20.Fish Shellfish Immunol Rep. 2023 Oct 7;5:100119. doi: 10.1016/j.fsirep.2023.100119. eCollection 2023 Dec 15. Fish Shellfish Immunol Rep. 2023. PMID: 37841419 Free PMC article.
-
TLR7 neo-functionalizes to sense dsRNA and trigger antiviral and antibacterial immunity in non-tetrapod vertebrates.iScience. 2023 Oct 24;26(12):108315. doi: 10.1016/j.isci.2023.108315. eCollection 2023 Dec 15. iScience. 2023. PMID: 38025781 Free PMC article.
-
Toll-like receptor signaling in teleosts.Sci China Life Sci. 2025 Jul;68(7):1889-1911. doi: 10.1007/s11427-024-2822-5. Epub 2025 Feb 14. Sci China Life Sci. 2025. PMID: 39961973 Review.
-
Vegetable omega-3 and omega-6 fatty acids differentially modulate the antiviral and antibacterial immune responses of Atlantic salmon.Sci Rep. 2024 May 13;14(1):10947. doi: 10.1038/s41598-024-61144-w. Sci Rep. 2024. PMID: 38740811 Free PMC article.
-
Fish TLR5 develops a taste for viral RNA.EMBO Rep. 2022 Aug 3;23(8):e55443. doi: 10.15252/embr.202255443. Epub 2022 Jun 28. EMBO Rep. 2022. PMID: 35762506 Free PMC article.
References
-
- Akira S, Takeda K, Kaisho T (2001) Toll‐like receptors: critical proteins linking innate and acquired immunity. Nat Immunol 2: 675–680 - PubMed
-
- Alexopoulou L, Holt AC, Medzhitov R, Flavell RA (2001) Recognition of double‐stranded RNA and activation of NF‐kappaB by Toll‐like receptor 3. Nature 413: 732–738 - PubMed
-
- Brownlie R, Allan B (2011) Avian toll‐like receptors. Cell Tissue Res 343: 121–130 - PubMed
-
- Esmail S, Manolson MF (2021) Advances in understanding N‐glycosylation structure, function, and regulation in health and disease. Eur J Cell Biol 100: 151186 - PubMed
Publication types
MeSH terms
Substances
LinkOut - more resources
Full Text Sources
Molecular Biology Databases
Research Materials
