. 2022 Aug 5;12(8):1873-1885.
doi: 10.1158/2159-8290.CD-21-1273.

Human Colon Cancer-Derived Clostridioides difficile Strains Drive Colonic Tumorigenesis in Mice

Affiliations

Human Colon Cancer-Derived Clostridioides difficile Strains Drive Colonic Tumorigenesis in Mice

Julia L Drewes et al. Cancer Discov. .

Abstract

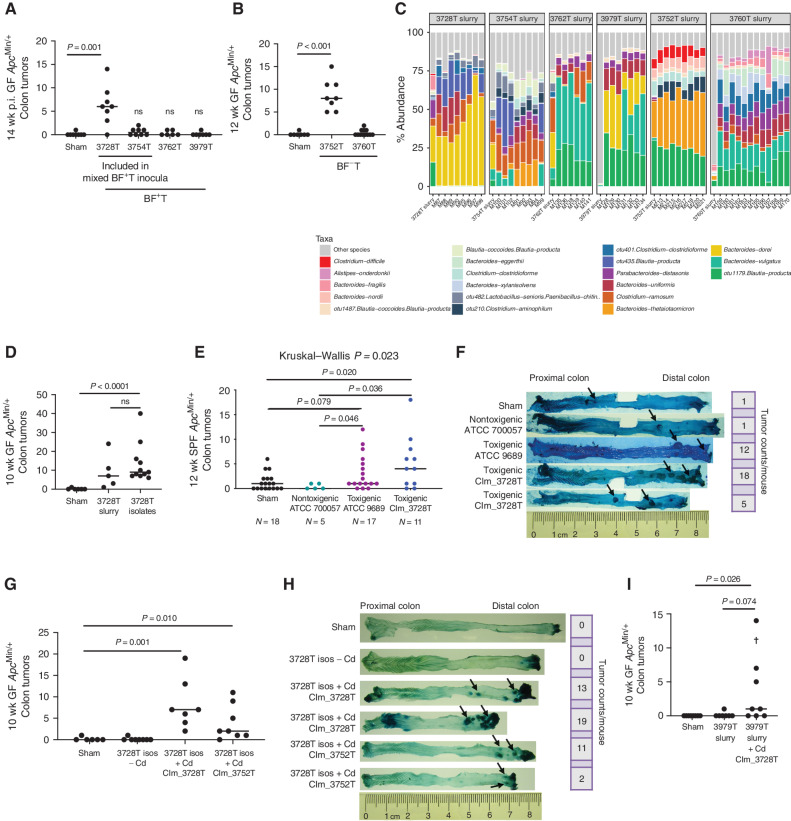
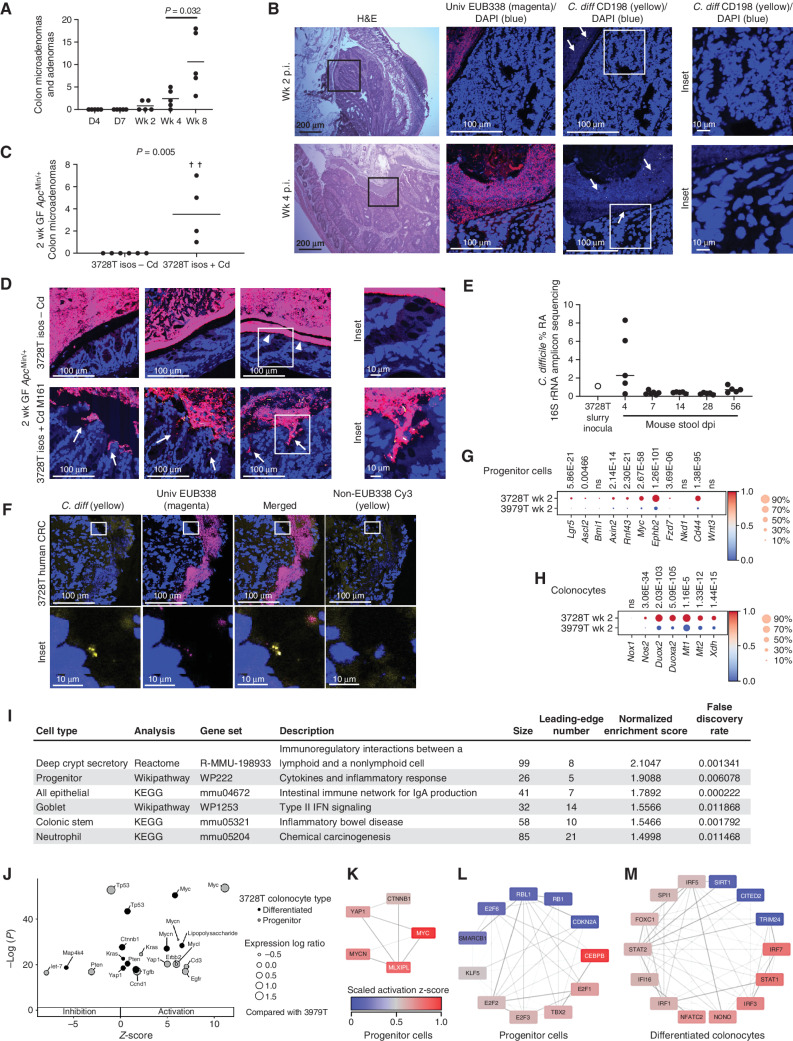
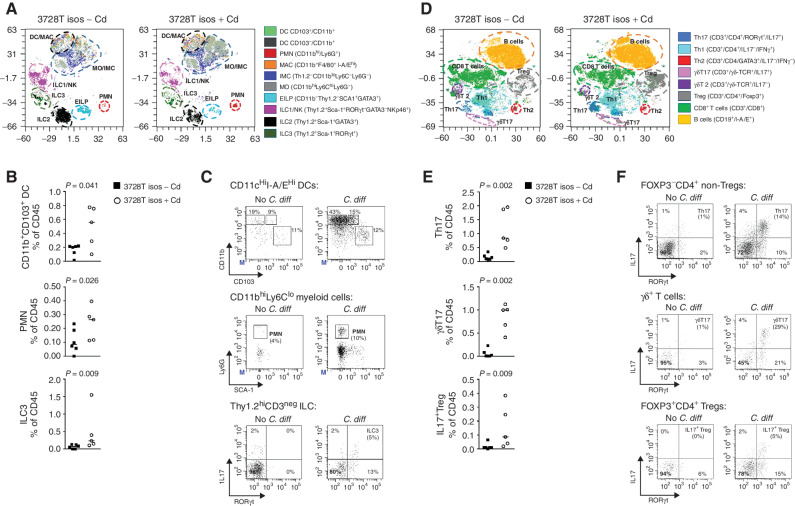
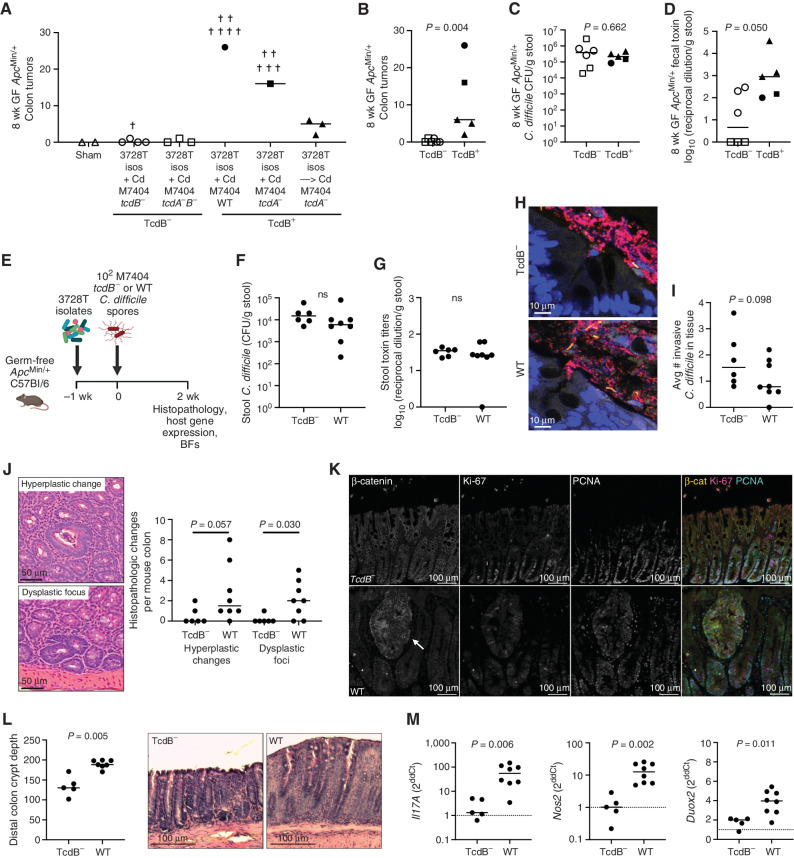
Defining the complex role of the microbiome in colorectal cancer and the discovery of novel, protumorigenic microbes are areas of active investigation. In the present study, culturing and reassociation experiments revealed that toxigenic strains of Clostridioides difficile drove the tumorigenic phenotype of a subset of colorectal cancer patient-derived mucosal slurries in germ-free ApcMin/+ mice. Tumorigenesis was dependent on the C. difficile toxin TcdB and was associated with induction of Wnt signaling, reactive oxygen species, and protumorigenic mucosal immune responses marked by the infiltration of activated myeloid cells and IL17-producing lymphoid and innate lymphoid cell subsets. These findings suggest that chronic colonization with toxigenic C. difficile is a potential driver of colorectal cancer in patients.

Significance: Colorectal cancer is a leading cause of cancer and cancer-related deaths worldwide, with a multifactorial etiology that likely includes procarcinogenic bacteria. Using human colon cancer specimens, culturing, and murine models, we demonstrate that chronic infection with the enteric pathogen C. difficile is a previously unrecognized contributor to colonic tumorigenesis. See related commentary by Jain and Dudeja, p. 1838. This article is highlighted in the In This Issue feature, p. 1825.


Figures

Figure 1.
Figure 1.
C. difficile strains isolated from human colon cancer mucosa drive colonic tumor formation in GF ApcMin/+ mice. A and B, Variation in colonic tumorigenic potential in GF ApcMin/+ mice at 12 to 14 weeks post-inoculation (p.i.) by individual BF-positive tumor (BF+T; A) or BF-negative tumor (BFT; B) colorectal cancer mucosal samples from six patients. n = 6–8 mice per group, from two independent experiments. C, 16S rRNA amplicon sequencing relative abundances of the top 20 species in the six patient tumor slurry inocula and 12 to 14 weeks p.i. stools from mice gavaged with the tumor slurries. D, A consortium of 30 bacterial isolates derived from GF mice gavaged with the 3728T slurry recapitulated colonic tumorigenesis of the original 3728T slurry. n = 5–11 mice per group. E and F, Colonic tumor counts (E) and representative methylene blue staining (F) of colonic tumors (arrows) at 12 weeks p.i. in a vancomycin/gentamicin model (see Methods) of chronic colonization with nontoxigenic (TcdATcdB) or toxigenic (TcdA+TcdB+) C. difficile strains. n = 5–18 mice per group, from two independent experiments. G and H, Colonic tumor counts (G) and representative methylene blue staining (H) of colonic tumors (arrows) from GF ApcMin/+ mice gavaged with the 3728T isolates with or without the CIm_3728T or CIm_3752T C. difficile strains. n = 6–8 mice per group. I, Colonic tumors induced in GF ApcMin/+ mice gavaged with either the 3979T slurry or the 3979T slurry with C. difficile strain CIm_3728T at 10 weeks p.i. The cross represents a mouse death. n = 7–8 mice per group. Statistical significance was calculated via Kruskal–Wallis followed by Mann–Whitney tests. Mann–Whitney P values are shown. ns, not significant.
Figure 2.
Figure 2.
C. difficile and the 3728T slurry induce rapid tumorigenesis in GF ApcMin/+ mice despite representing only a fraction of the luminal and mucosal microbiota. A and B, Twenty-five GF ApcMin/+ mice were gavaged with the 3728T slurry; five mice were sacrificed per time point. A, Colonic microadenoma and adenoma counts. B, Hematoxylin and eosin (H&E) staining of a representative microadenoma is shown from a mouse at 2 weeks p.i. (top), whereas a large adenoma coated by a dense BF is shown from a mouse at 4 weeks p.i. (bottom). Confocal imaging of Carnoy's-fixed mouse distal colons stained with the EUB338 universal probe (magenta), Cd198 C. difficile probe (yellow), or DAPI counterstain (blue). White arrows highlight individual C. difficile rods. C and D, Microadenomas (C) and FISH staining (D) of 2 weeks p.i. distal colons from GF ApcMin/+ mice gavaged with the 3728T isolates ± C. difficile CIm_3728T. Crosses represent mouse deaths. n = 6 mice per group, from two independent experiments. FISH images represent three separate mice per inoculum. White arrowheads denote areas with occasional mucus-invasive BFs directly interacting with epithelium in mice gavaged with the 3728T isolates without C. difficile (3728T isos – Cd). White arrows (bottom) represent areas with crypt-invasive BFs in the mice gavaged with the 3728T isolates + C. difficile. Statistical significance in A and C was calculated via Kruskal–Wallis followed by Mann–Whitney tests. Mann–Whitney P values are shown. E, Relative abundance (RA) of C. difficile derived from 16S rRNA amplicon sequencing of the original human slurry (3728T) or mouse stool obtained at sacrifice of mice in the time course experiment following gavage with the 3728T slurry. dpi, days post-inoculation. F, FISH of the original patient tumor 3728T. CRC, colorectal cancer. G–M, scRNA-seq and gene set enrichment analysis of 3728T slurry (n = 3)– versus 3979T slurry (n = 3)–gavaged GF ApcMin/+ mice at 2 weeks p.i. Heat maps depict genes enriched in canonical Wnt (G) or ROS (H) signaling pathways, with Wilcoxon rank-sum test P values above each gene. I, Inflammatory signaling pathways enriched in specific cell types from 3728T slurry– versus 3979T slurry–gavaged mice at 2 weeks p.i. KEGG, Kyoto Encyclopedia of Genes and Genomes. J, Inhibition and activation of the most significant upstream regulators in either progenitor or differentiated colonocytes. Expression log ratio is an effect size statistic. K and L, Network analysis of transcription factors from IPA upstream regulators enriched in the progenitor cell gene list revealed activation of Wnt/Myc signaling and proliferation, respectively. Lines connect transcription factors with shared target genes in the gene list. Darker lines indicate a greater number of shared target genes. M, Similar network analysis for differentiated colonocytes showed activation of the innate immune response.
Figure 3.
Figure 3.
C. difficile induces the activation of myeloid cells and IL17-producing lymphoid subsets. Multiparameter flow cytometry analysis of colonic lamina propria innate (myeloid and ILCs) and adaptive immune cell populations of LPL isolated from colons collected at 2 weeks p.i. from GF ApcMin/+ mice gavaged with the 3728T isolates with (n = 5) or without (n = 6) C. difficile strain CIm_3728T. Results from two independent experiments. A, Opt-SNE projection of myeloid and ILC populations. B, Dot plots of myeloid cell type abundance as a percentage of the CD45 population. C, Representative gating of DCs, PMN, and IL17 expression by ILC3 cells. D, Opt-SNE projection of adaptive populations (B and T lymphocytes). E, Dot plots of changes in abundance of lymphoid populations with C. difficile. F, Representative gating of lymphoid subsets. Opt-SNE projections are used for visualization purposes only. Statistical analyses in B and E represent Mann–Whitney t tests based on the gating in C and F, respectively. DC, dendritic cells; EILP, early innate lymphoid progenitors; ILC, innate lymphoid cells; IMC, innate myeloid cells; LPL, lamina propria leukocytes; MAC, macrophages; MO, monocytic cells; NK, natural killer; PMN, polymorphonuclear cells; Treg, regulatory T cells.
Figure 4.
Figure 4.
C. difficile–associated tumorigenesis is toxin B (TcdB)–dependent. A, GF ApcMin/+ mice were gavaged with WT or isogenic tcdA, tcdB, or tcdAtcdB TargeTron mutant strains of M7404, an epidemic strain of ribotype 027, either simultaneously with the 3728T isolates or 1 week later. Tumor counts at 8 weeks p.i. were analyzed. Crosses represent mouse deaths. n = 2–7 mice per group, from two independent experiments. B, Summary graph showing colonic tumor induction of all TcdB versus TcdB+ M7404 strains in combination with the 3728T isolates in GF ApcMin/+ mice. C and D,C. difficile stool CFUs and Vero toxin titers. Mann–Whitney P value is shown. E–M, Experimental design for 2-week experiments with M7404 strains: mice were gavaged with the 3728T isolates − Cd 1 week prior to C. difficile gavage with either the tcdB (n = 6 mice) or WT M7404 strain (n = 8 mice). F and G,C. difficile stool CFUs and toxin titers. H, Representative crypts with BF invasion, stained in red for EUB338 and yellow for Cd198. I,C. difficile tissue invasion. J, Representative H&E images and quantitation of histopathologic changes at 2 weeks p.i. K, Representative images of β-catenin, Ki-67, and PCNA immunofluorescent staining of distal colonic epithelium in M7404 TcdB (top)– versus M7404 WT (bottom)–inoculated mice. Arrow denotes a dysplastic focus in the M7404 WT–inoculated mouse. L, Quantitation and representative images of crypt depth in the distal colon. M, Host gene expression in colon. Dashed line represents 3728T isolates − Cd-negative control. Statistics shown are Mann–Whitney t tests. ns, not significant.

Comment in

References

    1. Drewes JL, White JR, Dejea CM, Fathi P, Iyadorai T, Vadivelu J, et al. . High-resolution bacterial 16S rRNA gene profile meta-analysis and biofilm status reveal common colorectal cancer consortia. NPJ Biofilms Microbiomes 2017;3:34. - PMC - PubMed
    1. Thomas AM, Manghi P, Asnicar F, Pasolli E, Armanini F, Zolfo M, et al. . Metagenomic analysis of colorectal cancer datasets identifies cross-cohort microbial diagnostic signatures and a link with choline degradation. Nat Med 2019;25:667–78. - PMC - PubMed
    1. Wirbel J, Pyl PT, Kartal E, Zych K, Kashani A, Milanese A, et al. . Meta-analysis of fecal metagenomes reveals global microbial signatures that are specific for colorectal cancer. Nat Med 2019;25:679–89. - PMC - PubMed
    1. Wong SH, Zhao L, Zhang X, Nakatsu G, Han J, Xu W, et al. . Gavage of fecal samples from patients with colorectal cancer promotes intestinal carcinogenesis in germ-free and conventional mice. Gastroenterology 2017;153:1621–33. - PubMed
    1. Tomkovich S, Dejea CM, Winglee K, Drewes JL, Chung L, Housseau F, et al. . Human colon mucosal biofilms from healthy or colon cancer hosts are carcinogenic. J Clin Invest 2019;129:1699–712. - PMC - PubMed

Publication types

Substances