. 2022 Jul;27(4):309-323.
doi: 10.1007/s12192-022-01268-y. Epub 2022 Jun 9.

Human HspB1, HspB3, HspB5 and HspB8: Shaping these disease factors during vertebrate evolution

Affiliations

Human HspB1, HspB3, HspB5 and HspB8: Shaping these disease factors during vertebrate evolution

Rainer Benndorf et al. Cell Stress Chaperones. 2022 Jul.

Abstract

Small heat shock proteins (sHSPs) emerged early in evolution and occur in all domains of life and nearly in all species, including humans. Mutations in four sHSPs (HspB1, HspB3, HspB5, HspB8) are associated with neuromuscular disorders. The aim of this study is to investigate the evolutionary forces shaping these sHSPs during vertebrate evolution. We performed comparative evolutionary analyses on a set of orthologous sHSP sequences, based on the ratio of non-synonymous: synonymous substitution rates for each codon. We found that these sHSPs had been historically exposed to different degrees of purifying selection, decreasing in this order: HspB8 > HspB1, HspB5 > HspB3. Within each sHSP, regions with different degrees of purifying selection can be discerned, resulting in characteristic selective pressure profiles. The conserved α-crystallin domains were exposed to the most stringent purifying selection compared to the flanking regions, supporting a 'dimorphic pattern' of evolution. Thus, during vertebrate evolution the different sequence partitions were exposed to different and measurable degrees of selective pressures. Among the disease-associated mutations, most are missense mutations primarily in HspB1 and to a lesser extent in the other sHSPs. Our data provide an explanation for this disparate incidence. Contrary to the expectation, most missense mutations cause dominant disease phenotypes. Theoretical considerations support a connection between the historic exposure of these sHSP genes to a high degree of purifying selection and the unusual prevalence of genetic dominance of the associated disease phenotypes. Our study puts the genetics of inheritable sHSP-borne diseases into the context of vertebrate evolution.

Keywords: Alpha B-crystallin; Disease-associated missense mutation; Genetic dominance; Genotype-phenotype relationship; Neuropathy, Myopathy; Purifying selection.


Conflict of interest statement

The authors declare that there are no competing interests associated with the manuscript.

Figures
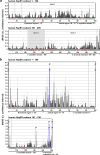
Fig. 1
Fig. 1
Selective pressures along the sequences of human HspB1 (a), HspB3 (b), HspB5 (c) and HspB8 (d) as returned by the FEL algorithm. The dN/dS point estimates were determined for each codon of the aligned Gnathostomata sHSP orthologs, omitting all codons without homologous amino acid residues in the human sequences. The plots show the principal ω-values with the respective confidence intervals (lower and upper bound; light gray error bars) along the primary sequences. No columns or black columns: ω < 1, indicating that these positions were historically exposed to purifying selection, using p ≤ 0.1 as statistical significance threshold; dark gray columns: ω ≈ 1 or near 1, with p > 0.1, indicating neutral evolution; blue columns: ω > 1, with p < 0.1, indicating positive selection. Positions with undefined ω-values are indicated by columns of gray x. Amino acid residues affected by disease-associated missense mutations are highlighted in color (red, green: dominant and recessive disease phenotypes, respectively). Sequence segments (partitions) with relatively low, intermediate or high ω-values in average, as they can be discerned, are indicated and were used to delineate the sequence partitions as used in this study (cf. Table S4). These partitions correspond approximately, though not perfectly, to the NTR, CeR, αCD, and CTE. The exons are indicated where applicable
Fig. 1
Fig. 1
Selective pressures along the sequences of human HspB1 (a), HspB3 (b), HspB5 (c) and HspB8 (d) as returned by the FEL algorithm. The dN/dS point estimates were determined for each codon of the aligned Gnathostomata sHSP orthologs, omitting all codons without homologous amino acid residues in the human sequences. The plots show the principal ω-values with the respective confidence intervals (lower and upper bound; light gray error bars) along the primary sequences. No columns or black columns: ω < 1, indicating that these positions were historically exposed to purifying selection, using p ≤ 0.1 as statistical significance threshold; dark gray columns: ω ≈ 1 or near 1, with p > 0.1, indicating neutral evolution; blue columns: ω > 1, with p < 0.1, indicating positive selection. Positions with undefined ω-values are indicated by columns of gray x. Amino acid residues affected by disease-associated missense mutations are highlighted in color (red, green: dominant and recessive disease phenotypes, respectively). Sequence segments (partitions) with relatively low, intermediate or high ω-values in average, as they can be discerned, are indicated and were used to delineate the sequence partitions as used in this study (cf. Table S4). These partitions correspond approximately, though not perfectly, to the NTR, CeR, αCD, and CTE. The exons are indicated where applicable
Fig. 2
Fig. 2
Selective pressures estimated for the full-length sHSP sequences. a, Plot of the dN/dS estimates (aggregate ω¯-values with confidence intervals) of the full-length sHSPs, as returned by the FitMG94 algorithm. The data were taken from Table S4. b, Hasse diagram, as inferred by the FitMG94-Compare method, demonstrating the statistical relationship between the aggregate ω¯-values of the four human sHSPs. The arrows point to the sHSPs with the higher ω¯-values, i.e., they were historically exposed to a less stringent purifying selection
Fig. 3
Fig. 3
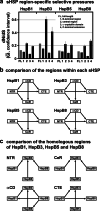
Selective pressures estimated for the various sHSP domains and regions. a, Plot of the dN/dS estimates (aggregate ω¯-values with confidence intervals) of the region-specific partitions of the four studied sHSPs, as returned by the FitMG94 algorithm. The data was taken from Table S4. For comparison, the aggregate ω¯-values of the full-length sequences are also included (gray columns). b, c, Hasse diagrams, as determined by the FitMG94-Compare method, demonstrating the statistical relationship between the aggregate ω¯-values of the regions within each sHSP sequence (b) or between the homologous regions of the four sHSPs (c). The arrows are used as in Fig. 2
Fig. 4
Fig. 4
Selective pressures estimated for the exons of HspB1, HspB5, and HspB8. a, Plot of the dN/dS estimates (aggregate ω¯-values with confidence intervals) of the various exon-specific partitions, as returned by the FitMG94 algorithm. The data were taken from Table S4. For comparison, the aggregate ω¯-values of the full-length sequences are also included (gray columns). b, c, Hasse diagrams, as determined by the FitMG94-Compare method, demonstrating the statistical relationship between the aggregate ω¯-values of the exons within each sHSP sequence (b) or between exons 2 of the three sHSPs (c). The arrows are used as in Fig. 2
Fig. 5
Fig. 5
Summary of the selective pressures detected at the disease-associated missense mutation sites of the four studied sHSPs. The dN/dS point estimates (ω-values with confidence intervals) for each mutation site were taken from Table S3. The positions of the mutation sites within the various sequence partitions (domains, regions, exons) of the sHSPs are indicated (cf. Table S1, Fig. 1). The asterisks mark mutation sites whose mutations are associated with a recessive disease phenotype. All other mutation sites are affected by mutations that are associated with a dominant disease phenotype, or this association can be assumed

References

    1. Adriaenssens E, Geuens T, Baets J, Echaniz-Laguna A, Timmerman V. Novel insights in the disease biology of mutant small heat shock proteins in neuromuscular diseases. Brain. 2017;140:2541–2549. doi: 10.1093/brain/awx187. - DOI - PubMed
    1. Almeida-Souza L, Goethals S, De WV, Dierick I, Gallardo R, Van DJ, Irobi J, Gettemans J, Rousseau F, Schymkowitz J, Timmerman V, Janssens S. Increased monomerization of mutant HSPB1 leads to protein hyperactivity in Charcot-Marie-Tooth neuropathy. J Biol Chem. 2010;285:12778–12786. doi: 10.1074/jbc.M109.082644. - DOI - PMC - PubMed
    1. Arenas M. Trends in substitution models of molecular evolution. Front Genet. 2015;6:319. doi: 10.3389/fgene.2015.00319. - DOI - PMC - PubMed
    1. Benndorf R, Martin JL, Kosakovsky Pond SL, Wertheim JO. Neuropathy- and myopathy-associated mutations in human small heat shock proteins: characteristics and evolutionary history of the mutation sites. Mutat Res Rev Mutat Res. 2014;761:15–30. doi: 10.1016/j.mrrev.2014.02.004. - DOI - PMC - PubMed
    1. Blekhman R, Man O, Herrmann L, Boyko AR, Indap A, Kosiol C, Bustamante CD, Teshima KM, Przeworski M. Natural selection on genes that underlie human disease susceptibility. Curr Biol. 2008;18:883–889. doi: 10.1016/j.cub.2008.04.074. - DOI - PMC - PubMed