. 2022 Jun 27;164(2):41-54.
doi: 10.1530/REP-22-0123. Print 2022 Aug 1.

Early growth response 1 transcription factor is essential for the pathogenic properties of human endometriotic epithelial cells

Affiliations

Early growth response 1 transcription factor is essential for the pathogenic properties of human endometriotic epithelial cells

Vineet K Maurya et al. Reproduction. .

Abstract

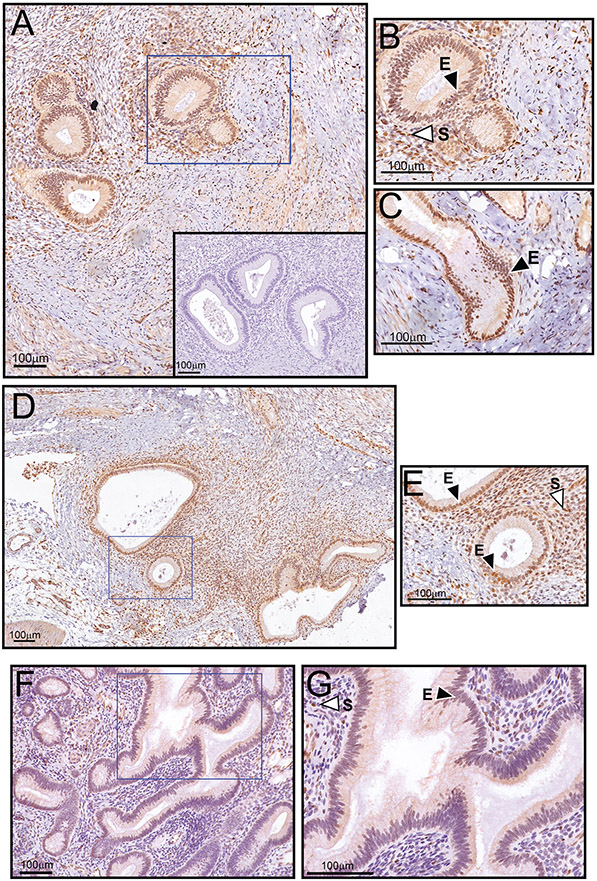
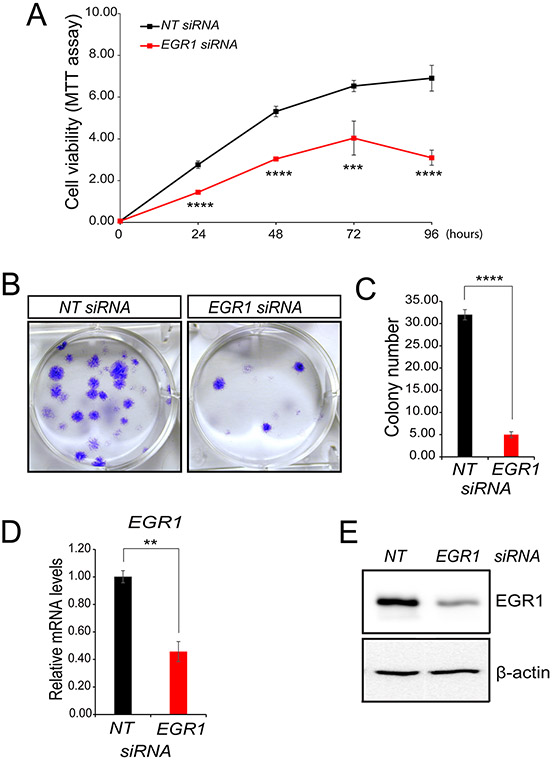
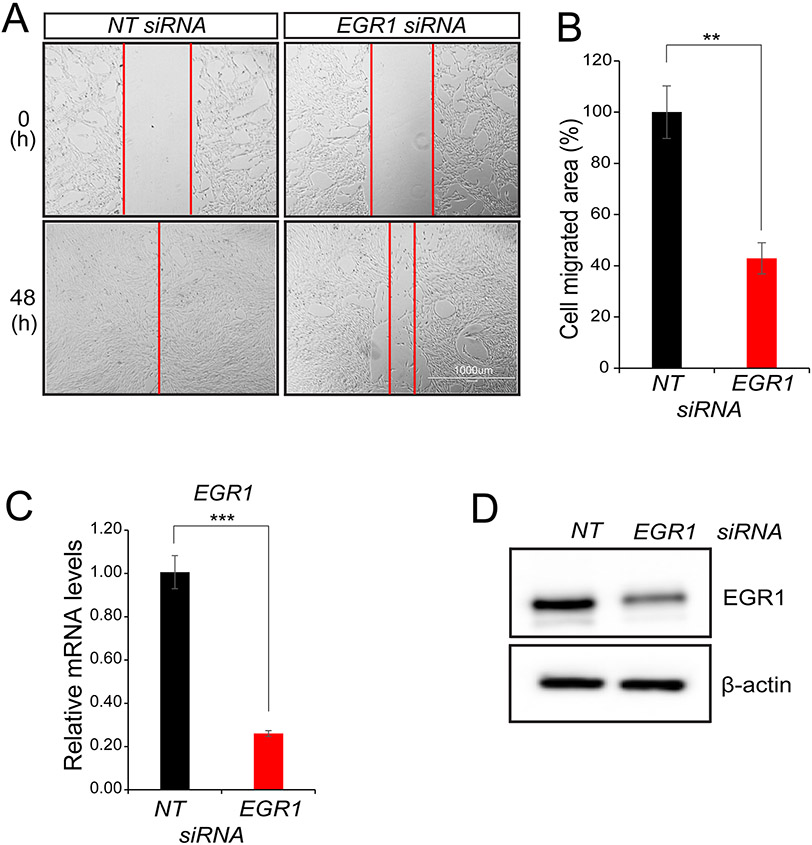
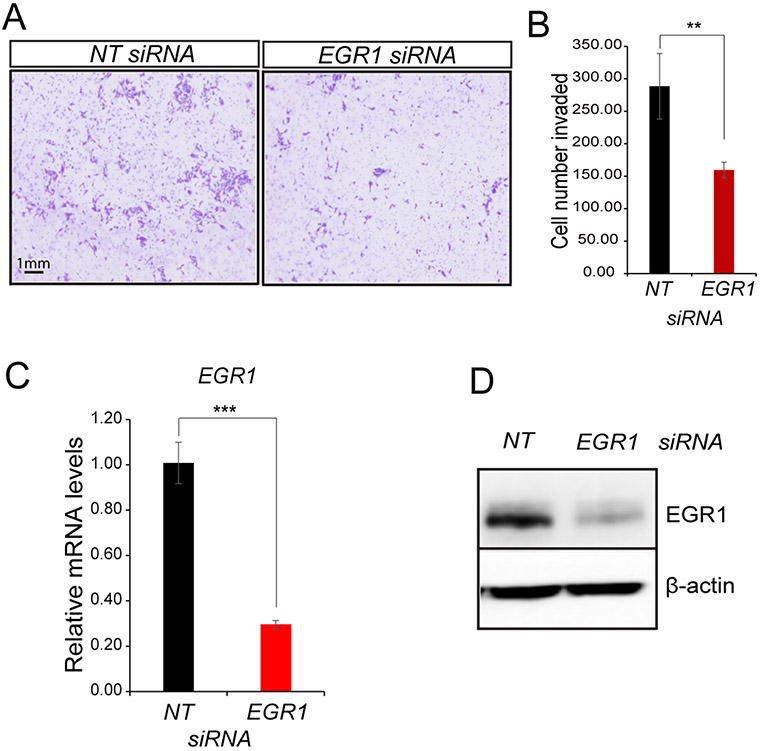
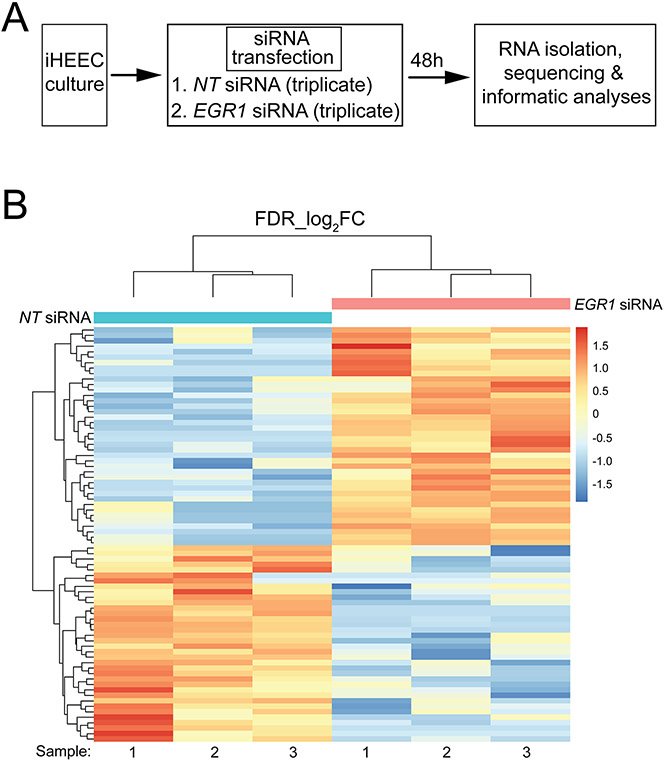
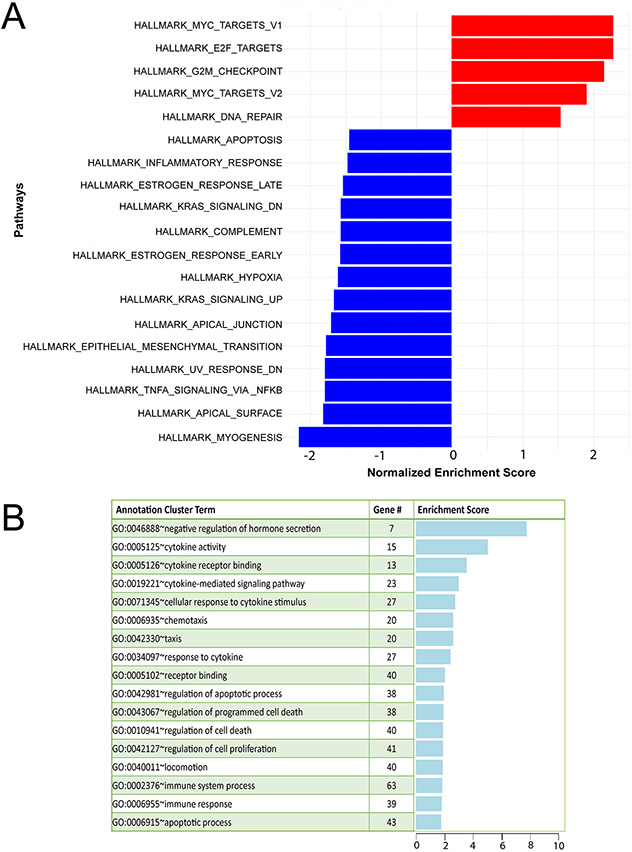
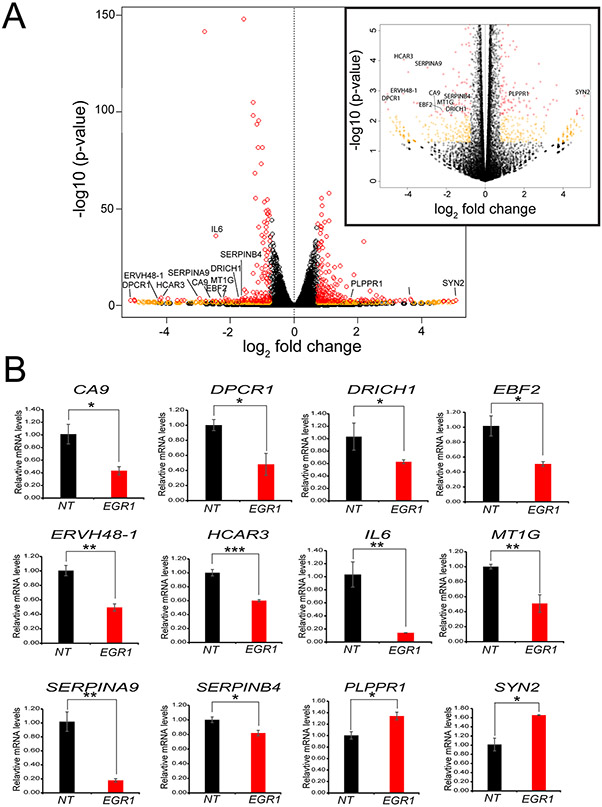
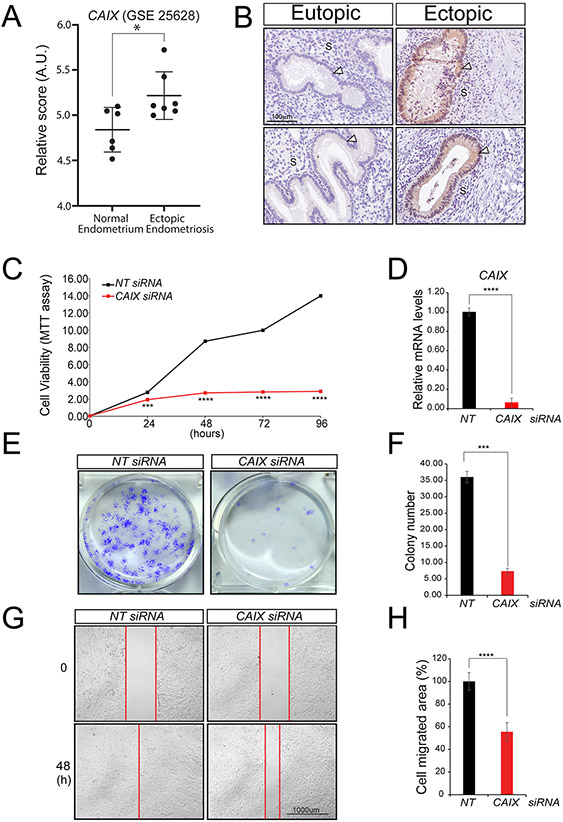
Although a non-malignant gynecological disorder, endometriosis displays some pathogenic features of malignancy, such as cell proliferation, migration, invasion and adaptation to hypoxia. Current treatments of endometriosis include pharmacotherapy and/or surgery, which are of limited efficacy and often associated with adverse side effects. Therefore, to develop more effective therapies to treat this disease, a broader understanding of the underlying molecular mechanisms that underpin endometriosis needs to be attained. Using immortalized human endometriotic epithelial and stromal cell lines, we demonstrate that the early growth response 1 (EGR1) transcription factor is essential for cell proliferation, migration and invasion, which represent some of the pathogenic properties of endometriotic cells. Genome-wide transcriptomics identified an EGR1-dependent transcriptome in human endometriotic epithelial cells that potentially encodes a diverse spectrum of proteins that are known to be involved in tissue pathologies. To underscore the utility of this transcriptomic data set, we demonstrate that carbonic anhydrase 9 (CA9), a homeostatic regulator of intracellular pH, is not only a molecular target of EGR1 but is also important for maintaining many of the cellular properties of human endometriotic epithelial cells that are also ascribed to EGR1. Considering therapeutic intervention strategies are actively being developed for EGR1 and CAIX in the treatment of other pathologies, we believe EGR1 and its transcriptome (which includes CA9) will offer not only a new conceptual framework to advance our understanding of endometriosis but will also furnish new molecular vulnerabilities to be leveraged as potential therapeutic options in the future treatment of endometriosis.


Conflict of interest statement

Declaration of interest

The authors declare that no conflict of interest could be perceived as prejudicing the impartiality of the research reported.

Figures

Figure 1
Figure 1
Significant EGR1 protein expression in epithelial and stromal cells of baboon ectopic endometriotic lesions. (A) Low power magnification image of an endometriotic lesion biopsied from the pelvic region of the baboon. Note the strong expression of EGR1 in the glandular epithelium and underlying stroma. The inset shows negative control staining, which does not include the primary antibody against EGR1. (B) Higher magnification image of a region demarcated with a blue box in (A); the epithelium and stroma are denoted by “E” and “S” respectively. (C) Higher magnification image of an elongated epithelial gland within the same endometriotic lesion (outside the field shown in (A)). Again, note the marked immunoreactivity for EGR1 in all epithelial cells that comprise the gland. (D) Low power magnification image of an endometriotic lesion in the peritoneal region. Again, note the significant EGR1 immunopositivity within the endometriotic lesion. (E) Higher power magnification image of a region delineated by the blue box in (D). Again, note the strong expression for EGR1 in the epithelial and stromal compartments that comprise the endometriotic lesion. (F) Matched eutopic endometrium exhibits significantly lower EGR1 expression in the epithelial and stromal compartments. (G) Higher magnification image of the region outlined by the blue box in (F). Note that the eutopic uterus and both ectopic endometriotic lesions shown are derived from the same animal during the secretory phase of the cycle (see: Materials and methods sub-section). The data are representative of a group size of n=4.
Figure 2
Figure 2
Proliferative and colony-forming properties of human endometriotic epithelial cells require EGR1. (A) Following NT or EGR1 siRNA transfection, iHEEC viability was assessed by the MTT assay. (B) A representative result from a colony-formation assay to assess the colony-forming abilities of human endometriotic epithelial cells forty-eight hours following NT or EGR1 siRNA transfection and subsequent culture for 10 days. (C) The histogram displays quantification of stained colony numbers. (D-E) Representative results of qPCR and Western immunoblot analyses confirm EGR1 depletion in the iHEEC line. For Western analyses, β-actin was used as a control for protein loading. Results are indicated as mean ± SE and are representative of three independent experiments; **p-value<0.01; ***p-value<0.001; and ****p-value<0.0001.
Figure 3
Figure 3
EGR1 is required for iHEEC migration in vitro. (A) The migration ability of iHEEC was assessed by the wound healing assay. Representative bright-field images of the migrated area forty-eight hours following the scratch; scale bar applies to both images. (B) The histogram displays the reduced migration ability of iHEECs following EGR1 knockdown, specifically showing 60% reduced migration ability of iHEECs compared to control. (C-D) Both qPCR and Western immunoblot results confirm that EGR1 expression levels are significantly attenuated at the RNA and protein level respectively forty-eight hours following transfection with NT or EGR1 siRNAs. For Western immunoblot analyses, β-actin served as a control for equal protein loading per lane. Results represent the mean ± SE and representative of three independent experiments; **p-value<0.01; and ***p-value<0.001.
Figure 4
Figure 4
Attenuation of EGR1 levels reduces the invasive capability of the iHEEC line in vitro. (A) Forty-eight hours following transfection with siRNAs targeting NT or EGR1, cell invasion analysis was initiated. Representative cell images are shown following the invasion experiment using either NT siRNA or EGR1 siRNA transfected cells; the scale bar applies to all images. (B) Representative histogram quantitatively displays the number of EGR1 siRNA transfected endometriotic epithelial cells that invaded the lower chamber compared with endometriotic epithelial cells transfected with NT siRNAs. (C-D) Both qPCR and Western immunoblot analyses confirm a significant reduction in EGR1 expression at the RNA and protein level respectively. Note: β-actin was used as a protein loading control. Results are represented as mean ± SE and representative of three independent experiments; **p-value<0.01 and ***p-value<0.001.
Figure 5
Figure 5
Changes in the iHEEC transcriptome following EGR1 knockdown. (A) Experimental design of the RNA-seq experiment; triplicate samples were used for NT siRNA and EGR1 siRNA groups. (B) Heatmap of clustering of genes with the same expression level differentially expressed (up or down) between the NT siRNA and EGR1 siRNA groups. With a FDR<0.05 and a IFCI >1.5, 76 genes differentially expressed between NT siRNA and EGR1 siRNA groups were clustered and presented as a heat map; each horizontal row represents a single gene. Warmer (i.e. reds) and cooler colors (i.e. blues) represent higher and lower expression respectively; the vertical color key on the right indicates the intensity with normalized expression values.
Figure 6
Figure 6
Pathway analyses of differential expressed genes in iHEECs following EGR1 knockdown. (A) GSEA of differential expressed genes between the NT siRNA and EGR1 siRNA groups showing normalized enrichment scores for listed Hallmark pathways. On the x-axis, normalized enrichment scores for gene expression changes (up or down represented by red and blue bars respectively) following a reduction in EGR1 levels in iHEECs; the y-axis displays hallmark gene-sets representing well-defined biological states or processes (Liberzon et al., 2011). (B) DAVID gene functional clustering analysis of genes differentially expressed between the NT siRNA and EGR1 siRNA treated iHEEC groups.
Figure 7
Figure 7
Expression validation of a select number of genes for which expression levels change in response to EGR1 knockdown in iHEECs. (A) Global gene expression changes displayed as a volcano plot represent the statistical significance (plotted as the log-transformed p-value) versus the fold change across all genes. To aid visualization, the insert on the right represents a magnification of the volcano plot of genes with a – log10 (p-value) up to 5. Individual genes are presented by open colored circles. Orange circles represent genes with an absolute fold change ≥ 1.5 and a p-value ≤ 0.05; red circles denote genes that also have an FDR ≤ 0.05. (B) Genes (10 downregulated and 2 upregulated following EGR1 knockdown) annotated in (A) were validated by qPCR.
Figure 8
Figure 8
Carbonic anhydrase IX is required to maintain the pathogenic properties of iHEECs. (A) The relative raw abundance of CAIX transcripts in human ectopic and matched control endometrium (from: Gene Expression Omnibus dataset GSE25628 (Crispi et al., 2013)). Note: CAIX transcripts are significantly elevated in human ectopic endometriosis compared with control endometrium (AU denotes arbitrary units). Human control and ectopic endometrial tissues were obtained during the proliferative phase. Data are presented as mean SE (control endometrium: n=6; ectopic endometrium: n=7); *p-value ≤0.05. (B) Immunohistochemical analysis shows that CAIX is undetectable in the baboon eutopic endometrium (top and bottom left panels represent two separate baboon eutopic endometrial tissues). Ectopic endometriotic lesions (right panels (top and bottom)) express CAIX that is restricted to epithelial cells (white arrowhead); “S” indicates stromal compartment. The scale bar shown in left top panel applies to all four panels in (B). (C-H) Cell viability, clonogenic survival, and wound healing assays respectively show that CAIX depletion in iHEECs results in a compromised ability to proliferate, form colonies, and migrate—all pathogenic properties of iHEECs. Results are represented as mean ± SE and representative of three independent experiments; *p-value<0.05, ***p-value<0.001 and ****p-value<0.0001.

References

    1. Aldera AP & Govender D 2021. Carbonic anhydrase IX: a regulator of pH and participant in carcinogenesis. J Clin Pathol.(10.1136/jclinpath-2020-207073) - DOI - PubMed
    1. Anders S, Pyl PT & Huber W 2015. HTSeq--a Python framework to work with high-throughput sequencing data. Bioinformatics 31 166–9.(10.1093/bioinformatics/btu638) - DOI - PMC - PubMed
    1. Angeli A, Carta F, Nocentini A, Winum JY, Zalubovskis R, Akdemir A, Onnis V, Eldehna WM, Capasso C, Simone G, et al. 2020. Carbonic Anhydrase Inhibitors Targeting Metabolism and Tumor Microenvironment. Metabolites 10.(10.3390/metabo10100412) - DOI - PMC - PubMed
    1. Becker HM 2020. Carbonic anhydrase IX and acid transport in cancer. Br J Cancer 122 157–167.(10.1038/s41416-019-0642-z) - DOI - PMC - PubMed
    1. Benej M, Svastova E, Banova R, Kopacek J, Gibadulinova A, Kery M, Arena S, Scaloni A, Vitale M, Zambrano N, et al. 2020. CA IX Stabilizes Intracellular pH to Maintain Metabolic Reprogramming and Proliferation in Hypoxia. Front Oncol 10 1462.(10.3389/fonc.2020.01462) - DOI - PMC - PubMed

Publication types

Substances