. 2022 Jun 9;17(6):e0264298.
doi: 10.1371/journal.pone.0264298. eCollection 2022.

Differential antibody production by symptomatology in SARS-CoV-2 convalescent individuals

Affiliations

Differential antibody production by symptomatology in SARS-CoV-2 convalescent individuals

Sharada Saraf et al. PLoS One. .

Abstract

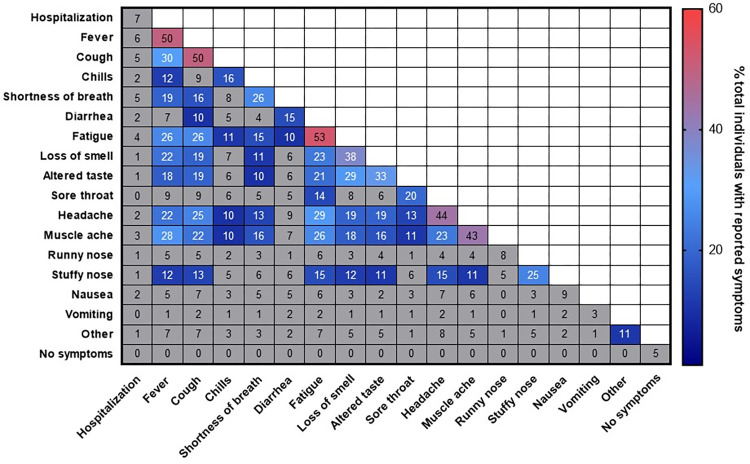
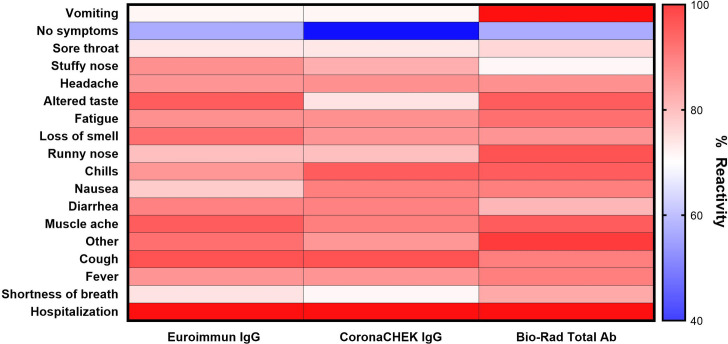
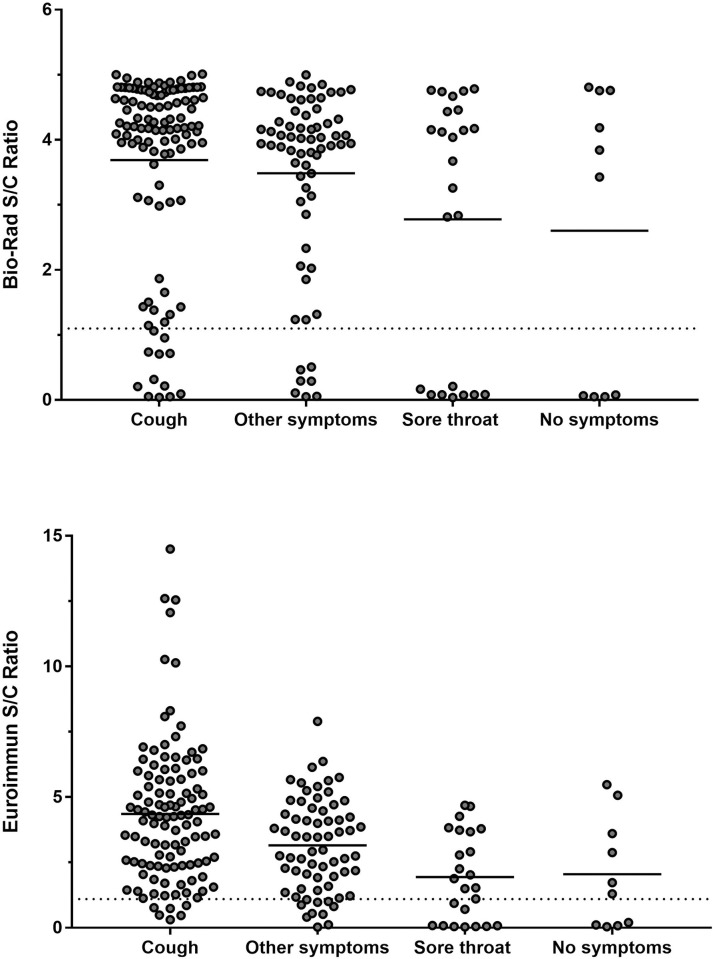
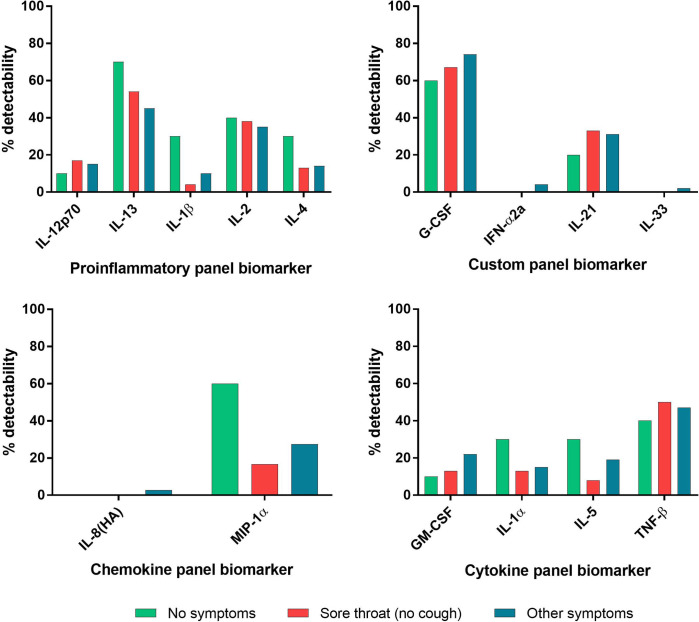
The association between COVID-19 symptoms and antibody responses against SARS-CoV-2 is poorly characterized. We analyzed antibody levels in individuals with known SARS-CoV-2 infection to identify potential antibody-symptom associations. Convalescent plasma from 216 SARS-CoV-2 RNA+ individuals with symptomatology information were tested for the presence of IgG to the spike S1 subunit (Euroimmun ELISA), IgG to receptor binding domain (RBD, CoronaCHEK rapid test), and for IgG, IgA, and IgM to nucleocapsid (N, Bio-Rad ELISA). Logistic regression was used to estimate the odds of having a COVID-19 symptom from the antibody response, adjusting for sex and age. Cough strongly associated with antibodies against S1 (adjusted odds ratio [aOR] = 5.33; 95% CI from 1.51 to 18.86) and RBD (aOR = 4.36; CI 1.49, 12.78). In contrast, sore throat significantly associated with the absence of antibodies to S1 and N (aOR = 0.25; CI 0.08, 0.80 and aOR = 0.31; 0.11, 0.91). Similarly, lack of symptoms associated with the absence of antibodies to N and RBD (aOR = 0.16; CI 0.03, 0.97 and aOR = 0.16; CI 0.03, 1.01). Cough appeared to be correlated with a seropositive result, suggesting that SARS-CoV-2 infected individuals exhibiting lower respiratory symptoms generate a robust antibody response. Conversely, those without symptoms or limited to a sore throat while infected with SARS-CoV-2 were likely to lack a detectable antibody response. These findings strongly support the notion that severity of infection correlates with robust antibody response.


Conflict of interest statement

The authors have declared that no competing interests exist.

Figures

Fig 1
Fig 1. Frequency and correlation of COVID-19 symptoms.
Percentage of individuals with the symptoms or pairs of symptoms are presented. Symptom or symptom pairs prevalent in >10% of individuals are colored.
Fig 2
Fig 2. Reactivity of antibody assays by presenting symptoms.
Percent reactivity was calculated by dividing the number of individuals with positive antibody results reporting the indicated symptom by the total number of individuals reporting the indicated symptom.
Fig 3
Fig 3. Antibody reactivity to nucleocapsid protein as measured by Bio-Rad ELISA and S1 protein as measured by Euroimmun ELISA stratified by symptom category.
Solid horizontal lines represent the mean S/C ratio for the indicated symptom group. Dashed horizontal line represents the positive result threshold for the indicated assay.
Fig 4
Fig 4. Cytokine and chemokine levels by symptom group.
Log-transformed concentrations of cytokine and chemokines with ≥80% detectability in the overall sample are shown. The median and inter-quartile range as well as all data points are presented. Individuals reporting no symptoms (n = 10), sore throat and no cough (n = 24), and all other symptoms (n = 182) are shown in green, red, and blue, respectively.
Fig 5
Fig 5. Detectability of cytokine and chemokine markers by response panel and symptom group.
Cytokine and chemokine analytes with <80% detectability in the overall participant group are shown according to MSD panel. Individuals reporting no symptoms (n = 10), sore throat and no cough (n = 24), and all other symptoms (n = 182) are shown in green, red, and blue, respectively.

Update of

References

    1. Yang X, Yu Y, Xu J, et al.. Clinical course and outcomes of critically ill patients with SARS-CoV-2 pneumonia in wuhan, china: A single-centered, retrospective, observational study. The Lancet Respiratory Medicine. 2020;8(5):475–481. doi: 10.1016/S2213-2600(20)30079-5 - DOI - PMC - PubMed
    1. Lumley SF, O’Donnell D, Stoesser NE, et al.. Antibody status and incidence of SARS-CoV-2 infection in health care workers. New England Journal of Medicine. 2021;384(6):533–540. doi: 10.1056/NEJMoa2034545 - DOI - PMC - PubMed
    1. Feng S, Phillips DJ, White T, et al.. Correlates of protection against symptomatic and asymptomatic SARS-CoV-2 infection. Nature Medicine 2021 27:11. 2021;27(11):2032–2040. doi: 10.1038/s41591-021-01540-1 - DOI - PMC - PubMed
    1. Bartsch YC, Fischinger S, Siddiqui SM, et al.. Discrete SARS-CoV-2 antibody titers track with functional humoral stability. Nature Communications 2021 12:1. 2021;12(1):1–8. - PMC - PubMed
    1. Klein SL, Pekosz A, Park H, et al.. Sex, age, and hospitalization drive antibody responses in a COVID-19 convalescent plasma donor population. J Clin Invest. 2020;130(11):6141–6150. Accessed Jan 7, 2022. doi: 10.1172/JCI142004 - DOI - PMC - PubMed

Publication types