. 2022 Jun 10;376(6598):1220-1223.
doi: 10.1126/science.abj2972. Epub 2022 Jun 9.

Robust variation in infant gut microbiome assembly across a spectrum of lifestyles

Affiliations

Robust variation in infant gut microbiome assembly across a spectrum of lifestyles

Matthew R Olm et al. Science. .

Abstract

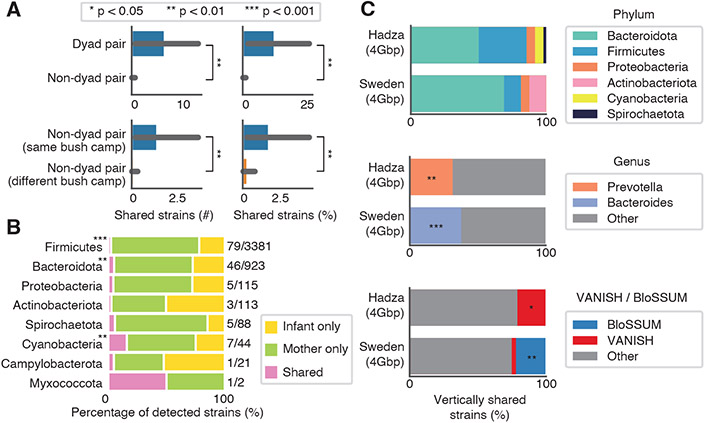
Infant microbiome assembly has been intensely studied in infants from industrialized nations, but little is known about this process in nonindustrialized populations. We deeply sequenced infant stool samples from the Hadza hunter-gatherers of Tanzania and analyzed them in a global meta-analysis. Infant microbiomes develop along lifestyle-associated trajectories, with more than 20% of genomes detected in the Hadza infant gut representing novel species. Industrialized infants-even those who are breastfed-have microbiomes characterized by a paucity of Bifidobacterium infantis and gene cassettes involved in human milk utilization. Strains within lifestyle-associated taxonomic groups are shared between mother-infant dyads, consistent with early life inheritance of lifestyle-shaped microbiomes. The population-specific differences in infant microbiome composition and function underscore the importance of studying microbiomes from people outside of wealthy, industrialized nations.


Figures

Fig. 1.
Fig. 1.. Age and lifestyle are associated with infant microbiome composition.
(A) Unweighted UniFrac dissimilarity PCoA (top left panel) of 1900 fecal samples from infants (< 3 years old) across 18 populations based on amplicon sequence variant (ASV) abundance. Point color indicates lifestyle, point size is proportional to age in months. Boxplots show the distribution of indicated age groups along PCo1 (bottom) and cohorts along PCo2 (right). (B) PCo2 versus sample age for the three lifestyle categories (solid lines) and specific indicated subpopulations (dashed lines). Upper purple dashed line includes Russia (Karelia) and South Africa (RU (Karelia)+SA) and the lower green dashed line includes Bangladesh, Malawi, and Nigeria (Urban) (MWI+NG+BD). The middle transitional line contains all transitional samples. Lines are the smoothed conditional mean of PCo2 loadings (loess fit). (C) Fractional abundance of co-abundance groups (CAGs) by age group and lifestyle. Taxa in annotation are the most abundant taxa in a CAG.
Fig. 2.
Fig. 2.. Age and lifestyle are associated with infant microbiome functions.
(A) PCoA based on 682 infant fecal metagenomes described at the gene abundance level in RPKM. Points are colored by lifestyle. Size indicates infant age in months. Boxplots (bottom panel) show the distribution of indicated age groups in months along PCo1. Boxplots (right panel) show the distribution of each lifestyle along PCo2. The main axis of variation in this gene-based ordination is significantly associated with age (EnvFit; R2 = 0.30; n=679; P = 0.001) and the second axis of variation is significantly associated with lifestyle (EnvFit; R2=0.35; n=679; P=0.001). (B) Fractional prevalence of species across lifestyles among 0-6 month old infants. Select VANISH (red) and BloSSUM (blue) (those with lowest adj-P) species are highlighted. B. infantis is shown in bold. “Other” (gray) taxa are those that are not significantly different by lifestyle. (C) Relative representation of four common Bifidobacterium species in 0-6 month olds by lifestyle. (D) Scatterplot of B infantis versus B. breve abundance among 0-6 month old infants. Contour lines display the kernel density estimation (KDE). (E) Prevalence of HMO-utilization clusters across ages and lifestyles. Clusters are considered present if all genes in the cluster are detected above a variable coverage threshold (to ensure that results are robust to differences in sequencing depth; see methods for details). * = adj-P < 0.05; Fisher’s exact test with false discovery rate correction; non-industrialized versus industrialized. (F) Phylogenetic tree of B. infantis genomes based on universal single copy genes. Genome names are colored based on lifestyle of origin. Isolate genomes are marked with a checkmark. Public reference genomes for B. longum and B. infantis are included in gray text.
Fig. 3.
Fig. 3.. Strain sharing between mother-infant dyads and non-dyads is lifestyle-specific.
(A) The mean strains shared (left) and the percentage of infant strains found in mothers (right) in mother-infant dyads versus mother-infant non-dyads (top) and non-dyads from the same bushcamp versus non-dyads from different bushcamps (bottom). Error bars represent standard error (* = adj-P < 0.05; ** = adj-P < 0.01; *** = adj-P < 0.001; Wilcoxon rank-sum test). (B) The percentage of strains detected in all Hadza mothers and infants and whether they are detected in infants only, mothers only, or shared within a mother / infant dyad (“Shared”) categorized by phylum. Numbers to the right of bars indicate the number of vertically shared strains over the number of strains detected in either infant or maternal samples. Phyla with a significant difference in the percentage of vertically transmitted strains as compared to all other phyla are marked with asterisks (Fisher’s exact test with p-value correction). (C) Percentage of vertically transmitted strains in Hadza and Swedish cohorts by phylum (top), genus (middle; only genera with significant differences shown), and VANISH / BloSSUM (bottom). All metagenomes were subset to 4Gbp for this analysis to remove any biases associated with sequencing depth. Taxa that are significantly enriched in either cohort are marked with an asterisk (* = adj-P < 0.05; ** = adj-P < 0.01; *** = adj-P < 0.001; Fisher’s exact test).

References

    1. Smits SA, Leach J, Sonnenburg ED, Gonzalez CG, Lichtman JS, Reid G, Knight R, Manjurano A, Changalucha J, Elias JE, Dominguez-Bello MG, Sonnenburg JL, Seasonal cycling in the gut microbiome of the Hadza hunter-gatherers of Tanzania. Science. 357, 802–806 (2017). - PMC - PubMed
    1. Fragiadakis GK, Smits SA, Sonnenburg ED, Van Treuren W, Reid G, Knight R, Manjurano A, Changalucha J, Dominguez-Bello MG, Leach J, Sonnenburg JL, Links between environment, diet, and the hunter-gatherer microbiome. Gut Microbes. 10, 216–227 (2019). - PMC - PubMed
    1. Yatsunenko T, Rey FE, Manary MJ, Trehan I, Dominguez-Bello MG, Contreras M, Magris M, Hidalgo G, Baldassano RN, Anokhin AP, Heath AC, Warner B, Reeder J, Kuczynski J, Caporaso JG, Lozupone CA, Lauber C, Clemente JC, Knights D, Knight R, Gordon JI, Human gut microbiome viewed across age and geography. Nature. 486, 222–227 (2012). - PMC - PubMed
    1. Stewart CJ, Ajami NJ, O’Brien JL, Hutchinson DS, Smith DP, Wong MC, Ross MC, Lloyd RE, Doddapaneni H, Metcalf GA, Muzny D, Gibbs RA, Vatanen T, Huttenhower C, Xavier RJ, Rewers M, Hagopian W, Toppari J, Ziegler A-G, She J-X, Akolkar B, Lernmark A, Hyoty H, Vehik K, Krischer JP, Petrosino JF, Temporal development of the gut microbiome in early childhood from the TEDDY study. Nature. 562, 583–588 (2018). - PMC - PubMed
    1. de Goffau MC, Jallow AT, Sanyang C, Prentice AM, Meagher N, Price DJ, Revill PA, Parkhill J, Pereira DIA, Wagner J, Gut microbiomes from Gambian infants reveal the development of a non-industrialized Prevotella-based trophic network. Nat Microbiol (2021), doi: 10.1038/s41564-021-01023-6. - DOI - PMC - PubMed

MeSH terms