. 2022 Aug 4;82(15):2797-2814.e11.
doi: 10.1016/j.molcel.2022.05.016. Epub 2022 Jun 8.

Direct epitranscriptomic regulation of mammalian translation initiation through N4-acetylcytidine

Affiliations

Direct epitranscriptomic regulation of mammalian translation initiation through N4-acetylcytidine

Daniel Arango et al. Mol Cell. .

Erratum in

Abstract

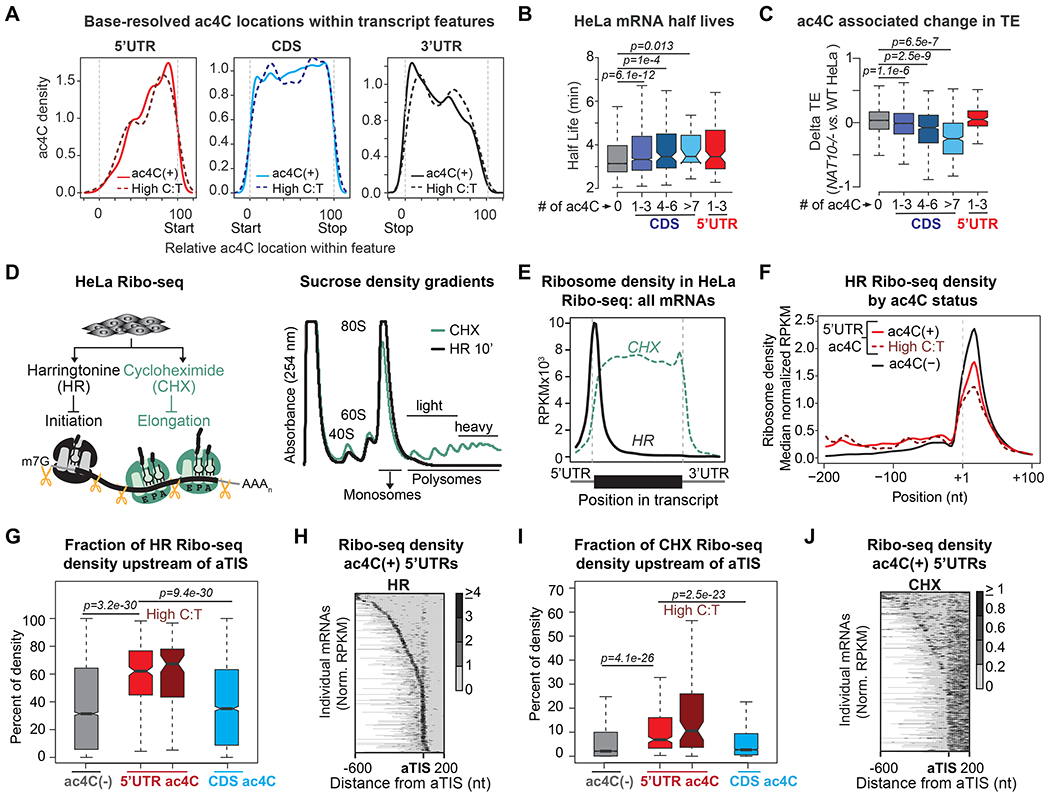
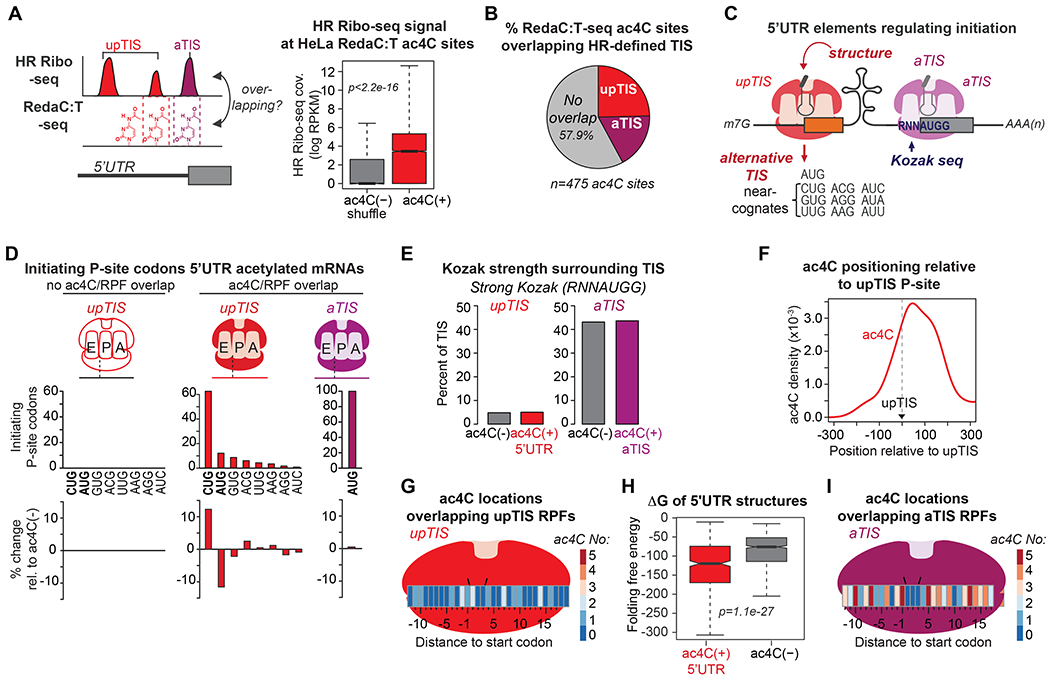
mRNA function is influenced by modifications that modulate canonical nucleobase behavior. We show that a single modification mediates distinct impacts on mRNA translation in a position-dependent manner. Although cytidine acetylation (ac4C) within protein-coding sequences stimulates translation, ac4C within 5' UTRs impacts protein synthesis at the level of initiation. 5' UTR acetylation promotes initiation at upstream sequences, competitively inhibiting annotated start codons. Acetylation further directly impedes initiation at optimal AUG contexts: ac4C within AUG-flanking Kozak sequences reduced initiation in base-resolved transcriptome-wide HeLa results and in vitro utilizing substrates with site-specific ac4C incorporation. Cryo-EM of mammalian 80S initiation complexes revealed that ac4C in the -1 position adjacent to an AUG start codon disrupts an interaction between C and hypermodified t6A at nucleotide 37 of the initiator tRNA. These findings demonstrate the impact of RNA modifications on nucleobase function at a molecular level and introduce mRNA acetylation as a factor regulating translation in a location-specific manner.

Keywords: 80S; Kozak; NAT10; ac4C; acetylcytidine; cryo-EM; epitranscriptome; initiation; t6A; translation.


Conflict of interest statement

Declaration of interests The authors declare no competing interests.

Figures

Figure 1:
Figure 1:. 5’UTR and CDS ac4C exert distinct influences on mRNA translation.
(A) ac4C RIP-seq peak locations relative to annotated TIS in HeLa. Inset depicts median Codon Stability Coefficients (CSCs) for the codons within each distance bin, comparing ac4C(−) to ac4C(+) mRNA regions. (B) Firefly luciferase mRNA was in vitro transcribed in the presence of CTP or ac4CTP and in vitro translated in RRL. Firefly translation was monitored through luminescence. Mean±SEM, n=3. p=Two-way ANOVA. (C) As in (B) but including mutations that removed all cytidines from the 5’ or 3’UTR. Mean±SEM, n=3. p=t-test. (D) Nanoluciferase (NanoLuc) mRNA with localized ac4C restricted to the CDS or 5’UTR was generated through in vitro transcription of a 5’ and 3’ mRNA fragment followed by splint ligation. Additional in vitro capping and polyadenylation of splint ligated NanoLuc was performed for 5’UTR acetylated mRNA. (E) In vitro translation of NanoLuc mRNA with site-specific CDS or 5’UTR ac4C. NanoLuc translation was monitored through luminescence. Mean±SEM, n=4. p=Two-way ANOVA. (F) Capped and polyadenylated NanoLuc mRNA translation in RRL (left) and transfected HeLa cells (right). Unmodified Firefly mRNA was co-transfected for simultaneous monitoring of NanoLuc and Firefly translation through dual luminescence. Mean±SEM of NanoLuc normalized by Firefly activity, n=5. p=Two-way ANOVA (left) or t-test (right).
Figure 2:
Figure 2:. Base-resolved mapping of ac4C in HeLa mRNA.
(A) RedaC:T-seq protocol and pipeline for determination of ac4C sites through NaBH4-induced C:T mismatches. (B) Distribution of C:T mismatches in 18S rRNA from wildtype (WT, red) and NAT10−/− (dark blue) HeLa. Positions 1337 and 1842 correspond to known ac4C sites. (C) Frequency of all mismatch types observed in RedaC:T-seq prior to filtering relative to untreated or NAT10−/− NaBH4-treated controls (D) Volcano plot depicting the change in mismatch ratio vs. significance comparing wildtype and NAT10−/− HeLa RedaC:T-seq results. Color coding indicates significant differences (FDR adj p≤0.05, Fisher’s exact test, ≥5 fold). (E) Cumulative frequency plot of C:T mismatch frequency distribution in wildtype and NAT10−/− RedaC:T-seq reads. (F) Median local RedaC:T-seq coverage at all detected ac4C sites in wildtype HeLa as compared to untreated control. (G) Browser views of example start codon proximal RedaC:T-seq defined ac4C sites showing: (top) wildtype HeLa acRIP-seq density (Arango et al., 2018), (middle) wildtype and NAT10−/− HeLa RedaC:T-seq, and (bottom) total and poly(A) HeLa ac4C-seq (Sas-Chen et al., 2020). (H) Sequencing depth at RedaC:T-seq defined ac4C sites in the current study and previous HeLa ac4C-seq. (I) Metagene plot of transcript coverage in HeLa RedaC:T-seq (red) and reanalysis of published HeLa ac4C-seq (purple). Solid lines show all mRNAs while dashed lines reflect coverage for RedaC:T-defined acetylated mRNAs.
Figure 3.
Figure 3.. Acetylated 5’UTRs display increased upstream translation initiation.
(A) Density plots depicting HeLa RedaC:T-seq mismatch rates segregated by transcript feature. Solid lines represent all ac4C sites exceeding the basal threshold (≥1.25% C:T), while dashed lines represent the top quartile of C:T mismatch rate (‘High C:T’, throughout). (B) HeLa mRNA half-lives segregated by transcript feature and number of ac4C sites. p=Wilcoxon test. (C) Difference in translation efficiency (TE) for NAT10−/− vs. wildtype HeLa cells segregated by transcript feature and number of ac4C sites. p=Wilcoxon test. (D) Absorbance at 254 nm in sucrose density gradient fractions from HeLa cells treated with harringtonine (HR) or cycloheximide (CHX). (E) Metagene plot of read density from HeLa HR and CHX Ribo-seq, RPKM: reads per kilobase per million mapped reads. (F) HR normalized Ribo-seq RPKMs segregated by ac4C status in a range of −200bp to +100bp from annotated TIS. Medians of binned values within the indicated transcript groups are plotted. (G) Fraction of HR RPF density localizing to 5’UTRs of mRNAs segregated by ac4C location. p=Wilcoxon test. (H) Heatmap of HR ribosome protected fragment (RPF) density in 5’UTR acetylated mRNAs, normalizing each row by total reads within a −600 to +200bp window. (I) CHX RPF density, as in (G). p=Wilcoxon test. (J) Heatmap of CHX RPF density in 5’UTR acetylated mRNAs, ordered as in (H).
Figure 4.
Figure 4.. Positional relationship between ac4C and translation initiation in base-resolved mapping.
(A) Boxplot of log HR Ribo-seq read density overlapping 5’UTR ac4C sites compared to random 5’UTR locations of ac4C(−) transcripts in HeLa mRNA. p=Wilcoxon test. (B) The portion of HeLa ac4C sites overlapping an HR Ribo-seq RPF associated with upstream (upTIS) or annotated (aTIS) initiation. (C) Representative 5’UTR elements influencing translation initiation. (D) Mapping of utilized start codons in HeLa HR Ribo-seq for 5’UTR ac4C(+) and ac4C(−) mRNAs. The difference in codon composition for 5’UTR ac4C(+) as compared to ac4C(−) mRNAs is also shown (bottom). (E) Percent of TIS with a strong Kozak sequence, by ac4C status. (F) Smoothed histogram density plot depicting ac4C distribution relative to dominant upTIS P-sites. (G)Heat map summarizing ac4C abundance overlapping initiating ribosomes at specific distances to dominant upTIS. (H) Boxplot of folding free energy (ΔG) of 5’UTRs by ac4C status. p=Wilcoxon test. (I) Heat map as in (G) for aTIS.
Figure 5.
Figure 5.. Position-specific influence of ac4C on translation initiation in mRNA reporters.
(A) ac4C was incorporated into specific 5’UTR locations in NanoLuc mRNA through in vitro transcription and splint ligation as in Fig. 1D. NanoLuc translation was achieved in RRL or in transfected wildtype and NAT10−/− HeLa cells. (B) NanoLuc mRNA containing ac4C or C within a structured uORF upstream of a consensus AUG start codon was generated through splint ligation and confirmed through Northern blot/phosphorimagery (left). Uncapped mRNAs were in vitro translated in RRL. NanoLuc activity was normalized by mRNAs levels (middle), Mean±SEM, n=3. p=Two-way ANOVA (middle). Capped and polyadenylated NanoLuc mRNAs were transfected into wildtype and NAT10−/− HeLa cells along with unmodified Firefly luciferase mRNA for in vivo translation. NanoLuc activity was normalized by Firefly luciferase (right), Mean±SEM, n=3 for HeLa WT, n=8 for NAT10−/−. p=t-test. (C) As in (B), but with NanoLuc mRNA containing C or ac4C in positions −1 and −2 of the Kozak sequence surrounding a consensus AUG start codon. Mean±SEM, n=5 for in vitro translation, n=5 for HeLa WT, n=4 for NAT10−/− p=Two-way ANOVA, in vitro results. p=t-test, in vivo results. (D) As in (B), but with NanoLuc mRNA containing C or ac4C directly over three tandem CUG start codons. Mean±SEM, n=3 for in vitro translation, n=4 for HeLa WT. n=4 for NAT10−/−. p=Two-way ANOVA, in vitro results. p=t-test, in vivo results.
Figure 6.
Figure 6.. ac4C within 5’UTRs and overlapping Kozak sequences inhibits canonical translation initiation in vivo.
(A) Heatmap of the change in initiating ribosome density in NAT10−/− vs. wildtype HeLa for mRNAs with ac4C(+) 5’UTRs within a −600 to +200bp window. Transcripts with major initiation occurring at an upTIS vs. aTIS are indicated. (B) Boxplot of the change in HR Ribo-seq density at major upTIS of ac4C(+) 5’UTRs in NAT10−/− vs. wildtype HeLa, separated based on relative ac4C positioning as indicated. Results from upTIS of ac4C(−) mRNAs are shown as control. Wilcoxon test=n.s. (C) As in (B) but plotting the change in HR Ribo-seq density at major aTIS, as indicated. p=Wilcoxon test. (D) Browser views of abundance normalized RedaC:T- and HR Ribo-seq, and Western blots of ac4C(−) and 5’UTR ac4C(+) mRNAs, as indicated. (E) Mfold prediction of PXN and KRT80 RNA structures surrounding detected ac4C sites. (F) Representative images at 0 and 24 hrs after scratch infliction in confluent wildtype and NAT10−/− HeLa cultures. (G) Biological pathway enrichment for genes with 5’UTR ac4C. p=Fisher’s exact test and Benjamini-Hochberg correction. (H) Propidium iodide staining and flow cytometry at the indicated times after release from double thymidine block in wildtype and NAT10−/− HeLa cells.
Figure 7.
Figure 7.. Acetylation of cytidine at Kozak nucleotide (−1) structurally alters intermolecular interaction with tRNAiMet t6A in 80S initiation complex cryo-EM.
(A) Mammalian 80S ICs were formed on in vitro transcribed mRNA fragments containing a single C (gold throughout) or ac4C (purple throughout) in the −1 position immediately adjacent to an AUG start codon. Cryo-EM was performed on purified complexes for structural determination. (B) Overall cryo-EM map of the ac4C(−1) 80S IC. (C) Zoomed in view of the model fitted tRNAiMet and mRNA interface. (D) Detailed local maps of fitted models focused at the codon:anticodon interface. (E-F) Zoomed in view comparing tRNA t6A(37) interaction with mRNA C(−1) versus ac4C(−1). A strong 2.1 Å hydrogen bond is observed between the C(−1) ribose 2’OH and t6A carboxyl side chain. Acetylation weakens this interaction to 3.7Å through a shift at the ribose. (G) Schematic of molecular interactions between t6A and C versus ac4C.

References

    1. Afonine PV, Grosse-Kunstleve RW, Echols N, Headd JJ, Moriarty NW, Mustyakimov M, Terwilliger TC, Urzhumtsev A, Zwart PH, and Adams PD (2012). Towards automated crystallographic structure refinement with phenix.refine. Acta Crystallogr D Biol Crystallogr 68, 352–367. 10.1107/S0907444912001308. - DOI - PMC - PubMed
    1. Arango D, Sturgill D, Alhusaini N, Dillman AA, Sweet TJ, Hanson G, Hosogane M, Sinclair WR, Nanan KK, Mandler MD, et al. (2018). Acetylation of Cytidine in mRNA Promotes Translation Efficiency. Cell 175, 1872–1886 e1824. 10.1016/j.cell.2018.10.030. - DOI - PMC - PubMed
    1. Arango D, Sturgill D, and Oberdoerffer S (2019). Immunoprecipitation and Sequencing of Acetylated RNA. Bio Protoc 9, e3278. 10.21769/BioProtoc.3278. - DOI - PMC - PubMed
    1. Bartee D, Nance KD, and Meier JL (2022). Site-Specific Synthesis of N(4)-Acetylcytidine in RNA Reveals Physiological Duplex Stabilization. J Am Chem Soc 144, 3487–3496. 10.1021/jacs.1c11985. - DOI - PMC - PubMed
    1. Bray NL, Pimentel H, Melsted P, and Pachter L (2016). Near-optimal probabilistic RNA-seq quantification. Nat Biotechnol 34, 525–527. 10.1038/nbt.3519. - DOI - PubMed

Publication types