

Evaluating maternal exposure to an environmental per and polyfluoroalkyl substances (PFAS) mixture during pregnancy: Adverse maternal and fetoplacental effects in a New Zealand White (NZW) rabbit model
- PMID: 35679923
- PMCID: PMC9374364
- DOI: 10.1016/j.scitotenv.2022.156499
Evaluating maternal exposure to an environmental per and polyfluoroalkyl substances (PFAS) mixture during pregnancy: Adverse maternal and fetoplacental effects in a New Zealand White (NZW) rabbit model
Abstract
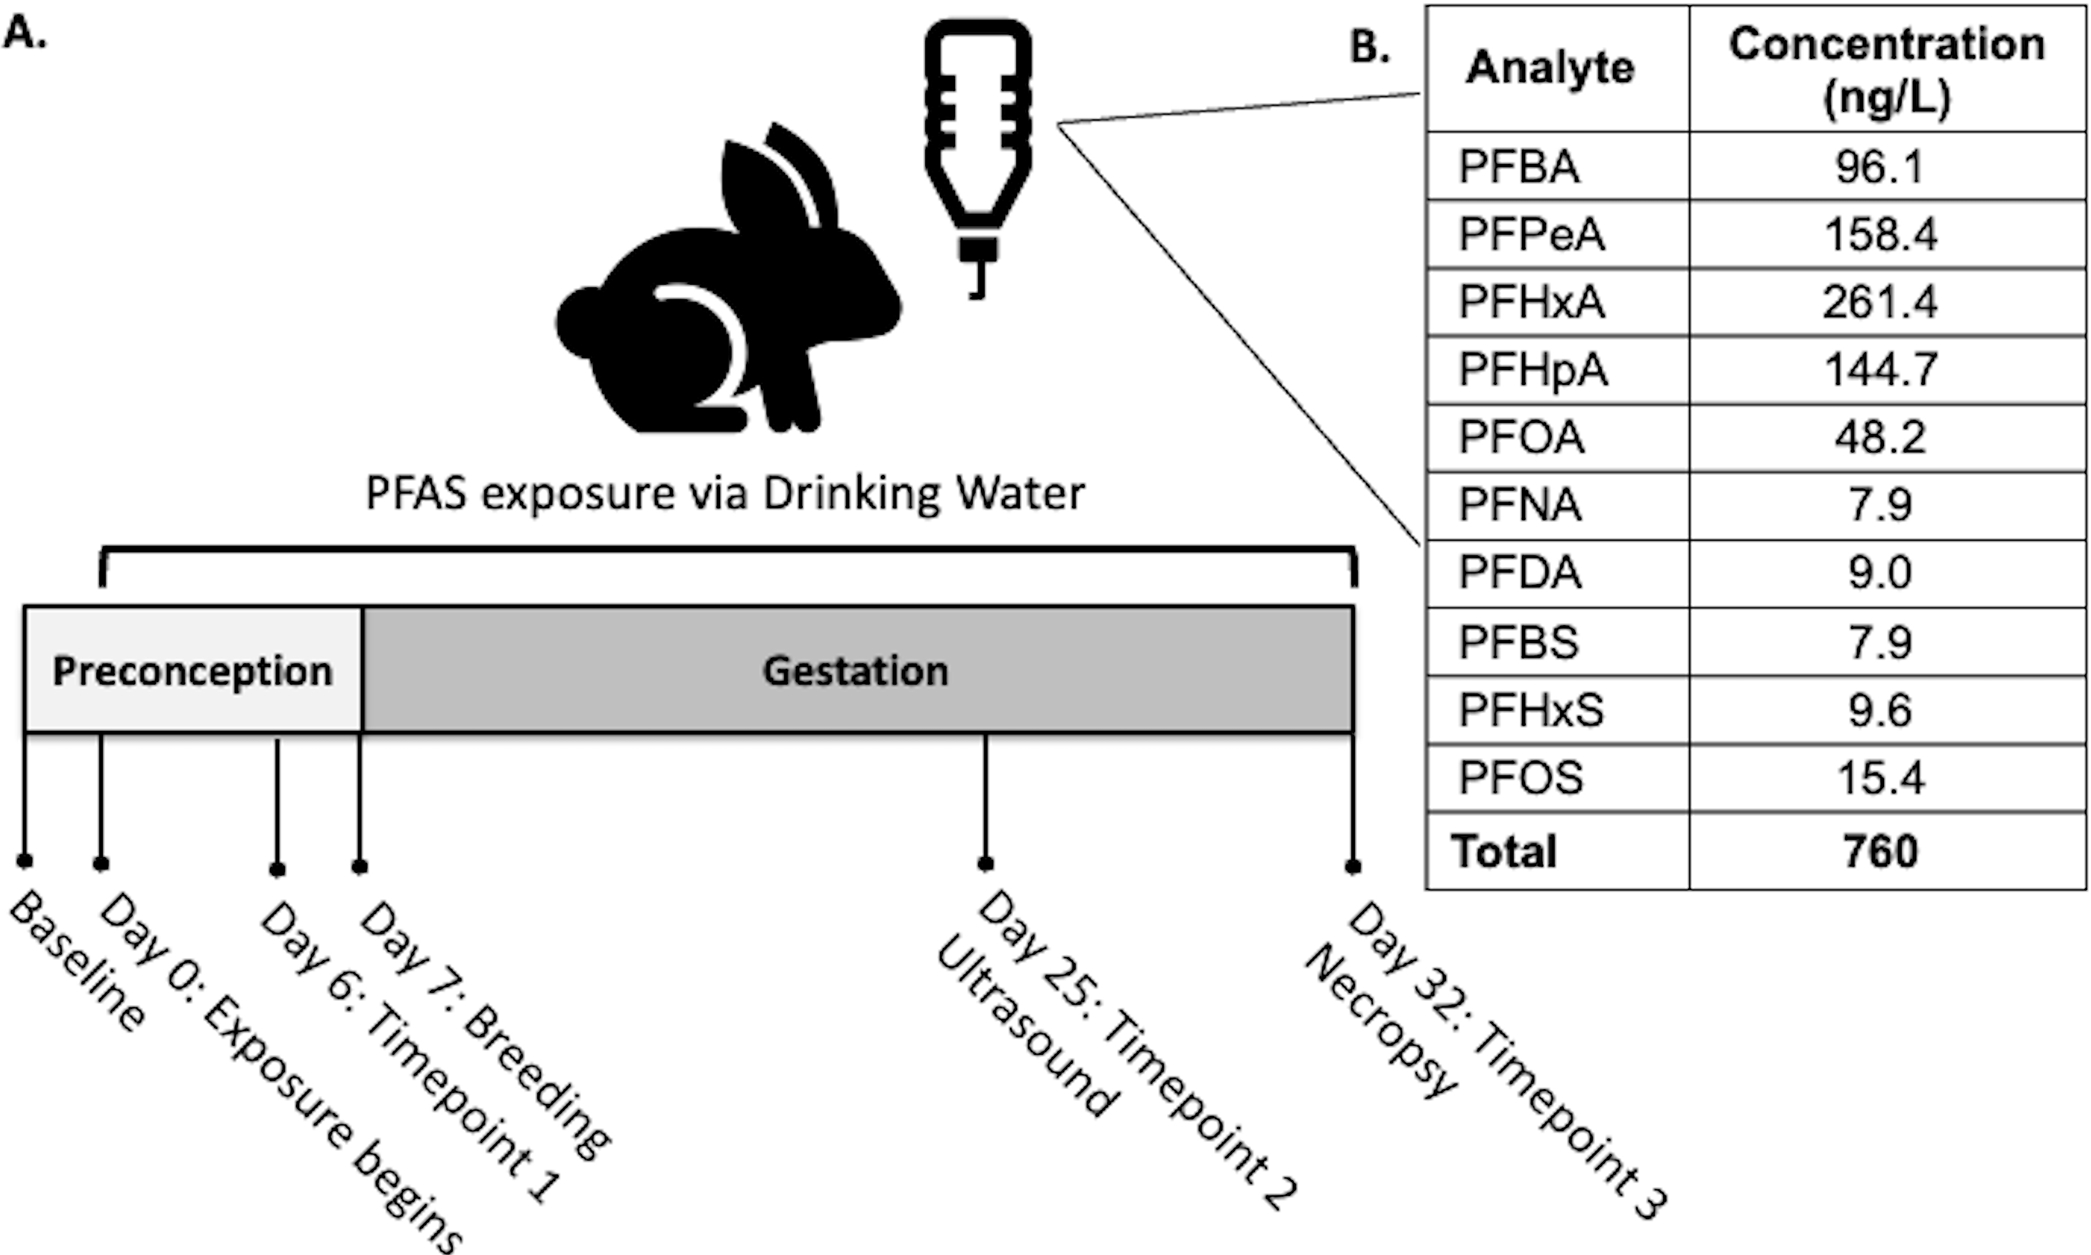
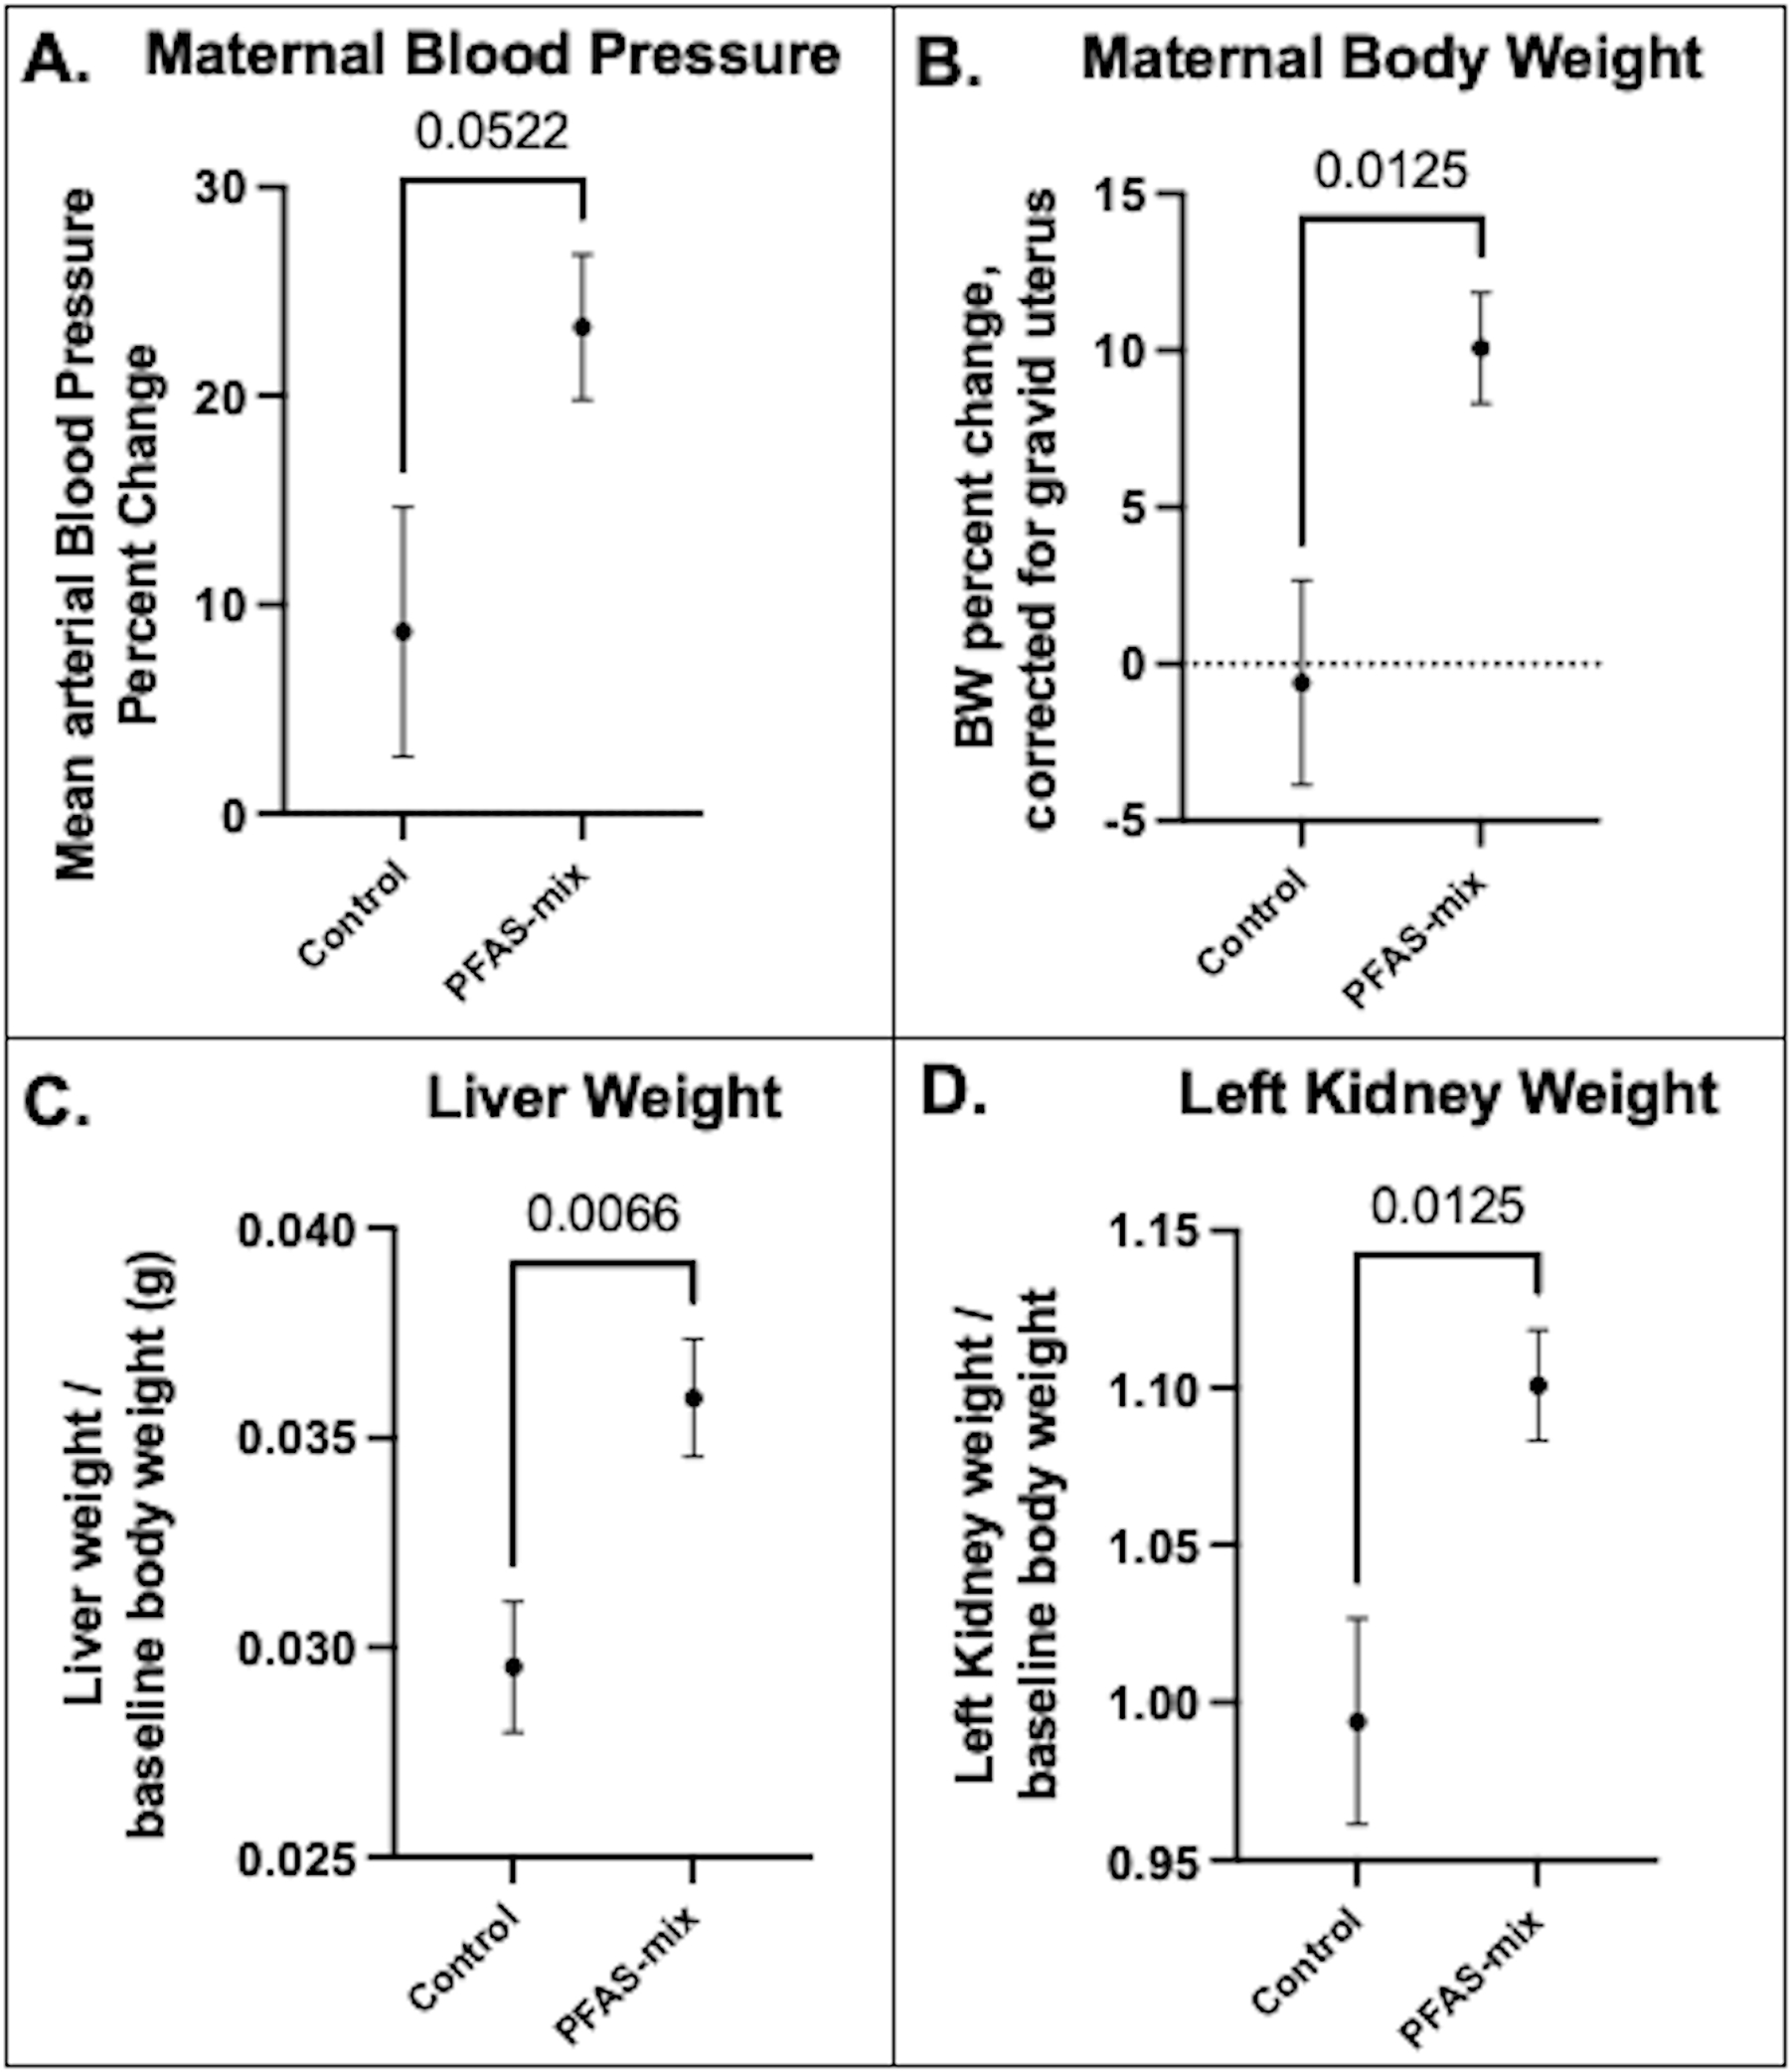
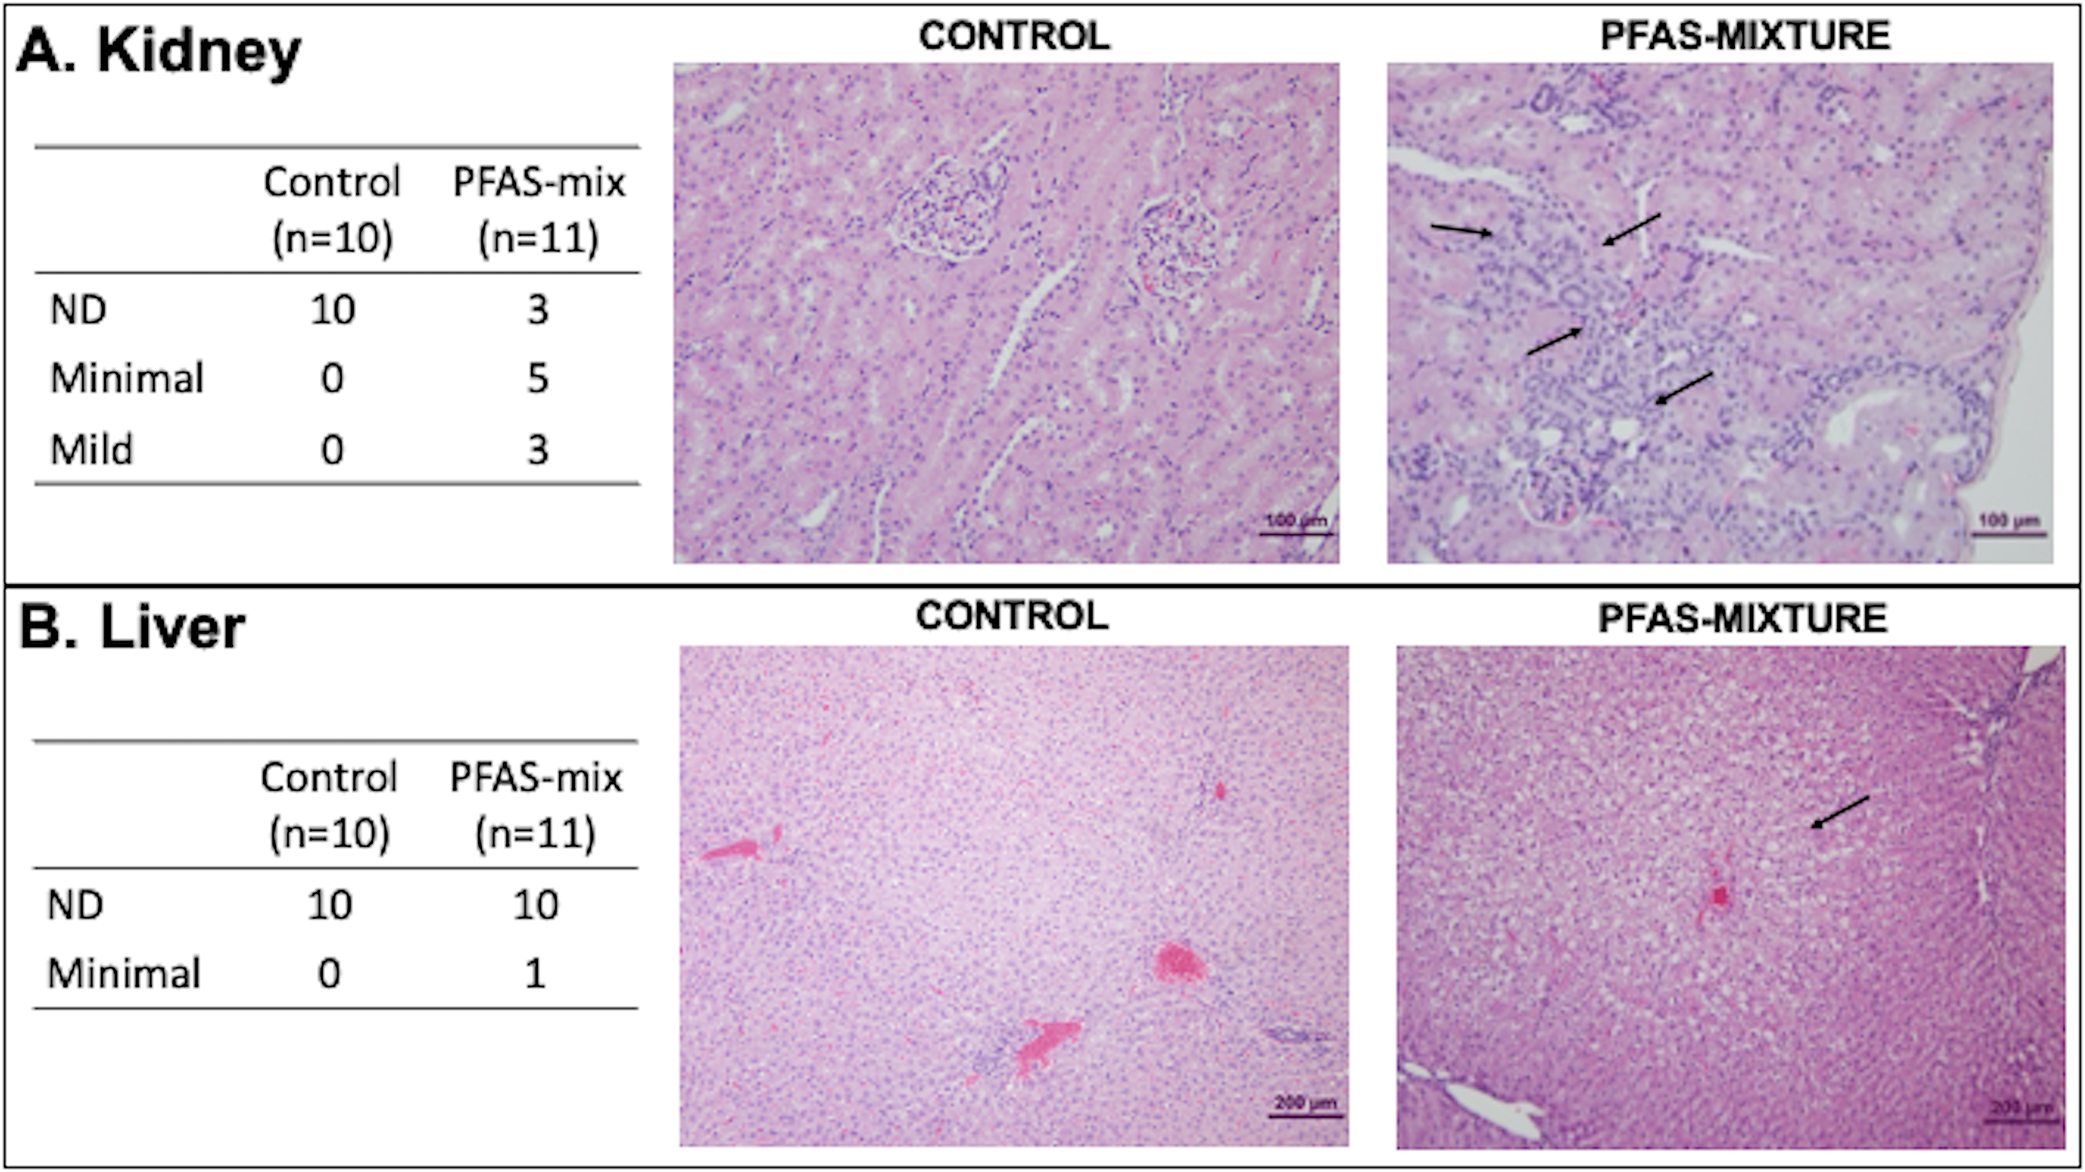
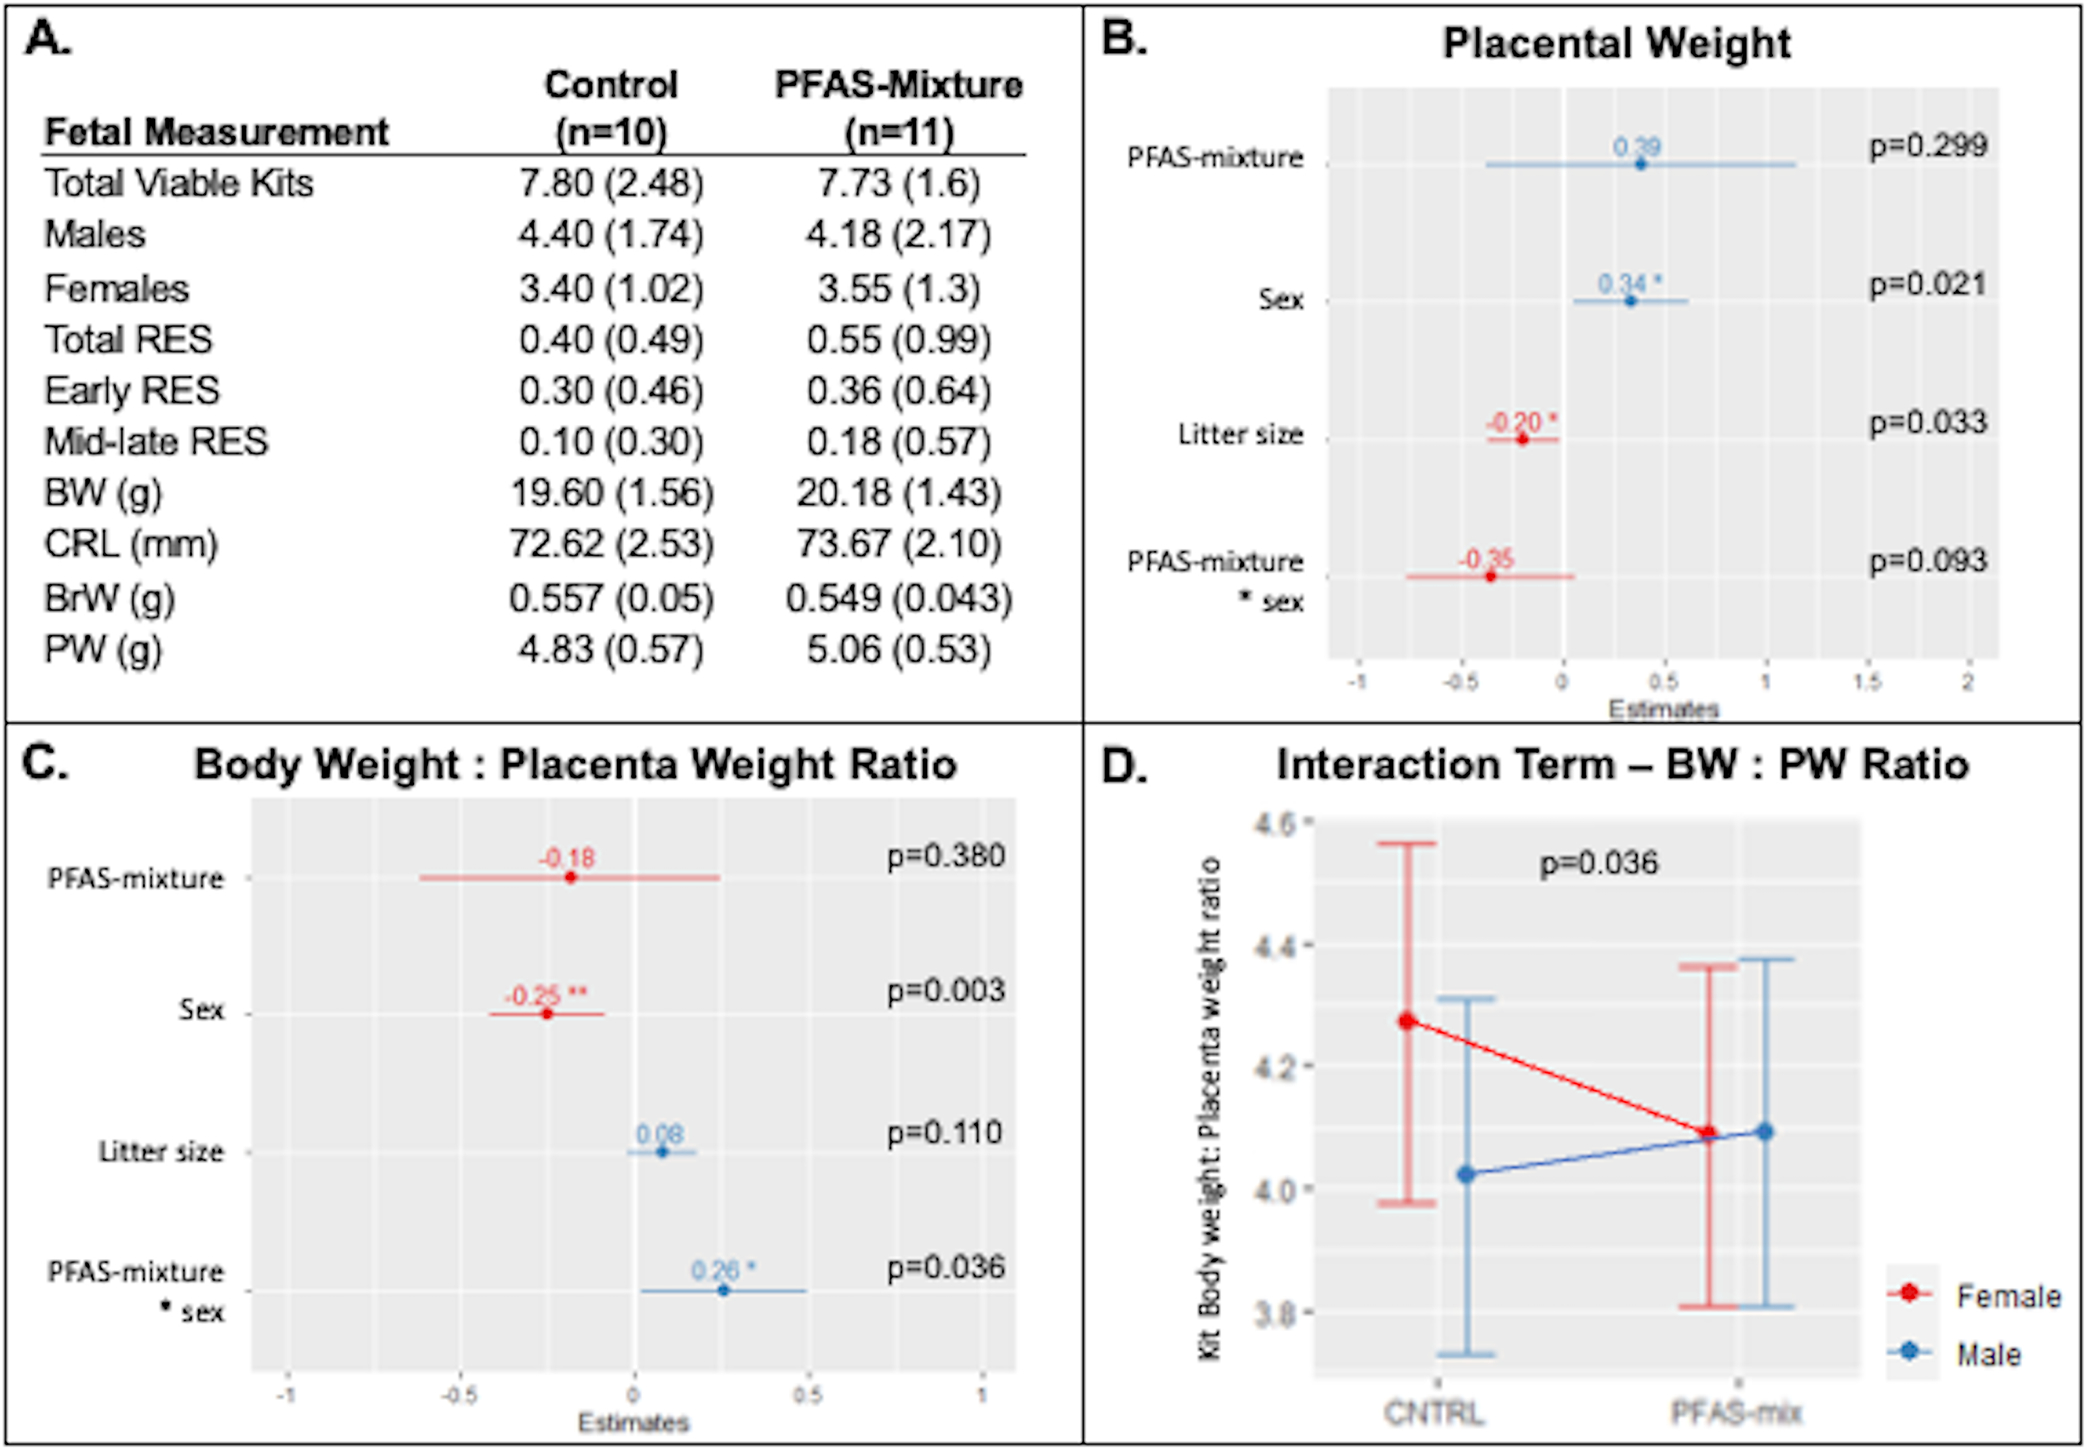
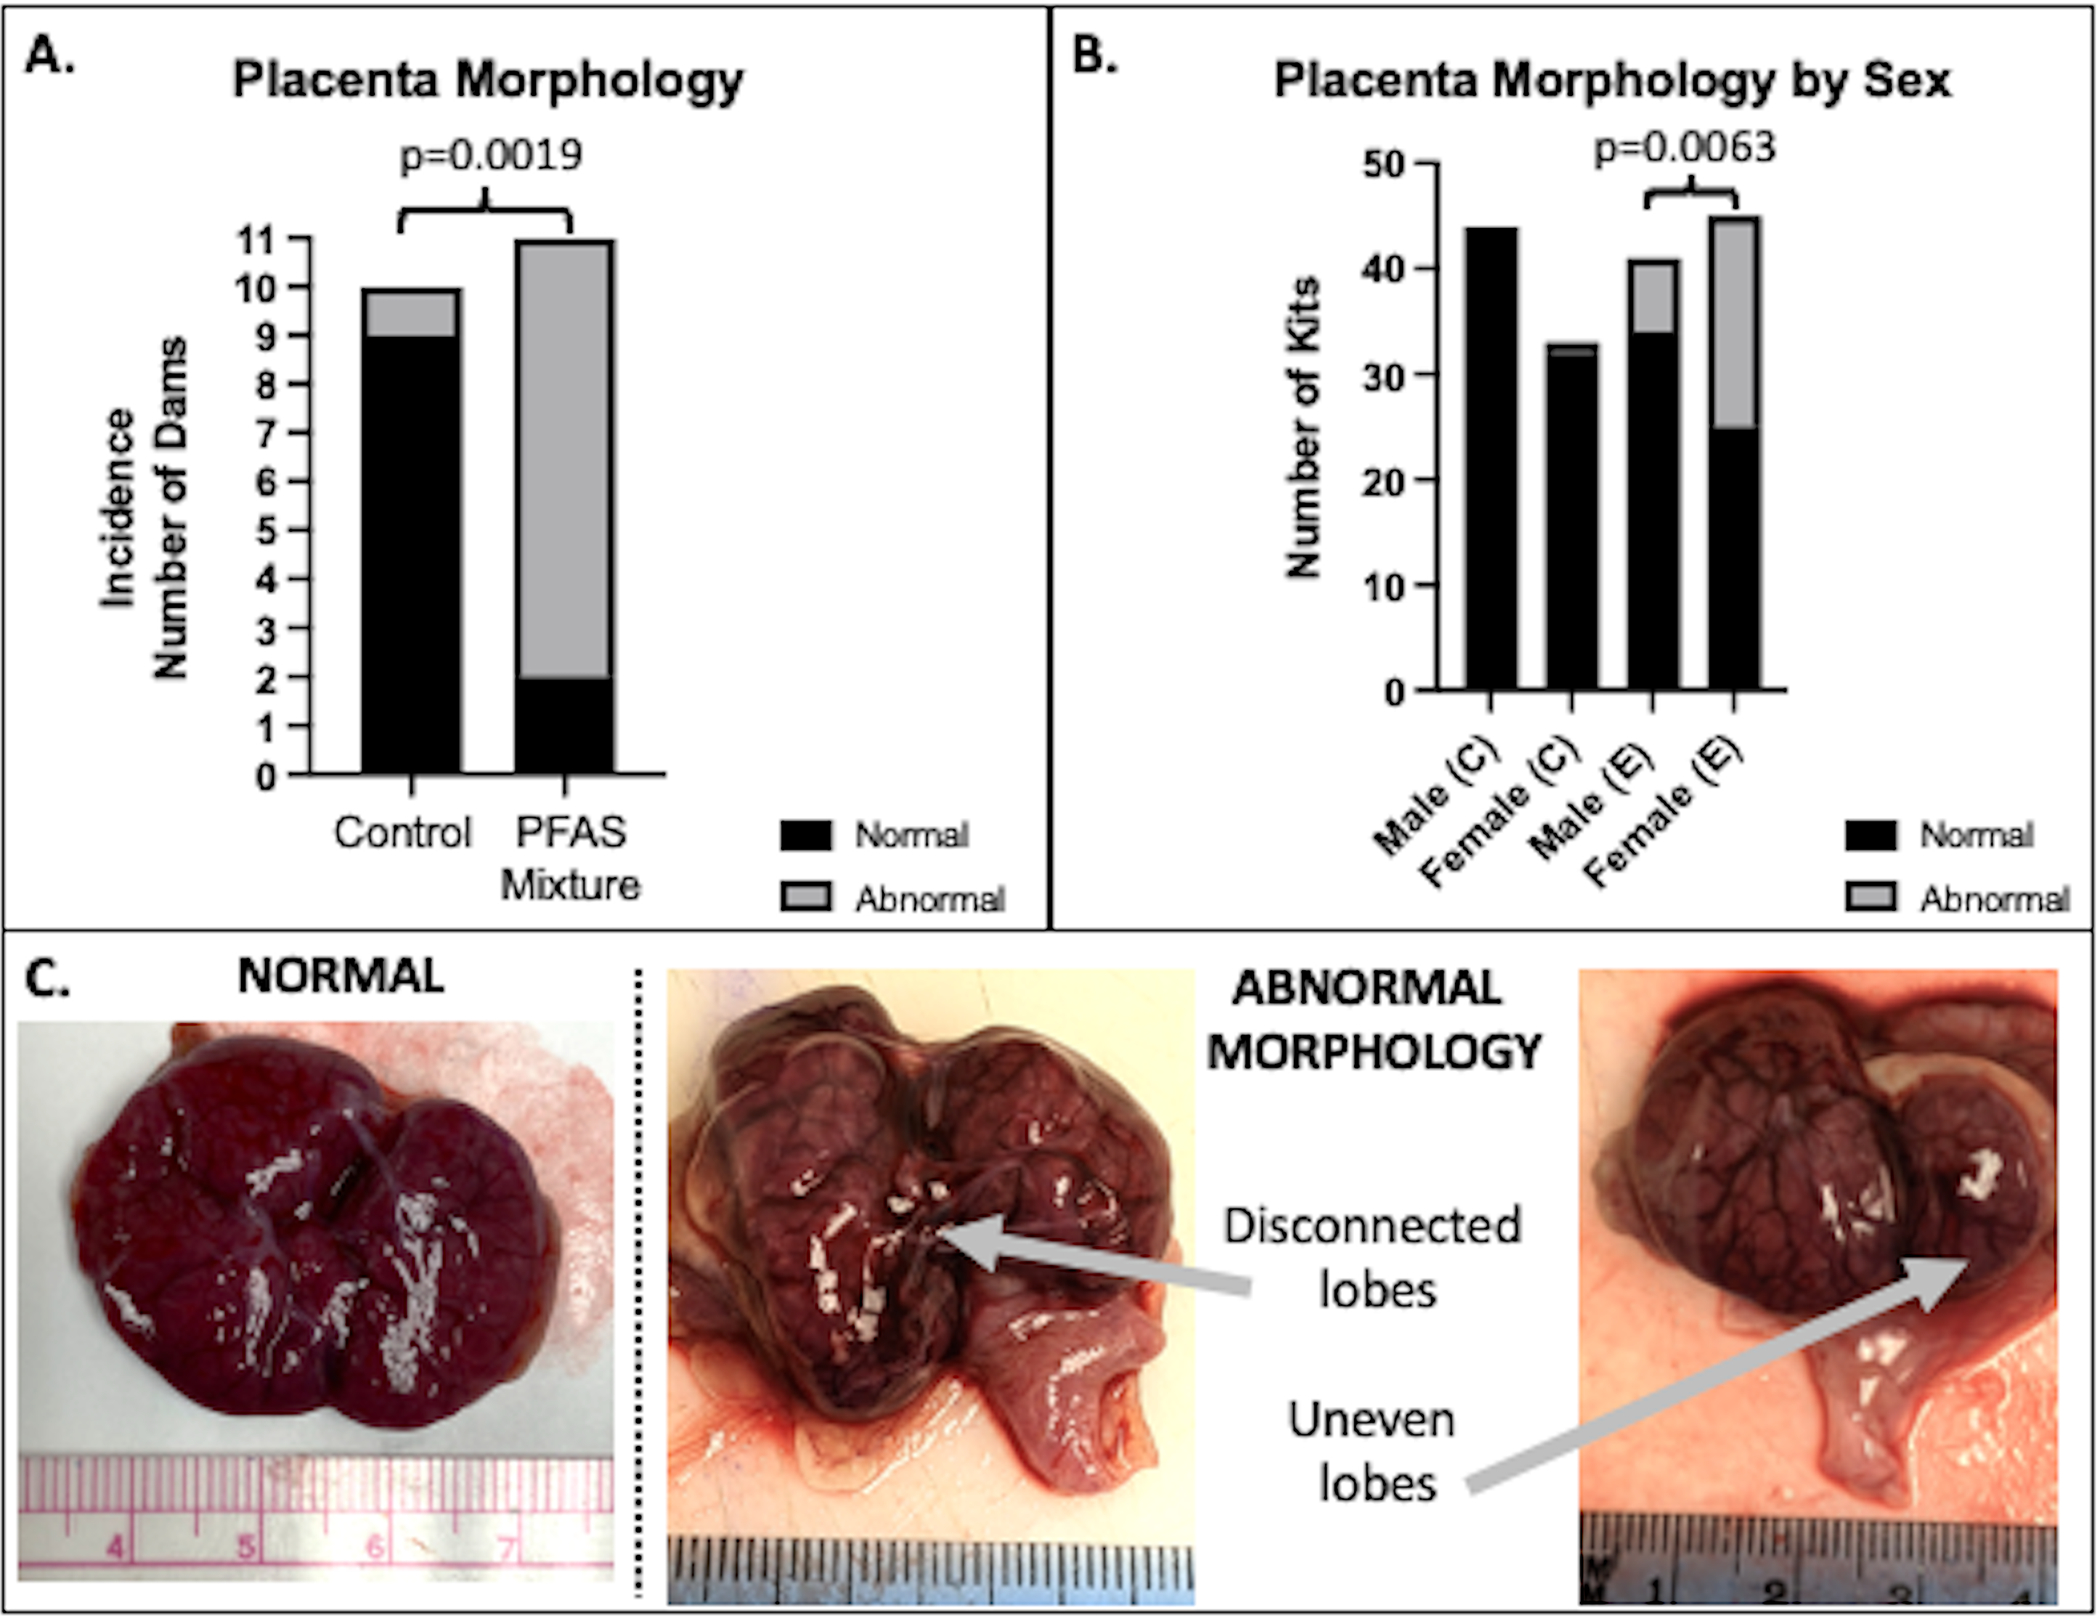
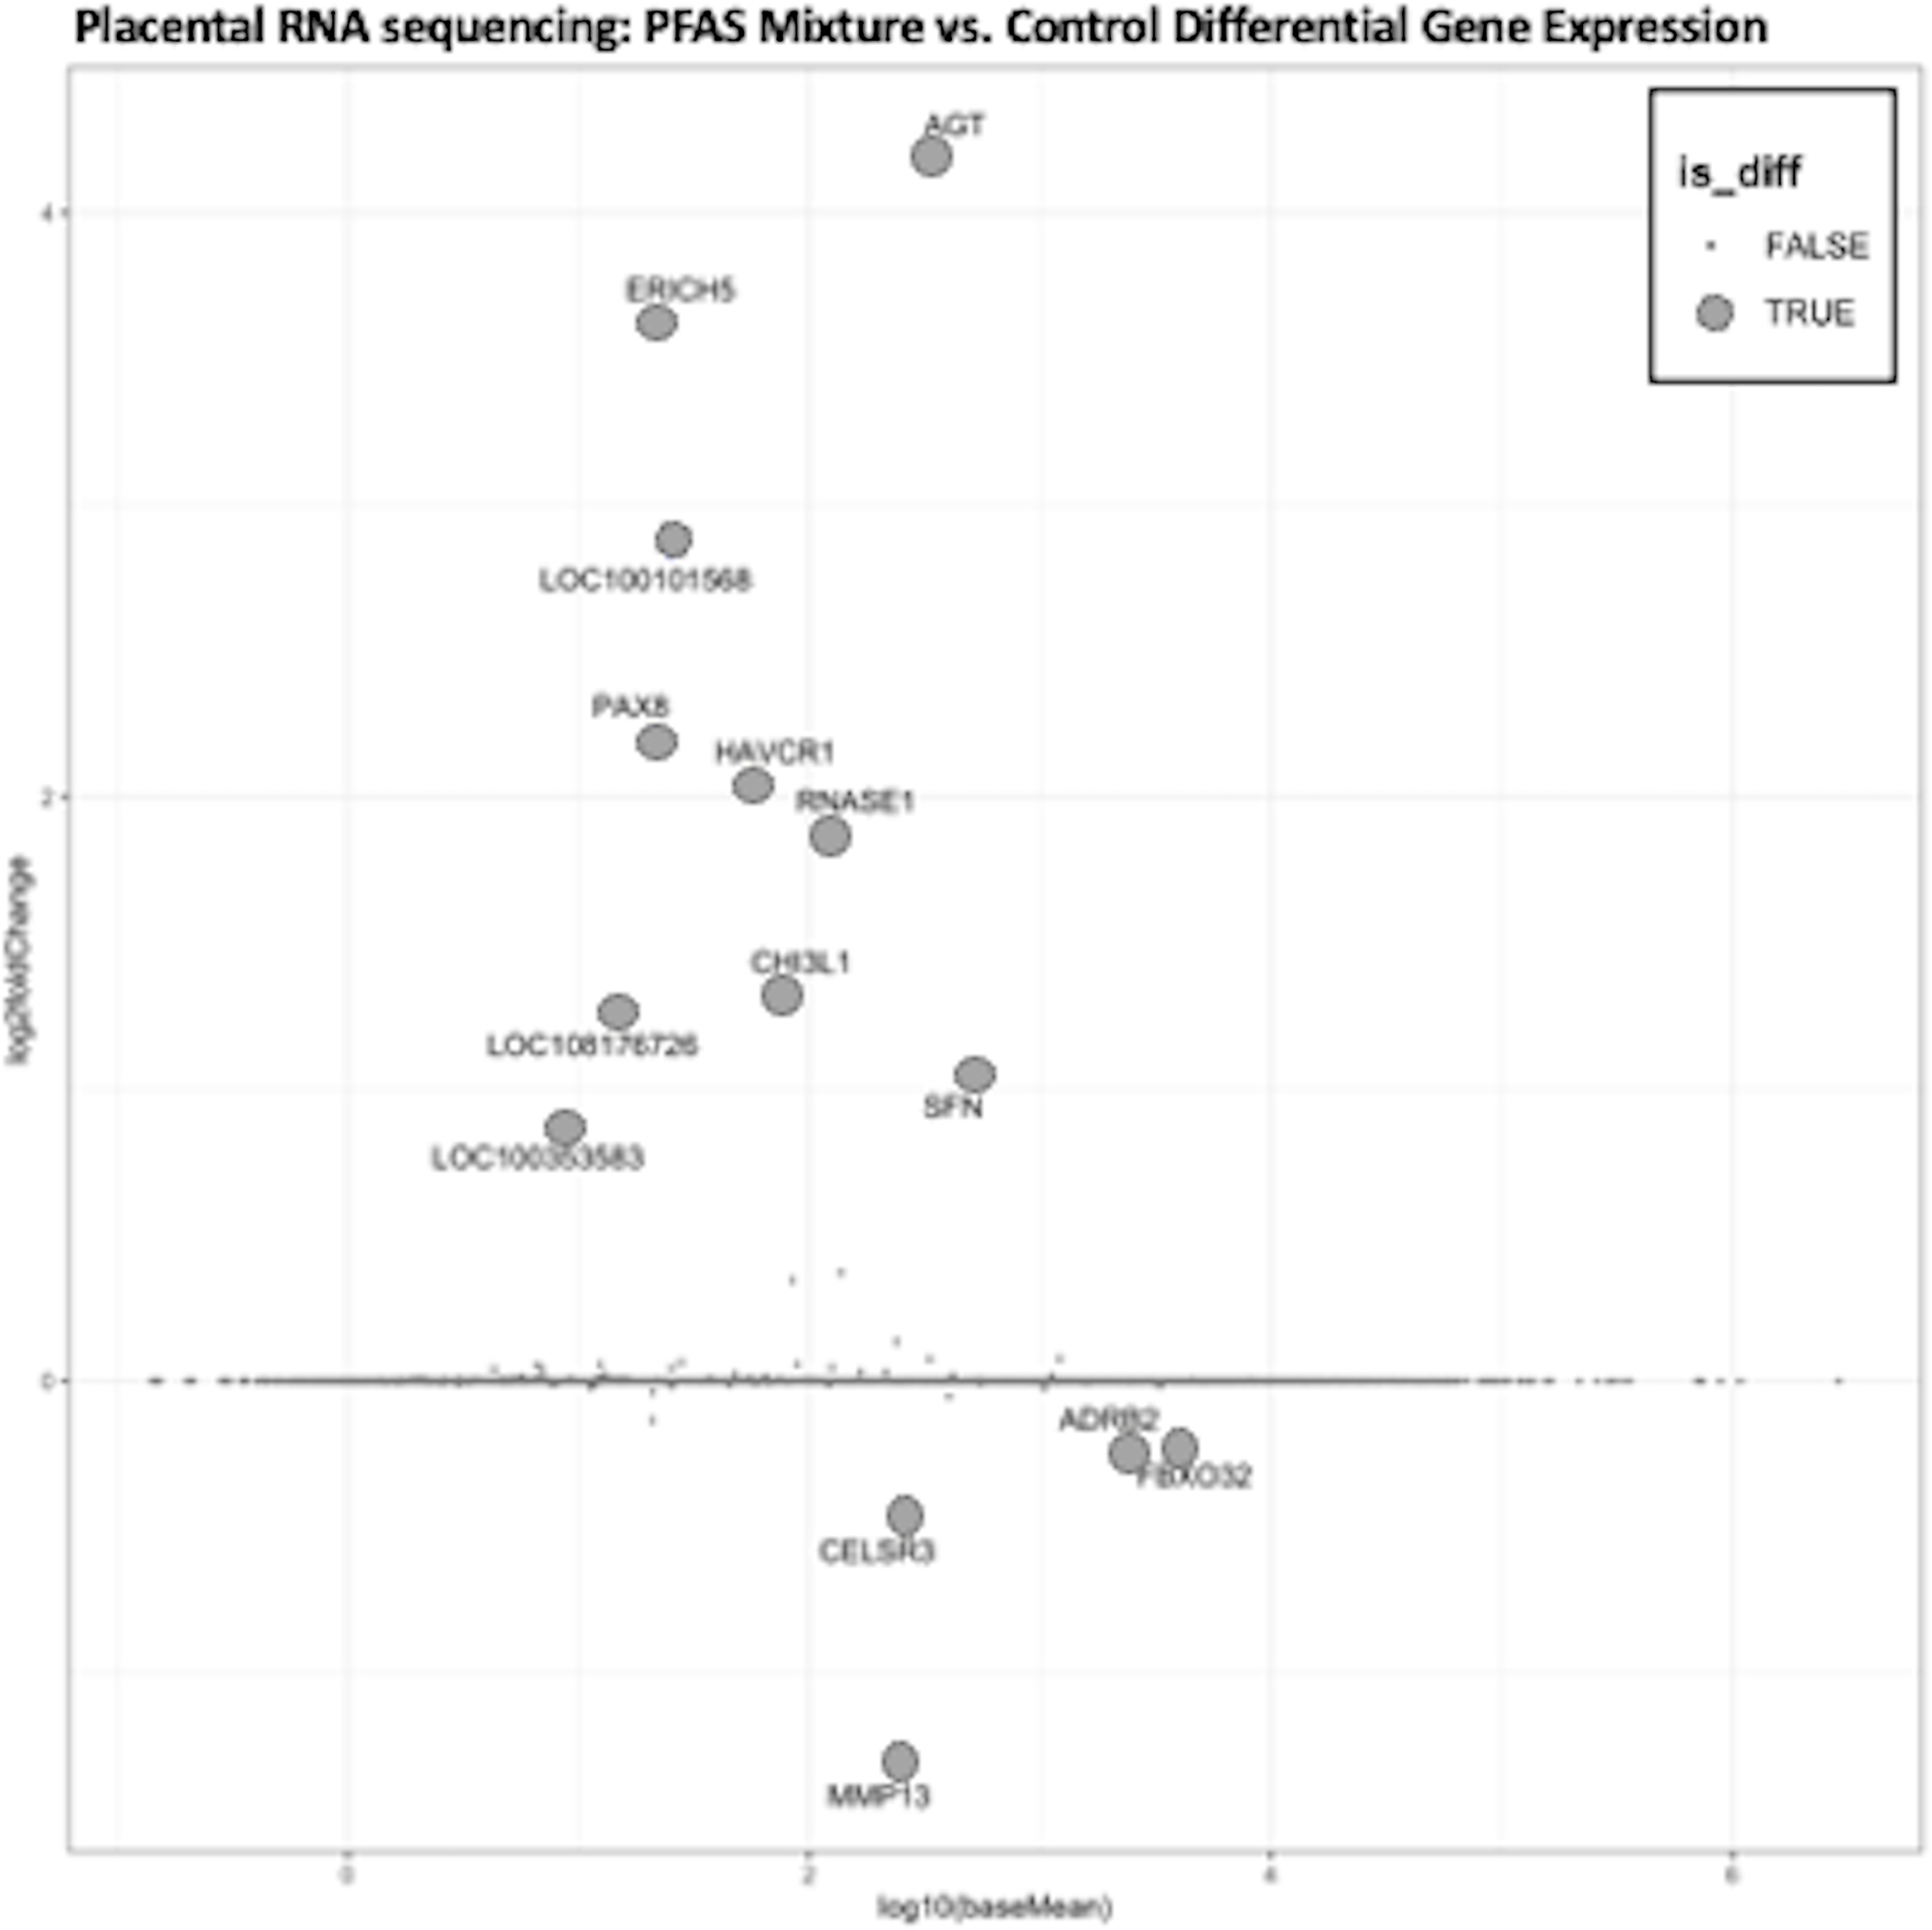
Mixtures of per- and polyfluoroalkyl substances (PFAS) are often found in drinking water, and serum PFAS are detected in up to 99% of the population. However, very little is known about how exposure to mixtures of PFAS affects maternal and fetal health. The aim of this study was to investigate maternal, fetal, and placental outcomes after preconceptional and gestational exposure to an environmentally relevant PFAS mixture in a New Zealand White (NZW) rabbit model. Dams were exposed via drinking water to control (no detectable PFAS) or a PFAS mixture for 32 days. This mixture was formulated with PFAS to resemble levels measured in tap water from Pittsboro, NC (10 PFAS compounds; total PFAS load = 758.6 ng/L). Maternal, fetal, and placental outcomes were evaluated at necropsy. Thyroid hormones were measured in maternal serum and kit blood. Placental gene expression was evaluated by RNAseq and qPCR. PFAS exposure resulted in higher body weight (p = 0.01), liver (p = 0.01) and kidney (p = 0.01) weights, blood pressure (p = 0.05), and BUN:CRE ratio (p = 0.04) in dams, along with microscopic changes in renal cortices. Fetal weight, measures, and histopathology were unchanged, but a significant interaction between dose and sex was detected in the fetal: placental weight ratio (p = 0.036). Placental macroscopic changes were present in PFAS-exposed dams. Dam serum showed lower T4 and a higher T3:T4 ratio, although not statistically significant. RNAseq revealed that 11 of the 14 differentially expressed genes (adj. p < 0.1) are involved in placentation or pregnancy complications. In summary, exposure elicited maternal weight gain and signs of hypertension, renal injury, sex-specific changes in placental response, and differential expression of genes involved in placentation and preeclampsia. Importantly, these are the first results to show adverse maternal and placental effects of an environmentally-relevant PFAS mixture in vivo.
Keywords: PFAS mixture; Per- and polyfluoroalkyl substances (PFAS); Placental and birth outcomes; Rabbit.
Copyright © 2022 Elsevier B.V. All rights reserved.
Conflict of interest statement
Declaration of competing interest The authors declare they have no actual or potential competing financial interests.
Figures
Similar articles
-
Prenatal and perinatal exposure to Per- and polyfluoroalkyl substances (PFAS)-contaminated drinking water impacts offspring neurobehavior and development.Sci Total Environ. 2024 Mar 20;917:170459. doi: 10.1016/j.scitotenv.2024.170459. Epub 2024 Jan 28. Sci Total Environ. 2024. PMID: 38290673 Free PMC article.
-
Maternal exposure to perfluorobutane sulfonate (PFBS) during pregnancy: evidence of adverse maternal and fetoplacental effects in New Zealand White (NZW) rabbits.Toxicol Sci. 2023 Feb 17;191(2):239-252. doi: 10.1093/toxsci/kfac126. Toxicol Sci. 2023. PMID: 36453863 Free PMC article.
-
Associations of paternal and maternal per- and polyfluoroalkyl substances exposure with cord serum reproductive hormones, placental steroidogenic enzyme and birth weight.Chemosphere. 2021 Dec;285:131521. doi: 10.1016/j.chemosphere.2021.131521. Epub 2021 Jul 12. Chemosphere. 2021. PMID: 34273704
-
Early life exposure to per- and polyfluoroalkyl substances (PFAS) and latent health outcomes: A review including the placenta as a target tissue and possible driver of peri- and postnatal effects.Toxicology. 2020 Oct;443:152565. doi: 10.1016/j.tox.2020.152565. Epub 2020 Aug 27. Toxicology. 2020. PMID: 32861749 Free PMC article. Review.
-
Considering environmental exposures to per- and polyfluoroalkyl substances (PFAS) as risk factors for hypertensive disorders of pregnancy.Environ Res. 2021 Jun;197:111113. doi: 10.1016/j.envres.2021.111113. Epub 2021 Apr 3. Environ Res. 2021. PMID: 33823190 Free PMC article. Review.
Cited by
-
Gestational arsenite exposure alters maternal postpartum heart size and induces Ca2+-handling dysregulation in cardiomyocytes.Am J Physiol Heart Circ Physiol. 2025 Mar 1;328(3):H460-H471. doi: 10.1152/ajpheart.00266.2024. Epub 2025 Jan 31. Am J Physiol Heart Circ Physiol. 2025. PMID: 39888327 Free PMC article.
-
Dose additive maternal and offspring effects of oral maternal exposure to a mixture of three PFAS (HFPO-DA, NBP2, PFOS) during pregnancy in the Sprague-Dawley rat.Sci Total Environ. 2023 Sep 20;892:164609. doi: 10.1016/j.scitotenv.2023.164609. Epub 2023 Jun 2. Sci Total Environ. 2023. PMID: 37271399 Free PMC article.
-
PFAS levels in paired drinking water and serum samples collected from an exposed community in Central North Carolina.Sci Total Environ. 2023 Oct 15;895:165091. doi: 10.1016/j.scitotenv.2023.165091. Epub 2023 Jun 23. Sci Total Environ. 2023. PMID: 37355130 Free PMC article.
-
Cumulative maternal and neonatal effects of combined exposure to a mixture of perfluorooctanoic acid (PFOA) and perfluorooctane sulfonic acid (PFOS) during pregnancy in the Sprague-Dawley rat.Environ Int. 2022 Dec;170:107631. doi: 10.1016/j.envint.2022.107631. Epub 2022 Nov 12. Environ Int. 2022. PMID: 36402036 Free PMC article.
-
Prenatal and perinatal exposure to Per- and polyfluoroalkyl substances (PFAS)-contaminated drinking water impacts offspring neurobehavior and development.Sci Total Environ. 2024 Mar 20;917:170459. doi: 10.1016/j.scitotenv.2024.170459. Epub 2024 Jan 28. Sci Total Environ. 2024. PMID: 38290673 Free PMC article.
References
-
- Ashour G, & Abdel-Rahman SM (2019). Hormonal Changes in Relation to Productivity of Pregnant Rabbit Does. World Veterinary Journal(9(1)), 37–45.
-
- ATSDR. (2021). Toxicological Profile for Perfluoroalkyls. Agency for Toxic Substances and Disease Registry; Retrieved from https://www.atsdr.cdc.gov/toxprofiles/tp200.pdf - PubMed
-
- ATSDR, A. f. T. S. a. D. R. (2019). PFAS Exposure Assessments. https://www.atsdr.cdc.gov/pfas/PFAS-Exposure-Assessments.html
MeSH terms
Substances
Grants and funding
LinkOut - more resources
Full Text Sources
Medical
Research Materials
Miscellaneous
