. 2022 Aug 11;81(9):1214-1223.
doi: 10.1136/annrheumdis-2022-222370.

Interferon-α-mediated therapeutic resistance in early rheumatoid arthritis implicates epigenetic reprogramming

Collaborators, Affiliations

Interferon-α-mediated therapeutic resistance in early rheumatoid arthritis implicates epigenetic reprogramming

Faye A H Cooles et al. Ann Rheum Dis. .

Abstract

Objectives: An interferon (IFN) gene signature (IGS) is present in approximately 50% of early, treatment naive rheumatoid arthritis (eRA) patients where it has been shown to negatively impact initial response to treatment. We wished to validate this effect and explore potential mechanisms of action.

Methods: In a multicentre inception cohort of eRA patients (n=191), we examined the whole blood IGS (MxA, IFI44L, OAS1, IFI6, ISG15) with reference to circulating IFN proteins, clinical outcomes and epigenetic influences on circulating CD19+ B and CD4+ T lymphocytes.

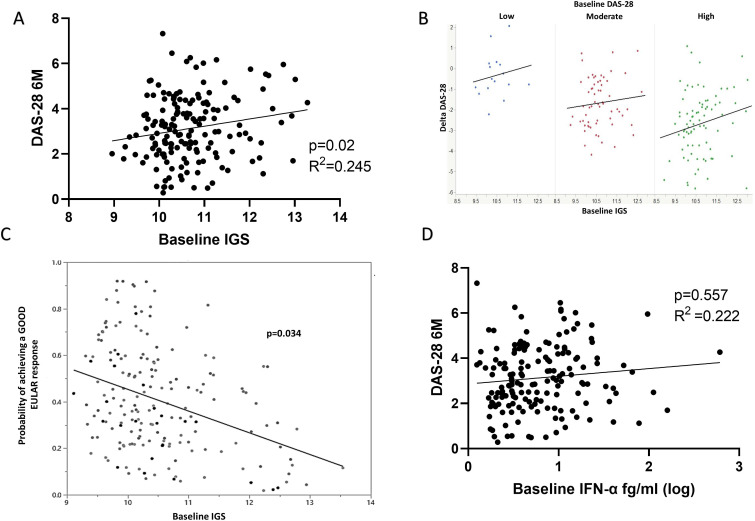
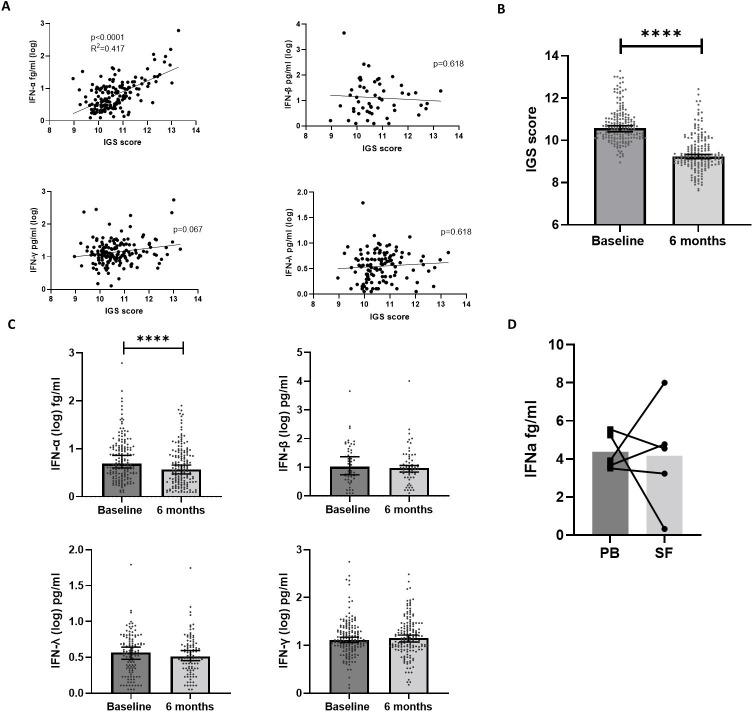
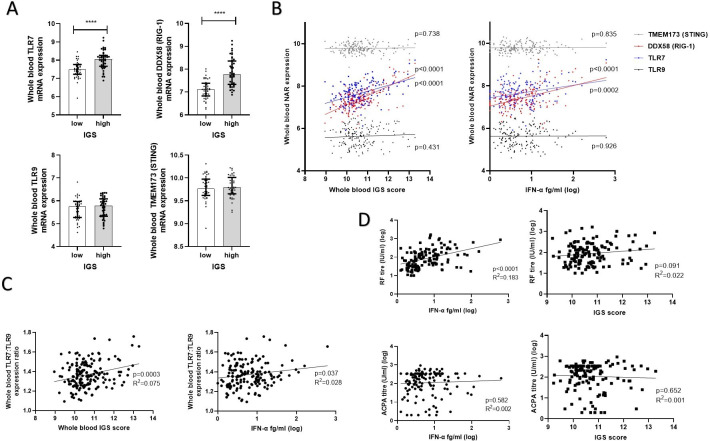
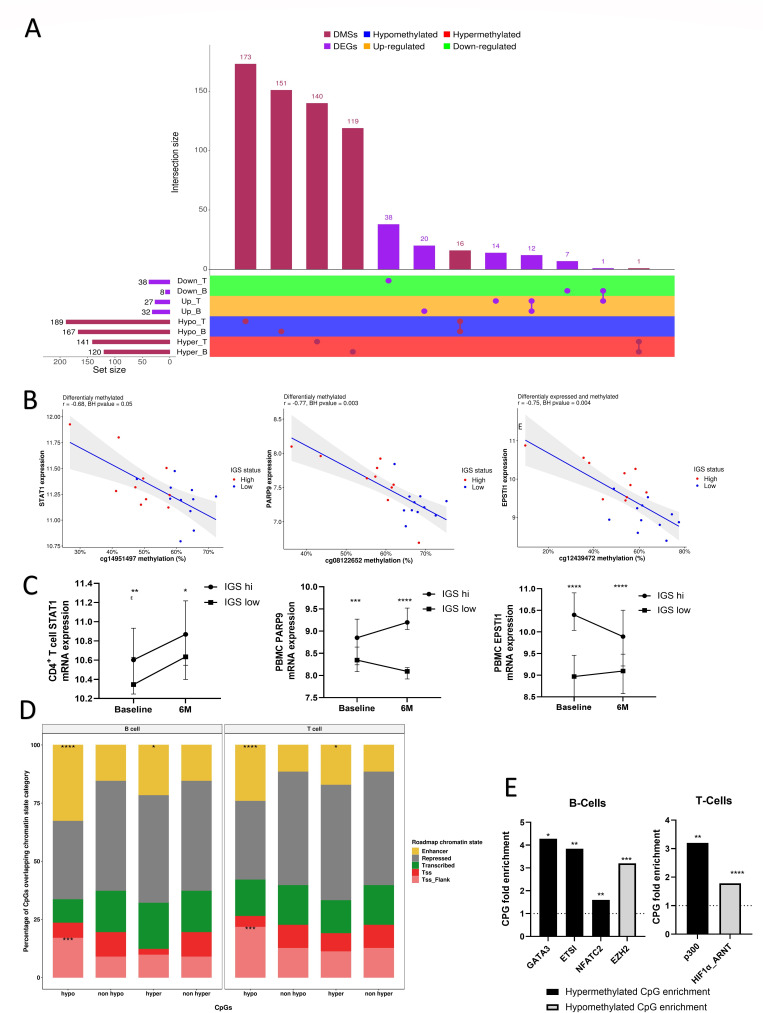
Results: We reproduced our previous findings demonstrating a raised baseline IGS. We additionally showed, for the first time, that the IGS in eRA reflects circulating IFN-α protein. Paired longitudinal analysis demonstrated a significant reduction between baseline and 6-month IGS and IFN-α levels (p<0.0001 for both). Despite this fall, a raised baseline IGS predicted worse 6-month clinical outcomes such as increased disease activity score (DAS-28, p=0.025) and lower likelihood of a good EULAR clinical response (p=0.034), which was independent of other conventional predictors of disease activity and clinical response. Molecular analysis of CD4+ T cells and CD19+ B cells demonstrated differentially methylated CPG sites and dysregulated expression of disease relevant genes, including PARP9, STAT1, and EPSTI1, associated with baseline IGS/IFNα levels. Differentially methylated CPG sites implicated altered transcription factor binding in B cells (GATA3, ETSI, NFATC2, EZH2) and T cells (p300, HIF1α).

Conclusions: Our data suggest that, in eRA, IFN-α can cause a sustained, epigenetically mediated, pathogenic increase in lymphocyte activation and proliferation, and that the IGS is, therefore, a robust prognostic biomarker. Its persistent harmful effects provide a rationale for the initial therapeutic targeting of IFN-α in selected patients with eRA.

Keywords: antirheumatic agents; arthritis, rheumatoid; immune system diseases; inflammation.


Conflict of interest statement

Competing interests: JDI discloses research grants from Pfizer, Janssen and GSK; conference support from Eli Lilly and Gilead; speaker/consulting fees from AbbVie, BMS, Gilead, Roche and UCB. FAHC discloses speaker fees from AstraZeneca.The remaining authors have no competing interests.

Figures

Figure 1
Figure 1
The IGS, circulating IFN-α and clinical outcomes. Early drug naïve RA patients (eRA, n=165) had their IGS calculated from whole blood microarray expression of IFI6, OAS1, MxA, ISG15, IFI44L and the impact of this baseline IGS on 6 month clinical outcomes sought. (A) Linear regression between baseline IGS and DAS-28 at 6 months (6M), p=0.02, R2=0.245. (B) Graphical depiction of baseline IGS consistently impacting on change in DAS-28 at 6 months (Delta DAS-28) regardless of baseline DAS-28 (p=0.017, multivariable regression). Blue dots represent patients with baseline low DAS-28(<3.1), red moderate DAS-28 (3.2–5.1) and green high DAS-28 (>5.1). A negative Delta DAS-28 (Y axis) denotes a fall in DAS-28 and therefore response to therapy. (C) Relationship between the probability of achieving a good EULAR response at 6 months and baseline IGS. Nominal logistic regression, age, sex, DMARD, baseline DAS-28 and glucocorticoid administration corrected, p=0.034. (D) Linear regression between baseline IFN-α and DAS-28 at 6 months (6M), p=0.557, R2=0.222. DAS-28, disease activity score; DMARDS, disease-modifying antirheumatic drugs; IFN, interferon; IGS, gene signature; RA, rheumatoid arthritis.
Figure 2
Figure 2
Circulating IFN-I, -II, –III, the IGS and longitudinal expression. (A) Linear regression was performed between the IGS and circulating IFN-α (n=163, p<0.0001, R2=0.29), IFN-β (n=53, p=0.817, R2=0.001), IFN-γ (n=164, p=0.067, R2=0.034), IFN-λ (n=117, p=0.345, R2=0.007). (B) Paired IGS scores between baseline and 6 months in eRA (n=165). Median values are depicted with 95% CIs and statistical analysis using Wilcoxon signed rank test performed on the differences between baseline and 6 months. (C) Comparisons between baseline and 6 month circulating levels of IFN-α, IFN-β, IFN-γ and IFN-λ. Median values are depicted with 95% CIs and statistical analysis using Wilcoxon signed rank test performed on the differences between baseline and 6 months. (D) Comparison of circulating peripheral blood (PB) IFN-α and synovial fluid (SF) IFN-α from five patients with RA, four of whom had established RA and one who had early RA, Wilcoxon signed rank test demonstrated no significant difference. Median values are depicted with paired samples demonstrated. ****p<0.0001. IFN, interferon; IGS, gene signature; RA, rheumatoid arthritis.
Figure 3
Figure 3
IFNs, signalling pathways and autoantibody titres. Whole blood expression of nucleic acid receptors (NARs) was examined in early RA TACERA cohort with respect to IFN-α/the IGS. (A) Expression of surface and cytosolic nucleic acid receptors, TLR7, TLR9 DDX58 (RIG-1) and TMEM173 (STING) were examined between IGS high and low patients, n=43 in each cohort. Median values with interquartile ranges are shown. Mann-Whitney U tests were performed. (B) Linear regression between the whole blood IGS or circulating IFN-α and whole blood mRNA expression of TLR7, TLR9 DDX58 (RIG-1) and TMEM173 (STING), n=164. P values are depicted in the figure. (C) Linear regression between whole blood ratio of TLR7: TLR9 mRNA expression and the whole blood IGS score or circulating IFN-α (fg/ml) in 164 eRA patients. (D) Linear regression comparing circulating IFN-α and RF and ACPA titres in seropositive eRA patients (n=132). ****p<0.0001. ACPA, anticitrullinated protein/peptide antibody; eRA, early rheumatoid arthritis; IFN, interferon; IGS, gene signature.
Figure 4
Figure 4
Differential methylation and expression of pathophysiologically relevant genes in eRA according to IGS. CD4+ T cells and CD19+ B cells were isolated from eRA patients (NEAC cohort) and their cell-specific transcriptome and methylome interrogated according to IGS status. (A) Upset plot of differentially methylated sites (DMSs) and differentially expressed genes (DEGs) between IGS high and low early CD19+ B and CD4+ T cells and arranges the co-occurring variables into sets and with a bar chart of their frequency. The horizontal bar graph at the bottom left shows the total number of DEGs/DMSs that are altered in each cell subset between IGS high and IGS low cohorts. Joined red/purples circles to the right of these bar graphs indicate the same DEGs/DMSs were common to the IGS high/IGS low comparisons shown at the left. The vertical bar graph at the top quantitates the number of DEGs/DMSs with similar expression differences in the comparisons. ‘Up’ and ‘Down’ indicate increased expression or reduced expression in the IGS cohort respectively. (B) Scatterplots showing significant correlations (Benjamini-Hochberg (BH) adjusted p value (BHpval) <0.05) between gene expression and DNA methylation of exemplar genes in B and T cells of IGS high and low RA patients. R: Pearson correlation coefficient. (C) Baseline and 6 month (6M) expression of CD4+ T cell STAT1 and peripheral blood mononuclear cell (PBMC) PARP9 and EPSTI1 in IGS high and IGS low patients (n=41 for each) in a separate eRA cohort (RA-MAP TACERA). Median and error bars denoting 95% CI depicted. Mann-Whitney U tests performed between IGS high and IGS low cohorts at each time point. (D) Stacked bar plots indicating the relative distribution of the differentially methylated CPGs (DMS) between IGS high/low eRA patients as previously identified according to their chromatin state annotations. Chromatin states enrichments at DMSs that are hyper- or hypo-methylated in IGS high compared with IGS low RA patients are indicated for both cell types (Fisher’s exact tests) along with standard expression for comparison. TSS: transcription start site; Tss_Flank: flanking a TSS. (E) Exemplar ENCODE and JASPAR transcription factor binding sites (TFBSs) that are significantly enriched (Fisher’s exact test p<0.05) at CD4+ T and CD19+ B cell CPG sites detected as hyper-methylated or hypo-methylated in IGS high RA patients. CPG fold enrichment is displayed. *p<0.05; **p<0.01; ***p<0.001; ****p<0.0001. eRA, early rheumatoid arthritis; IGS, gene signature; NEAC, Newcastle Early Arthritis Clinic.

References

    1. Muskardin TLW, Niewold TB. Type I interferon in rheumatic diseases. Nat Rev Rheumatol 2018;14:214–28. 10.1038/nrrheum.2018.31 - DOI - PMC - PubMed
    1. Lind NA, Rael VE, Pestal K, et al. Regulation of the nucleic acid-sensing Toll-like receptors. Nat Rev Immunol 2022;22:224–35. 10.1038/s41577-021-00577-0 - DOI - PMC - PubMed
    1. Cooles FAH, Isaacs JD. The interferon gene signature as a clinically relevant biomarker in autoimmune rheumatic disease. Lancet Rheumatol 2022;4:e61–72. 10.1016/S2665-9913(21)00254-X - DOI - PubMed
    1. de Jong TD, Sellam J, Agca R, et al. A multi-parameter response prediction model for rituximab in rheumatoid arthritis. Joint Bone Spine 2018;85:219–26. 10.1016/j.jbspin.2017.02.015 - DOI - PubMed
    1. de Jong TD, Snoek T, Mantel E, et al. Dynamics of the type I interferon response during immunosuppressive therapy in rheumatoid arthritis. Front Immunol 2019;10:902. 10.3389/fimmu.2019.00902 - DOI - PMC - PubMed