. 2022 Aug 27;145(8):2742-2754.
doi: 10.1093/brain/awac088.

Cervical lymph nodes and ovarian teratomas as germinal centres in NMDA receptor-antibody encephalitis

Affiliations

Cervical lymph nodes and ovarian teratomas as germinal centres in NMDA receptor-antibody encephalitis

Adam Al-Diwani et al. Brain. .

Abstract

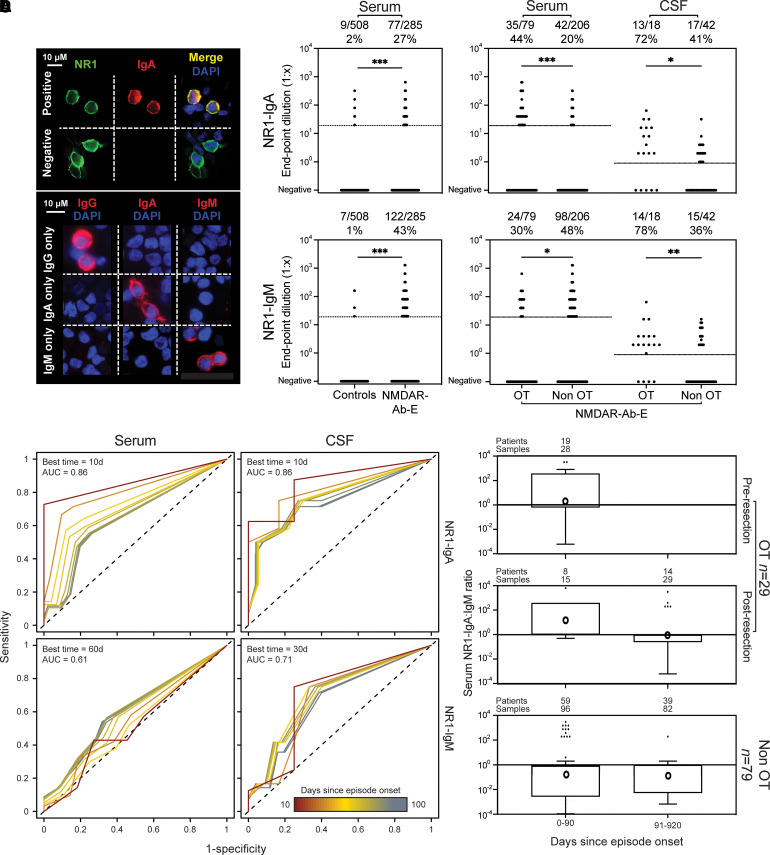
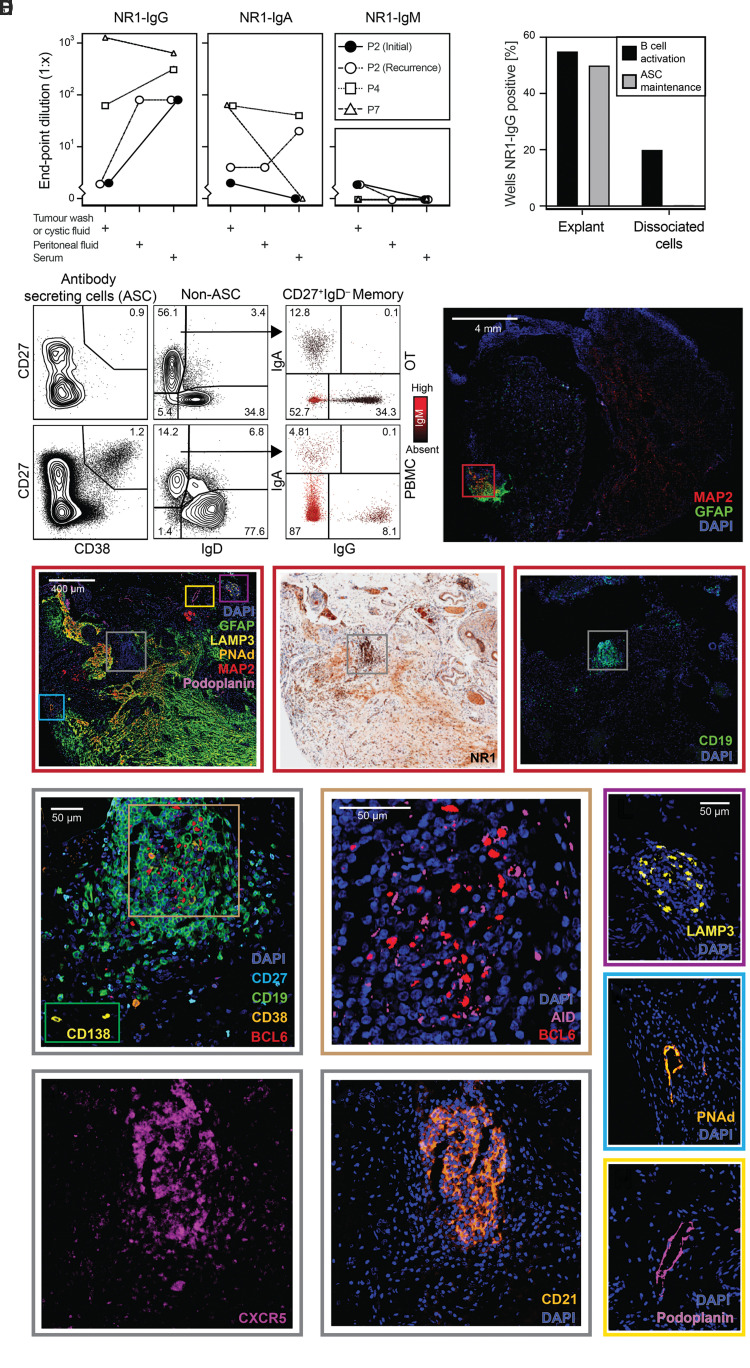
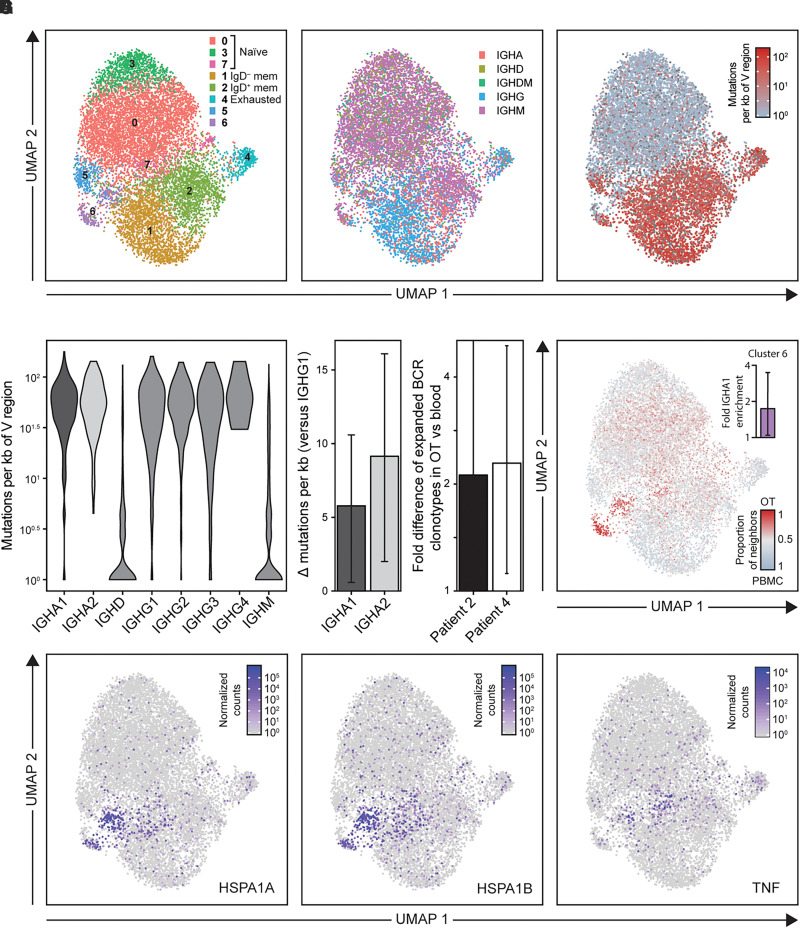
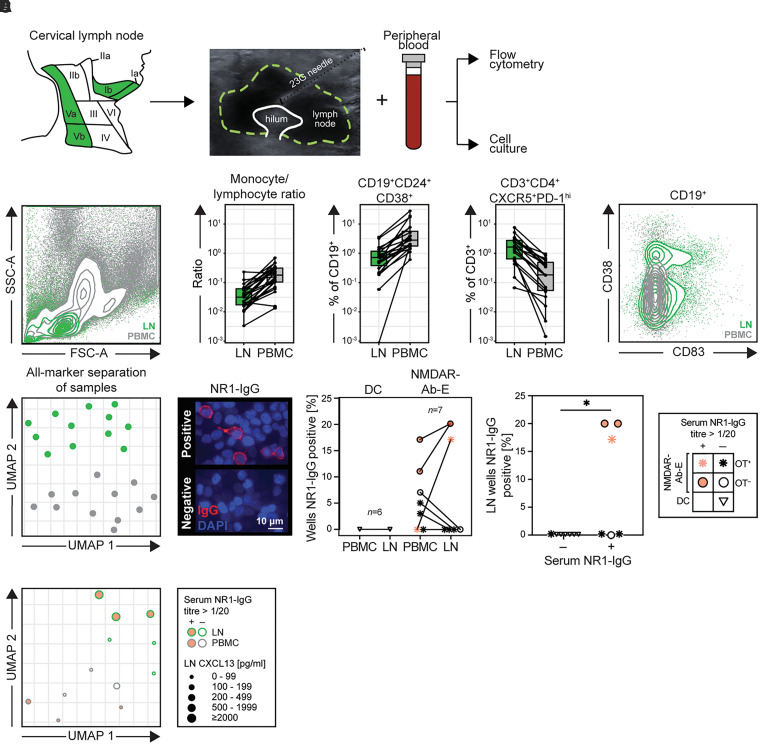
Autoantibodies against the extracellular domain of the N-methyl-d-aspartate receptor (NMDAR) NR1 subunit cause a severe and common form of encephalitis. To better understand their generation, we aimed to characterize and identify human germinal centres actively participating in NMDAR-specific autoimmunization by sampling patient blood, CSF, ovarian teratoma tissue and, directly from the putative site of human CNS lymphatic drainage, cervical lymph nodes. From serum, both NR1-IgA and NR1-IgM were detected more frequently in NMDAR-antibody encephalitis patients versus controls (both P < 0.0001). Within patients, ovarian teratoma status was associated with a higher frequency of NR1-IgA positivity in serum (OR = 3.1; P < 0.0001) and CSF (OR = 3.8, P = 0.047), particularly early in disease and before ovarian teratoma resection. Consistent with this immunoglobulin class bias, ovarian teratoma samples showed intratumoral production of both NR1-IgG and NR1-IgA and, by single cell RNA sequencing, contained expanded highly-mutated IgA clones with an ovarian teratoma-restricted B cell population. Multiplex histology suggested tertiary lymphoid architectures in ovarian teratomas with dense B cell foci expressing the germinal centre marker BCL6, CD21+ follicular dendritic cells, and the NR1 subunit, alongside lymphatic vessels and high endothelial vasculature. Cultured teratoma explants and dissociated intratumoral B cells secreted NR1-IgGs in culture. Hence, ovarian teratomas showed structural and functional evidence of NR1-specific germinal centres. On exploring classical secondary lymphoid organs, B cells cultured from cervical lymph nodes of patients with NMDAR-antibody encephalitis produced NR1-IgG in 3/7 cultures, from patients with the highest serum NR1-IgG levels (P < 0.05). By contrast, NR1-IgG secretion was observed neither from cervical lymph nodes in disease controls nor in patients with adequately resected ovarian teratomas. Our multimodal evaluations provide convergent anatomical and functional evidence of NMDAR-autoantibody production from active germinal centres within both intratumoral tertiary lymphoid structures and traditional secondary lymphoid organs, the cervical lymph nodes. Furthermore, we develop a cervical lymph node sampling protocol that can be used to directly explore immune activity in health and disease at this emerging neuroimmune interface.

Keywords: NMDAR-antibody encephalitis; brain autoimmunity; cervical lymph node; germinal centre; teratoma.


Figures

Figure 1
Figure 1
NR1-directed IgM and IgA antibodies in serum and CSF: association with OT and time from illness onset. (A) Detection of NR1-IgA using a live cell-based assay. Top: HEK293T cells were transiently transfected with the NR1 subunit. Expression demonstrated here with an NR1-directed commercial antibody (green). An anti-human IgA Fc specific antibody visualized binding of serum NR1-IgA (Positive); example of a serum sample without NR1-IgA shown (Negative). Bottom: After isotype-specific antibody depletion with beads (remaining isotype stated on left, white), the detection antibodies used are isotype-specific (detected isotype stated on top, red). DAPI to identify HEK293T cell nuclei. (B) Frequency and end point dilution of NR1-IgA (top row) and NR1-IgM (bottom row) in serum and CSF samples from disease/healthy controls (collectively, ‘Controls’) and from patients with NMDAR-antibody encephalitis (NMDAR-Ab-E). Comparisons of serum and CSF from NMDAR-Ab-E patients divided by OT status (OT versus non-OT). Dotted lines indicate positivity cut-off (serum 1:20, CSF undiluted). (C) Time-thresholded receiver operating characteristic (ROC) curves for serum or CSF NR1-IgA or NR1-IgM and OT association. The area under the curve (AUC) for serological measures was estimated by ROC analysis. AUC values were calculated for sliding 10-day thresholds between 0 and 370 days since the last episode. The optimum cut-off was assessed by Youden’s J statistic. Ten-day time thresholds from onset to 100 days are shown and indicated by the colour scale (red = earliest, blue = latest). In the top left of each box, the time window optimally associated with OT is indicated. Models were unaltered with removal of males. (D) Pseudo-log transformed (negative results replaced with 0.1) ratios of serum NR1-IgA:NR1-IgM end point dilutions are plotted over time in patients with and without an associated OT. Samples from OT patients are further subdivided by sampling before or after OT resection. Ratios are plotted on a logarithmic scale in time windows and summarized by box plots using the Tukey method where the horizontal line is the median and individual dots are outliers. Geometric means are indicated by circles. All OT-associated cases underwent OT resection. Upper time limit has been restricted to 920 days post-onset. d = days; DAPI = 4′,6-diamidino-2-phenylindole; NMDAR-Ab-E = NMDAR-antibody encephalitis; OR = odds ratio.
Figure 2
Figure 2
Structural and functional properties of disease-associated OT: NR1-autoantibody isotype detection, flow cytometry, cell culture and multiplex histology. (A) NR1-antibody isotype levels in matched fluids from four OTs from three patients [indicated by symbols and lines; Patient 2 (P2) had initial and recurrent OTs analysed]. Patient 7 NR1-IgG reproduced here for comparison. (B) B cell populations in the recurrent OT (top row) and peripheral blood (PBMCs) of Patient 2. Flow cytometry plots show ASCs (CD19+CD27+CD38+; left), naïve (CD27IgD+) and memory (CD27+IgD) B cells (middle) and memory B cell receptor isotypes (IgA versus IgG staining; with IgM staining indicated by colour; right). Prior gates shown in Supplementary Fig. 1 (scatter plot lymphocyte gate, doublet exclusion, CD45+CD3). (C) Frequency of NR1-IgG detection in cell culture supernatants (percentage of wells) from three sets of OT explants and dissociated cells (right) using activation (black bars) or maintenance (grey bars) conditions. (D) Distributions of lymphocytes, accessory vascular structures, and neuroglial tissue from NMDAR-antibody encephalitis-associated OT tissue (Patient 8). A low power fluorescence image shows a region of co-localized neuronal (MAP2) and glial (GFAP) markers towards the outer aspect of the section (red box). (EG) The region of interest is then examined with neuroglial/vascular/dendritic cell markers (E), NR1 (F) and CD19 (G). NR1 staining is most dense in the lymphocytic region (grey box) but can also be seen in the neuroglial region. The CD19+ region (grey box and HK), dendritic cells (purple box, L), and vascular structures (blue and yellow boxes, M and N, respectively) are then presented. (HK) Within the lymphoid aggregate, CD19+ cells are densely aggregated with occasional CD38+; representative rarer CD138+ cells from outside the region are shown in the green inset (H). Within the centre of the CD19+ region (H, brown box) there were BCL6+ cells, with some cells also positive for AID (I). This region also shows CXCR5 expression (J) alongside a CD21+ meshwork (K). (L) A cluster of LAMP3+ cells consistent with dendritic cells. (M) A PNAd+ vascular structure consistent with a high endothelial venule. (N) A podoplanin+ vascular structure consistent with a lymphatic vessel. BCL6 = B cell lymphoma 6 protein; CXCR5 = C-X-C chemokine receptor type 5; DAPI = 4′,6-diamidino-2-phenylindole; GFAP = glial fibrillary acidic protein; LAMP3 = lysosome-associated membrane glycoprotein 3; MBC = memory B cell; P = patient; PNAd = peripheral node addressin.
Figure 3
Figure 3
Single cell RNA sequencing (scRNA-Seq) of peripheral and teratoma-associated B cells. CD19+CD20+ cells were sorted from Patient 2 and Patient 4 (initial) teratoma samples and their paired PBMCs. (A) UMAP dimensionality reduction plot of scRNA-Seq data from B cells showing cluster identity, using Seurat. Curated cell type identity is labelled. (B) B cells coloured by the BCR constant region isotype that is maximally expressed by each cell and (C) by the rate of variable region mutations from germline BCR sequences, as estimated by HighVQuest (log10 number of mutations per kilobase). This showed a median of 1.65 versus 1.20 log10 mutations per kilobase of variable (V) region in a comparison of switched versus unswitched memory B subsets (P = 7.49 × 10–100). (D) Violin plot of variable region mutation rate by BCR constant region and a bar plot of Wilcoxon rank sum differences in the number of mutations per kilobase of V regions between IGHA1/2 and IGHG1 (95% CIs indicated by error bars). (E) Bar plot showing the log2 fold difference of expanded BCR clonotypes between teratoma and PBMCs (95% CIs based on 1000 downsamplings of the larger set of BCR clonotypes in each case). (F) UMAP plot of B cells coloured by k-nearest neighbours tissue of origin (k = 200) with red representing OT and grey PBMCs. The inset shows log2 fold enrichment of cells with IGHA1 constant region expression within cluster 6 from 10 000 permutations (P = 0.03). (G) UMAP plot of B cells coloured by the expression level of top genes enriched within cluster 6. These data have been normalized to the total gene expression, multiplied by 104 and finally 1 has been added to all values, so that 100 equates to an original value of 0. HSP = heat shock protein; IGH = immunoglobulin heavy constant gene; TNF = tumour necrosis factor.
Figure 4
Figure 4
Evaluation and characteristics of cervical lymph node aspirates. (A) Patient cervical lymph nodes (level Ia, Ib, Va or Vb) were accessed using ultrasound-guided fine needle aspiration. Alongside paired PBMCs, the material was processed for flow cytometry and cell culture experiments. (B) Lymphocytes, monocytes and nine B and three T cell populations were manually gated. Statistical comparisons were made for lymph node (LN)-PBMC sample pairs (LN = green, PBMC = grey). Left: a representative scatter plot showing superimposed LN and PBMC populations, demonstrating a characteristic absence of granulocyte populations in the LN plot. Middle: The three most significantly different parameters (Benjamini–Hochberg corrected Wilcoxon signed-rank tests P-values all <0.0001) between LN and PBMC are shown (monocyte:lymphocyte ratio, CD19+CD24+CD38+ transitional B cells and CD3+CD4+CXCR5+PD-Ihi T follicular helper cells). Right: Flow cytometry plot representative of LN versus PBMC comparisons showing GC B cells (CD19+CD83+, both with and without CD38) exclusively in CLNs. (C) UMAP of all 13 cell subset percentages. Each point represents one sample. (D) Left: Examples of NR1-IgG positive and negative culture supernatants, using live cell-based assay immunofluorescence. Middle: Frequency of cell culture wells with supernatant NR1-IgG reactivities, from paired peripheral blood and lymph node material, in seven samples from patients with NMDAR-antibody encephalitis and six disease controls. LN cultures produced NR1-IgG from samples from Patient 1 (Visits 1 and 2) and Patient 2. Right: Frequency of NR1-IgG positivity from LN cultures divided by a routine cut-off (1:20) for serum NR1-IgG end point dilution positivity. Key: Samples with serum NR1-IgG reactivities are coloured pink and patients with OT are indicated by an asterisk; disease control patients are indicated by inverted triangles. (E) UMAP of all 13 cell subset percentages from cultured PBMC (grey outline) and LN (green outline) samples. Points are scaled by concentration of CXCL13 detected in paired serum (PBMC samples) or LN aspirate wash (LN samples). CXCL13 = C-X-C motif ligand 13; CXCR5 = C-X-C chemokine receptor type 5; DC = disease control; FSC-A = forward scatter area; G = gauge, NMDAR-Ab-E = NMDAR-antibody encephalitis; PD-1 = programmed death 1; SSC-A = side scatter area.

References

    1. Dalmau J, Gleichman AJ, Hughes EG, et al. . Anti-NMDA-receptor encephalitis: Case series and analysis of the effects of antibodies. Lancet Neurol. 2008;7:1091–1098. - PMC - PubMed
    1. Irani SR, Bera K, Waters P, et al. . N-methyl-D-aspartate antibody encephalitis: Temporal progression of clinical and paraclinical observations in a predominantly non-paraneoplastic disorder of both sexes. Brain. 2010;133:1655–1667. - PMC - PubMed
    1. Gleichman AJ, Spruce LA, Dalmau J, Seeholzer SH, Lynch DR. Anti-NMDA receptor encephalitis antibody binding is dependent on amino acid identity of a small region within the GluN1 amino terminal domain. J Neurosci. 2012;32:11082–11094. - PMC - PubMed
    1. Planaguma J, Leypoldt F, Mannara F, et al. . Human N-methyl D-aspartate receptor antibodies alter memory and behaviour in mice. Brain. 2015;138:94–109. - PMC - PubMed
    1. Gable MS, Sheriff J, Dalmau J, Tilley DH, Glaser CA. The frequency of autoimmune N-methyl-D-aspartate receptor encephalitis surpasses that of individual viral etiologies in young individuals enrolled in the California Encephalitis Project. Clin Infect Dis. 2012;54:899–904. - PMC - PubMed

Publication types

Supplementary concepts