. 2022 Jun 9;13(1):3319.
doi: 10.1038/s41467-022-30642-8.

Disease-economy trade-offs under alternative epidemic control strategies

Affiliations

Disease-economy trade-offs under alternative epidemic control strategies

Thomas Ash et al. Nat Commun. .

Erratum in

Abstract

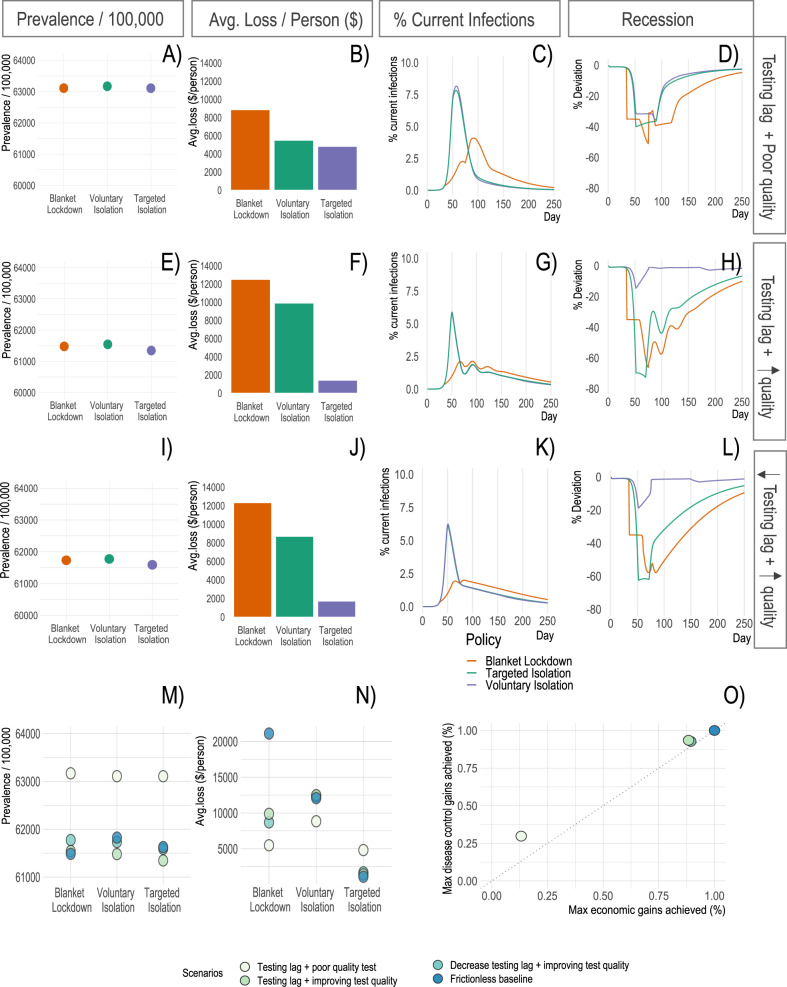
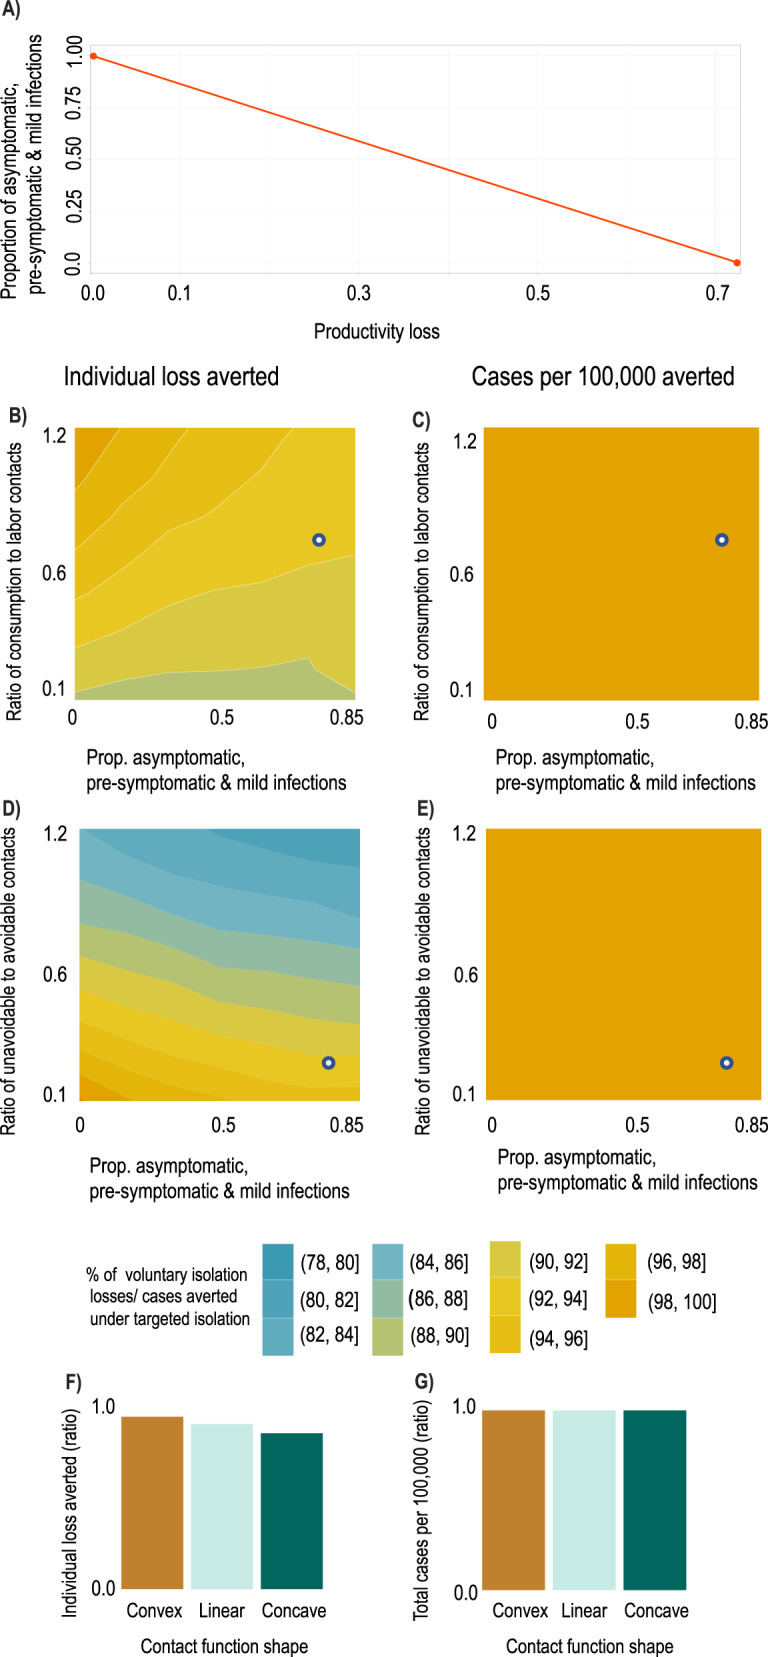
Public policy and academic debates regarding pandemic control strategies note disease-economy trade-offs, often prioritizing one outcome over the other. Using a calibrated, coupled epi-economic model of individual behavior embedded within the broader economy during a novel epidemic, we show that targeted isolation strategies can avert up to 91% of economic losses relative to voluntary isolation strategies. Unlike widely-used blanket lockdowns, economic savings of targeted isolation do not impose additional disease burdens, avoiding disease-economy trade-offs. Targeted isolation achieves this by addressing the fundamental coordination failure between infectious and susceptible individuals that drives the recession. Importantly, we show testing and compliance frictions can erode some of the gains from targeted isolation, but improving test quality unlocks the majority of the benefits of targeted isolation.


Conflict of interest statement

The authors declare no competing interests.

Figures

Fig. 1
Fig. 1. Coupled system schematic.
Individuals make consumption (C) and labor-leisure (L) choices, considering the risk of infection through contacts with others. Individual choices and resulting contacts affect and are affected by the disease dynamics. Individual economic choices drive population-level outcomes such as disease prevalence and economic recessions. Under decentralized approaches, individuals optimize their behaviors based on their own preferences and health status. Under coordinated approaches, individuals' behaviors are optimized based on how they affect population-level outcomes.
Fig. 2
Fig. 2. Disease dynamics and economic outcomes under voluntary isolation, blanket lockdown, and targeted isolation.
A Proportion of population infected over time under each strategy. Voluntary isolation and targeted isolation curves are almost-entirely overlapping, indicating nearly-identical disease dynamics. B Individual losses incurred under each strategy (targeted isolation averts 95% of voluntary isolation individual economic losses). C Key aggregate disease and economy outcomes under each strategy. See SI 2.5 for comparison with a “no control” approach.
Fig. 3
Fig. 3. Key model mechanisms.
A In voluntary isolation, susceptible individuals withdraw from economic activity due to the presence of infectious individuals (green dashed), while under targeted isolation susceptible agents engage in much more economic activity (blue dashed). B More infectious agents at activity sites under voluntary isolation lead to higher probability of infection throughout epidemic. CE overall contacts, contacts by activity and prevalence (% infectious) do not change meaningfully across voluntary and targeted isolation, as the same infection outcomes are achieved despite enabling far more activity by susceptible individuals with targeted isolation.
Fig. 4
Fig. 4. Model outcomes with different information frictions.
AD Key model outcomes under 10% test quality and an 8-day lag between testing and reporting. EH These outcomes when test quality linearly improves from 10% to 95% quality by day 75 under a constant 8-day test reporting lag. I-L These outcomes when test quality linearly improves as before, and the test reporting lag reduces from 8 days to 5 days at day 60 then from 5 days to 3 days at day 75. M, N How disease-economy outcomes vary across these scenarios. O The disease-economy outcomes under these scenarios relative to the baseline in Fig. 2.
Fig. 5
Fig. 5. Model outcomes with different compliance rates.
AD Key model outcomes under 0% compliance and no information frictions. EH These outcomes under 75% compliance and no information frictions. IL These outcomes when test quality linearly improves from 10% to 95% by day 75 and the test reporting lag reduces from 8 days to 5 days at day 60 then from 5 days to 3 days at day 75. M, N How disease-economy outcomes vary across these scenarios. O The disease-economy outcomes under these scenarios relative to the baseline in Fig. 2.
Fig. 6
Fig. 6. Result sensitivity to key model parameters.
We plot ratios of outcomes under targeted vs. voluntary isolation to highlight the relative variation in outcomes under each strategy. The white dots in panels B–E show the baseline parameterization. A Mapping between productivity losses and implied share of the population which is pre-symptomatic, asymptomatic, or has mild symptoms (i.e., infectious individuals able to work). A productivity loss of 0.85 implies approximately 80% of the population are pre-symptomatic, asymptomatic, or have mild symptoms. Ratio of individual losses averted (B) and ratio of cases per 100k averted (C) under targeted isolation vs. voluntary isolation as proportion of contacts at consumption relative to labor activities increases (a value of 1 means equal number of contacts at consumption and labor) and as the asymptomatic share increases. Ratio of individual losses averted (D) and ratio of cases per 100k averted (E) under targeted isolation vs. voluntary isolation as proportion of unavoidable contacts (e.g., home) relative to avoidable contacts (consumption & labor) increases (a value of 1 means an equal number of contacts at home as at consumption & labor) and as the asymptomatic share increases. Ratio of individual losses averted (F) and ratio of cases per 100k averted (G) under targeted isolation vs. voluntary isolation as contact functional form varies. Convex contact functions imply high-contact activities are easiest to avoid, while concave contact functions imply low-contact activities are easiest to avoid (see “Methods”).

References

    1. Dong E, Du H, Gardner L. An interactive web-based dashboard to track covid-19 in real time. Lancet Inf. Dis. 2020;5:533–534. doi: 10.1016/S1473-3099(20)30120-1. - DOI - PMC - PubMed
    1. Bureau of Economic Analysis. Gross domestic product, 2nd quarter 2020 (advance estimate) and annual update. Quarterly report, Department of Commerce. https://www.bea.gov/news/2020/gross-domestic-product-2nd-quarter-2020-ad... (2020).
    1. Kermack WO, McKendrick AG. A contribution to the mathematical theory of epidemics. Proc. R. Soc. Lond. 1927;115:700–721.
    1. Fraser C, Riley S, Anderson RM, Ferguson NM. Factors that make an infectious disease outbreak controllable. Proc. Natl Acad. Sci. USA. 2004;101:6146–6151. doi: 10.1073/pnas.0307506101. - DOI - PMC - PubMed
    1. Castillo-Chavez C, Bichara D, Morin BR. Perspectives on the role of mobility, behavior, and time scales in the spread of diseases. Proc. Natl Acad. Sci. USA. 2016;113:14582–14588. doi: 10.1073/pnas.1604994113. - DOI - PMC - PubMed

Publication types