. 2022 Jun 9;13(1):3207.
doi: 10.1038/s41467-022-30833-3.

Mitigation of SARS-CoV-2 transmission at a large public university

Diana Rose E Ranoa  1   2   3 Robin L Holland  4 Fadi G Alnaji  5 Kelsie J Green  1   6 Leyi Wang  7 Richard L Fredrickson  7 Tong Wang  8 George N Wong  8 Johnny Uelmen  9 Sergei Maslov  2   8   10 Zachary J Weiner  8 Alexei V Tkachenko  11 Hantao Zhang  12 Zhiru Liu  13 Ahmed Ibrahim  14 Sanjay J Patel  15 John M Paul  16 Nickolas P Vance  17 Joseph G Gulick  17 Sandeep Puthanveetil Satheesan  18 Isaac J Galvan  17 Andrew Miller  15 Joseph Grohens  19 Todd J Nelson  17 Mary P Stevens  17 P Mark Hennessy  20 Robert C Parker Jr  21 Edward Santos  22 Charles Brackett  22 Julie D Steinman  7 Melvin R Fenner Jr  21 Kirstin Dohrer  7 Michael DeLorenzo  23 Laura Wilhelm-Barr  23 Brian R Brauer  24 Catherine Best-Popescu  10 Gary Durack  16   25 Nathan Wetter  25 David M Kranz  26 Jessica Breitbarth  6 Charlie Simpson  6 Julie A Pryde  27 Robin N Kaler  28 Chris Harris  28 Allison C Vance  28 Jodi L Silotto  28 Mark Johnson  6 Enrique Andres Valera  10   16 Patricia K Anton  29 Lowa Mwilambwe  30 Stephen P Bryan  31 Deborah S Stone  32 Danita B Young  30 Wanda E Ward  23 John Lantz  31 John A Vozenilek  16 Rashid Bashir  16 Jeffrey S Moore  2   32 Mayank Garg  32 Julian C Cooper  32 Gillian Snyder  33 Michelle H Lore  33 Dustin L Yocum  34 Neal J Cohen  31   35 Jan E Novakofski  36 Melanie J Loots  37 Randy L Ballard  38 Mark Band  39 Kayla M Banks  6 Joseph D Barnes  40 Iuliana Bentea  41 Jessica Black  42 Jeremy Busch  38 Abigail Conte  43 Madison Conte  44 Michael Curry  42 Jennifer Eardley  6 April Edwards  7 Therese Eggett  7 Judes Fleurimont  40 Delaney Foster  45 Bruce W Fouke  2   5   39 Nicholas Gallagher  46 Nicole Gastala  43 Scott A Genung  47 Declan Glueck  42 Brittani Gray  40 Andrew Greta  48 Robert M Healy  6 Ashley Hetrick  49 Arianna A Holterman  31 Nahed Ismail  41 Ian Jasenof  40 Patrick Kelly  49 Aaron Kielbasa  23 Teresa Kiesel  49 Lorenzo M Kindle  17 Rhonda L Lipking  39 Yukari C Manabe  44 Jade Mayes  38 Reubin McGuffin  6 Kenton G McHenry  18 Agha Mirza  44 Jada Moseley  42 Heba H Mostafa  46 Melody Mumford  40 Kathleen Munoz  40 Arika D Murray  42 Moira Nolan  50 Nil A Parikh  32 Andrew Pekosz  43   44 Janna Pflugmacher  51 Janise M Phillips  21 Collin Pitts  49 Mark C Potter  52 James Quisenberry  53 Janelle Rear  54 Matthew L Robinson  44 Edith Rosillo  55 Leslie N Rye  39 MaryEllen Sherwood  6 Anna Simon  23 Jamie M Singson  53 Carly Skadden  6 Tina H Skelton  39 Charlie Smith  7 Mary Stech  21 Ryan Thomas  47 Matthew A Tomaszewski  56 Erika A Tyburski  57   58 Scott Vanwingerden  59 Evette Vlach  7 Ronald S Watkins  48   60 Karriem Watson  40 Karen C White  6 Timothy L Killeen  61 Robert J Jones  23 Andreas C Cangellaris  62 Susan A Martinis  37 Awais Vaid  27 Christopher B Brooke  2   5 Joseph T Walsh  55 Ahmed Elbanna  63   64 William C Sullivan  65 Rebecca L Smith  66   67   68   69 Nigel Goldenfeld  70   71   72 Timothy M Fan  73   74 Paul J Hergenrother  75   76   77 Martin D Burke  78   79   80   81   82   83
Affiliations

Mitigation of SARS-CoV-2 transmission at a large public university

Diana Rose E Ranoa et al. Nat Commun. .

Abstract

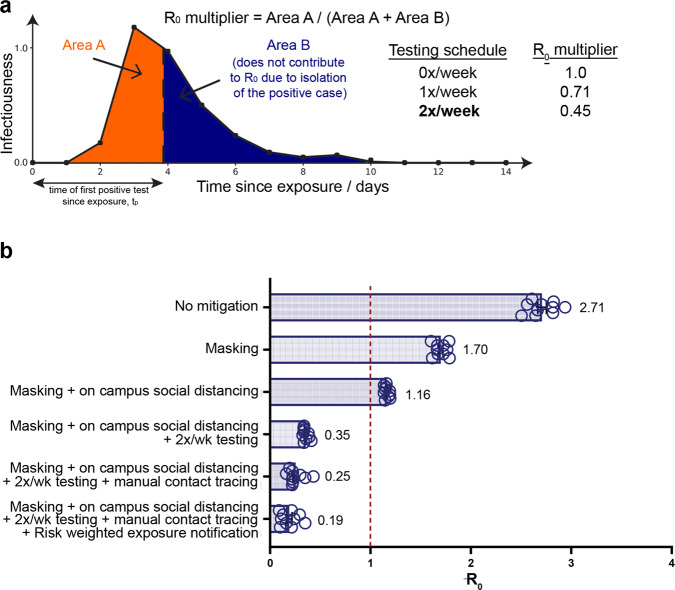
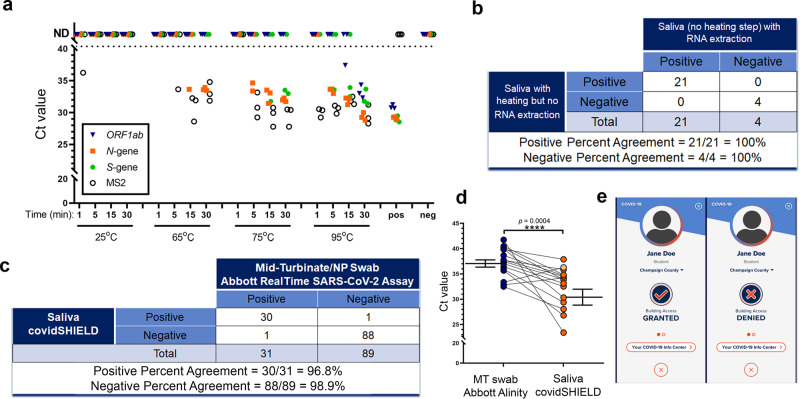
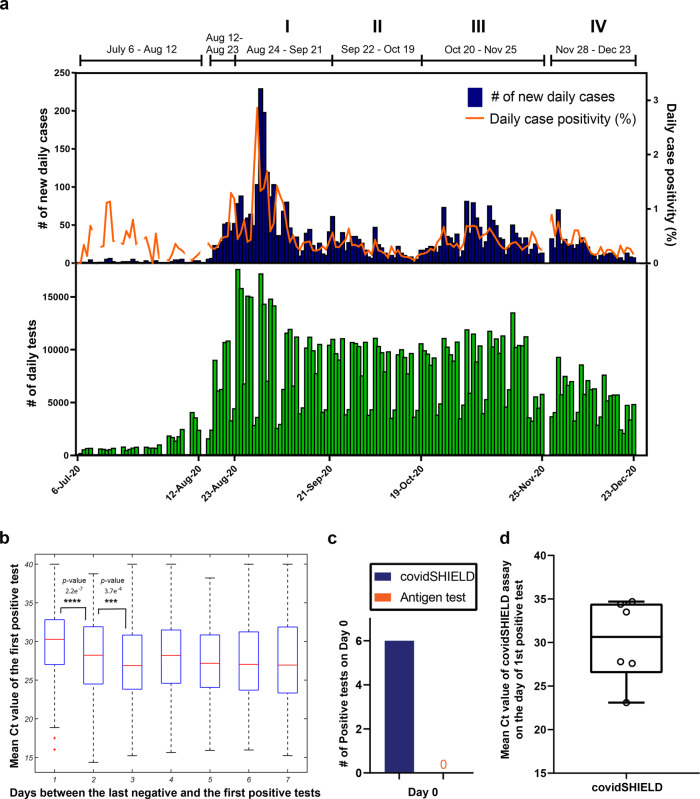
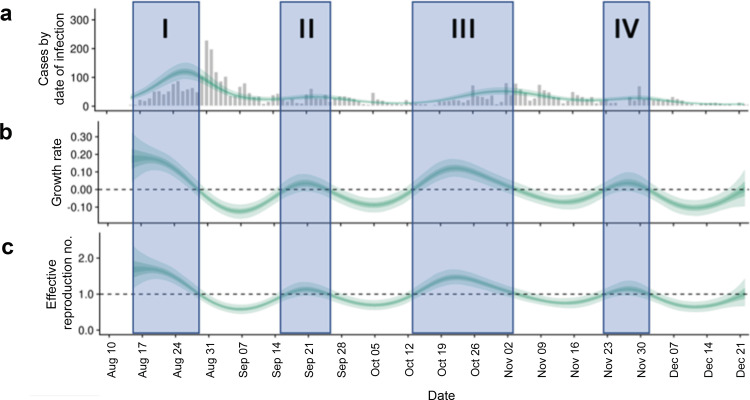
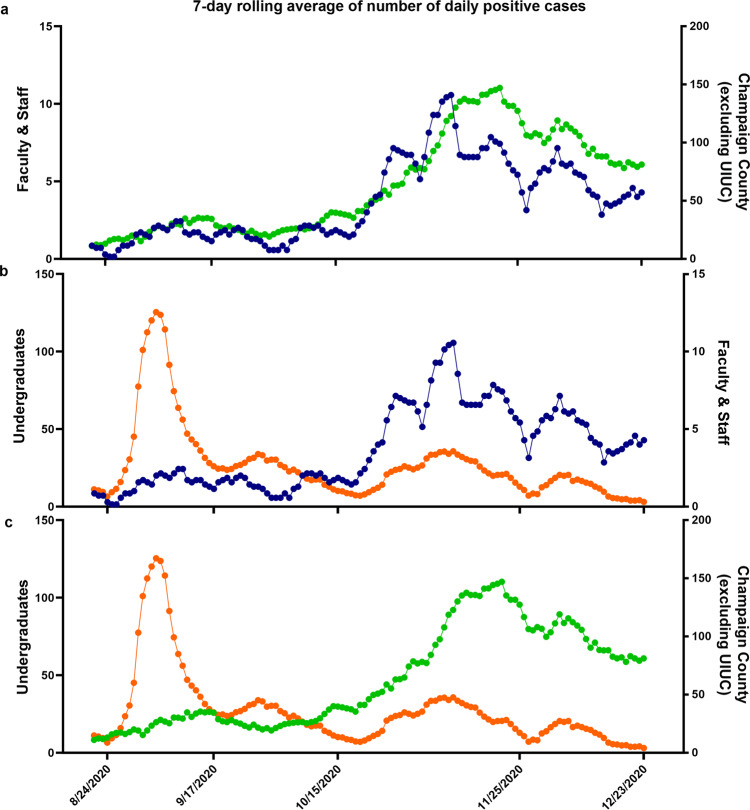
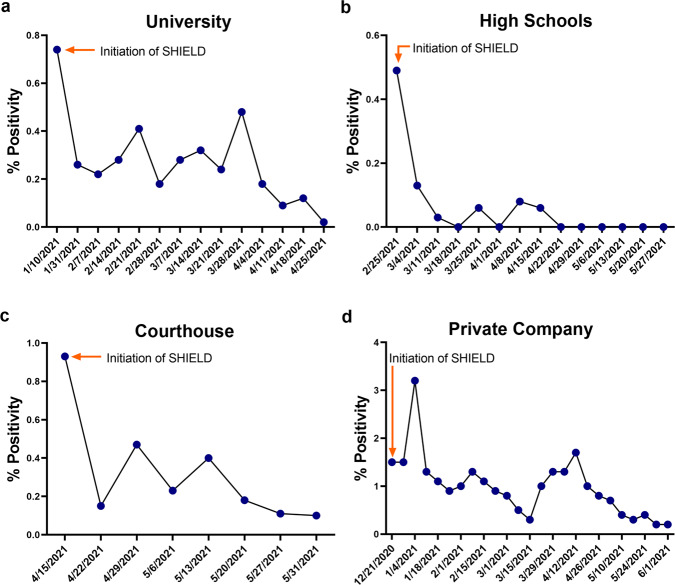
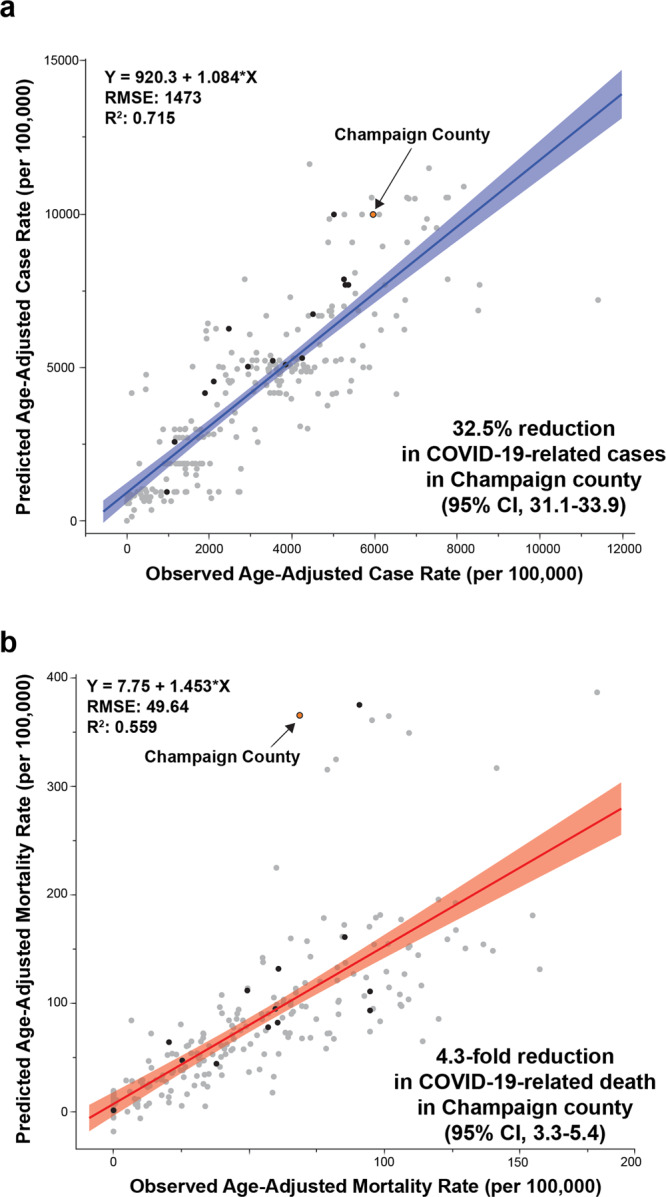
In Fall 2020, universities saw extensive transmission of SARS-CoV-2 among their populations, threatening health of the university and surrounding communities, and viability of in-person instruction. Here we report a case study at the University of Illinois at Urbana-Champaign, where a multimodal "SHIELD: Target, Test, and Tell" program, with other non-pharmaceutical interventions, was employed to keep classrooms and laboratories open. The program included epidemiological modeling and surveillance, fast/frequent testing using a novel low-cost and scalable saliva-based RT-qPCR assay for SARS-CoV-2 that bypasses RNA extraction, called covidSHIELD, and digital tools for communication and compliance. In Fall 2020, we performed >1,000,000 covidSHIELD tests, positivity rates remained low, we had zero COVID-19-related hospitalizations or deaths amongst our university community, and mortality in the surrounding Champaign County was reduced more than 4-fold relative to expected. This case study shows that fast/frequent testing and other interventions mitigated transmission of SARS-CoV-2 at a large public university.


Conflict of interest statement

University of Illinois at Urbana-Champaign has filed two pending patent applications related to the saliva-based assay described herein (US Nonprovisional Application No. 17/350,670, filed June 17, 2021; US National Phase Application No. 17/636,469, filed on February 18, 2022), and D.R.E.R., R.L.H., F.G.A., K.J.G., L.W., C.R.B., M.D.B., T.M.F., and P.J.H. are co-inventors. S.J.P., J.M.P., W.C.S., R.J.J., and A.C.C. are associated with Rokwire, which created the Safer Illinois App. G.D. and N.W. are associated with TekMill which created some of the automation used in the VDL COVID-19 Testing Lab at UIUC. P.J.H., A.C.C., S.A.M. and J.T.W. are Members of the Board of Managers for the University Related Organization SHIELD T3, LLC, which has obtained a non-exclusive license to this technology. The remaining authors declare no competing interests.

Figures

Fig. 1
Fig. 1. Target.
a Sensitive testing can reveal a positive case early in the infection, and thus isolation of the index case reduces the number of people infected by this index case. Frequent testing and rapid isolation reduce the time period during which a person is infectious but not isolated (Area A). As a result, the R0 multiplier for testing is the ratio between the truncated area under the curve (Area A) and the untruncated area under the curve (Area A + Area B). The dashed vertical line between Area A and Area B represents the moment an infected individual is isolated; as this line moves to the left, M is decreased and viral spread is reduced. b Effect of different mitigation interventions on the basic reproduction number R0 as computed in our agent-based model. Mean R0 values (n = 10) are indicated for each conditions tested. Error bars represent SEM. If R0 is >1 (orange dashed line at R0 = 1), the epidemic grows exponentially. If R0 is <1, any outbreak diminishes exponentially. Without any mitigation, R0 is close to 3 and a runaway epidemic will occur. Masking and social distancing help reduce transmission but can’t suppress growth of cases on their own as R0 is still greater than one. However, when these measures are combined with frequent testing (2 tests a week), R0 drops to 0.35 and containment of epidemic becomes possible. Adding extra mitigation interventions such as manual contact tracing and risk based exposure notification being R0 further down to 0.19 suggesting the potential for strong control of the epidemic on campus. The details of the agent-based model are given in the “Methods” section. The results shown here are computed assuming that 100% of the students are compliant with twice a week testing, isolation, and quarantine. We also ran the same simulation assuming 60% compliance, and the same general trends were observed with R0 for the full SHIELD program predicted to still be manageable (0.5, see Supplementary Fig. 1). Simulated effects of delays and imperfect contact tracing on the final size of epidemic and peak quarantined population, using the agent-based model, are shown in Supplementary Fig. 2.
Fig. 2
Fig. 2. Test and tell.
a The effect of heat on SARS-CoV-2 nucleic acid detection in saliva. γ-irradiated SARS-CoV-2 (1.0 × 104 viral copies/mL) was spiked into fresh human saliva (SARS-CoV-2 negative). Samples diluted 1:1 with 2× Tris–borate–EDTA (TBE) buffer were incubated at 25 °C, or in a hot water bath at the indicated temperature and incubation time. All saliva samples were spiked with purified MS2 bacteriophage as an internal control and directly analyzed by RT-qPCR, in triplicate, for SARS-CoV-2 nucleic acid corresponding with ORF1ab gene, N-gene, and S-gene. Undetermined Ct values are plotted as ND. This experiment was repeated at least three times. b 25 clinical saliva samples were split into two aliquots upon receipt, one set was processed using our covidSHIELD assay and the other set was subjected to RNA extraction. 5 μL of processed saliva were subsequently used as templates for RT-qPCR. A positive result is called when two out of three viral target genes is detected. c Qualitative outcome of parallel testing of paired mid-turbinate swabs and saliva with the Abbott RealTime SARS-CoV-2 assay and covidSHIELD. 120 participants were enrolled in a clinical study comparing results from contemporaneously collected nasopharyngeal or mid-turbinate nasal swabs analyzed using both protocols. Overall concordance was 98.3% (95% CI, 94.1–99.8%), positive percent agreement was 96.8% (95% CI, 83.2–99.9%) and negative percent agreement was 98.9% (95% CI, 93.9–99.9%). All clinical trials were reviewed by the Western Institutional Review Board. All participants gave written and informed consent. d Additional clinical study outcome of 17 individuals confirmed to be positive for COVID-19 and to have low viral loads (Ct = 32–42, average 37) by mid-turbinate nasal swabs analyzed at the Johns Hopkins University School of Medicine using Abbott Alinity compared with contemporaneously collected saliva samples that were analyzed using the covidSHIELD assay at the University of Illinois Urbana-Champaign CLIA-registered laboratory. p-value = 0.0004 was calculated using 2-tailed, unpaired t-test. e Mock representative images from the Safer Illinois app. The screen on the left appears when a user is in compliance with the campus testing protocol and has received a recent negative test for SARS-CoV-2. The screen on the right appears when the user of the app is out of compliance, when they have had a recent exposure notification, or when they have tested positive for the virus.
Fig. 3
Fig. 3. Deployment of frequent repeat testing at the University of Illinois in fall 2020.
a Timeline of detected cases during surveillance testing from July 6 to December 23, 2020. The top panel displays the daily new cases (blue) and the daily case positivity (orange). The daily case positivity is computed as the (number of new cases)/(unique number of individuals tested during the day). The lower panel shows the number of daily tests performed (green), which to an excellent approximation is the same as the number of unique individuals tested in a day. b Ct values of the first positive test as a function of time elapsed since the last negative test. The difference between the first (1 day) and the second (2 days) bins is highly statistically significant (p-value 2.2e−7), and that between the second (2 days) and the third (3 days) bins is statistically significant (p-value 3.7e−4). p-values shown are for the two-sided hypothesis of non-zero Pearson correlation between the number of days since the last negative test (x-axis) and the Ct value of the first positive test (y-axis). The exact sample sizes are: 341 patients who test positive 1 day since the last negative, 616 patients—2 days since the last negative, 716 patients—3 days since the last negative, and 1230 patients—between 4 and 7 days since the last negative. The box plots were generated using the command boxplot in Matlab 9.10.0.1684407(R2021a). The bottom and top of each box are the 25th and 75th percentiles of the sample, respectively. The distance between the bottom and top of each box is the interquartile range. The red line in the middle of each box is the median. The whiskers go from the end of the interquartile range to the furthest observation within the whisker length which is 1.5× the interquartile range. The outliers are marked with red + sign and are defined as the observations that go beyond the whisker length. c Head-to-head daily testing with covidSHIELD and antigen-based lateral flow assays in a subgroup of participants (n = 190) from October 1, 2020 to Dec 23, 2020. A total of 13,299 contemporaneous tests were performed. Of the 190 individuals, 6 tested positive for SARS-CoV-2 on Day 0 using the covidSHIELD test but all six tested negative using the antigen test. Blue and orange bars represent the percentage of participants that tested positive for SARS-CoV-2 on day 0 using covidSHIELD and the antigen test, respectively. d Box-and-whiskers plot of mean Ct values of the 6 individuals who tested positive for SARS-CoV-2 using the covidSHIELD assay on Day 0. Data was plotted using GraphPad Prism v9.3.1, where the lower and upper box extends from 25th to 75th percentiles, respectively, the line in the middle of the box is the median, the lower and upper error lines are the minimum and maximum value, respectively; each individual values are plotted as circles superimposed on the graph.
Fig. 4
Fig. 4. Epidemiological analysis for COVID-19 cases on campus.
a Cases estimated by date of infection. b Estimated growth rate. c Estimated effective reproduction number Reff by the date of infection as a function of time using the method of Cori et al. assuming gamma-distributed generation time distribution and a distribution between consecutive tests shown in Supplementary Fig. 7. The shaded periods (I–IV) correspond to periods of the semester when Reff > 1 suggesting transient growth of cases. The unshaded time periods correspond to Reff < 1 suggesting that the epidemic is controlled, and cases are decreasing. In each subplot, the credible intervals for the calculation of that output are shown with three shades. These three shades correspond to credible intervals of 20% (darkest green), 50% (lighter green), and 90% (lightest green). Analysis was done using Epidemiological toolbox EpiNow2. Please see the “Methods” section for more details.
Fig. 5
Fig. 5. Mitigation of SARS-CoV-2 spread in the context of the larger Champaign-Urbana Community.
The daily number of 7-day averaged daily new cases between faculty/staff and residents in Champaign County a, undergraduates and faculty/staff b, and undergraduate students and residents in Champaign County c, for the period between August 15 and December 23. All points in three plots are colored according to their categories (orange: undergraduate students, blue: faculty/staff, green: residents in Champaign County). Pearson correlation coefficient, 95% confidence interval, and p-values for two-tailed test were calculated using GraphPad Prism software.
Fig. 6
Fig. 6. Other communities with SHIELD.
SHIELD was deployed at other locations in Winter 2020/Spring 2021. The results from four representative examples are shown: a a university (1×/week), b a pair of high schools (2×/week), c a courthouse (2×/week), and d a large private corporate campus (2×/week).
Fig. 7
Fig. 7. Other communities without SHIELD.
a and b Relationship between observed and predicted COVID-19 cases and mortality among counties with large university enrollments (student enrollment > 15,000 at start of Fall 2020 semester, n = 251). Predicted COVID-19 case and mortality rates were analyzed with a 3-week lag (to adjust for delays between exposure and outcome) using each county’s social vulnerability index (SVI) and age-adjusted COVID-19 mortality, accounting for state (due to policy differences in COVID-19 management). COVID-19 human case data, and SVI were provided from CDC (2021) and population data was provided from the U.S. Census Bureau (2019). The lines indicate the fit lines for the linear regressions, with shaded areas indicating the 95% confidence intervals around the fits and circles indicating observations with Champaign County shown in orange and other Big 10 Conference Universities (n = 16*) in black. *Hennepin and Ramsey Counties (MN) were both used for University of Minnesota.

References

    1. Morawska L, Milton DK. It is time to address airborne transmission of coronavirus disease 2019 (COVID-19) Clin. Infect. Dis. 2020;71:2311–2313. - PMC - PubMed
    1. Tkachenko AV, et al. Stochastic social behavior coupled to COVID-19 dynamics leads to waves, plateaus, and an endemic state. eLife. 2021;10:e68341. doi: 10.7554/eLife.68341. - DOI - PMC - PubMed
    1. Weitz JS, Park SW, Eksin C, Dushoff J. Awareness-driven behavior changes can shift the shape of epidemics away from peaks and toward plateaus, shoulders, and oscillations. Proc. Natl Acad. Sci. USA. 2020;117:32764. doi: 10.1073/pnas.2009911117. - DOI - PMC - PubMed
    1. Richmond, C. S., Sabin, A. P., Jobe, D. A., Lovrich, S. D. & Kenny, P. A. SARS-CoV-2 sequencing reveals rapid transmission from college student clusters resulting in morbidity and deaths in vulnerable populations. Preprint at medRxiv10.1101/2020.10.12.20210294 (2020).
    1. Wilson E, et al. Multiple COVID-19 clusters on a University Campus—North Carolina, August 2020. Mmwr. Morb. Mortal. Wkly. Rep. 2020;69:1416–1418. doi: 10.15585/mmwr.mm6939e3. - DOI - PMC - PubMed

Publication types