. 2022 Jun 9;13(1):3202.
doi: 10.1038/s41467-022-30827-1.

Norepinephrine potentiates and serotonin depresses visual cortical responses by transforming eligibility traces

Affiliations

Norepinephrine potentiates and serotonin depresses visual cortical responses by transforming eligibility traces

Su Z Hong et al. Nat Commun. .

Erratum in

Abstract

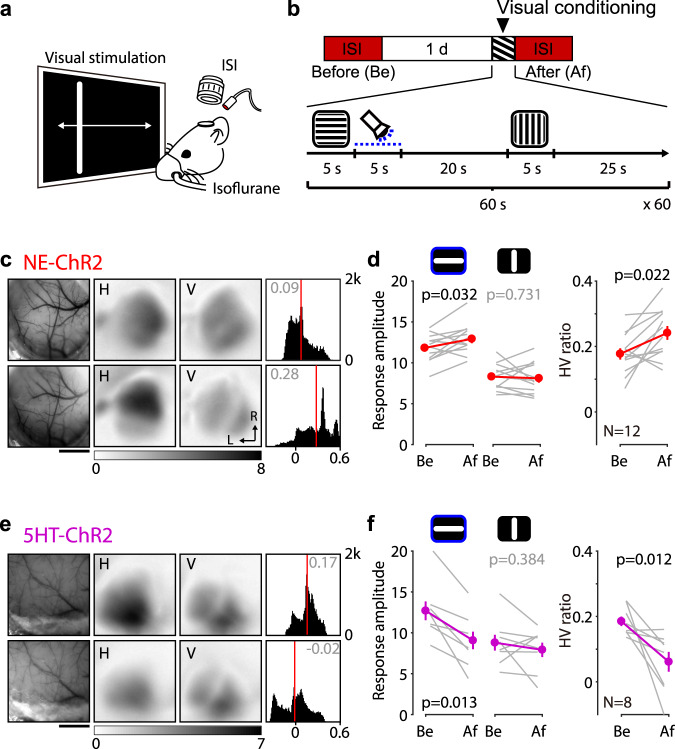
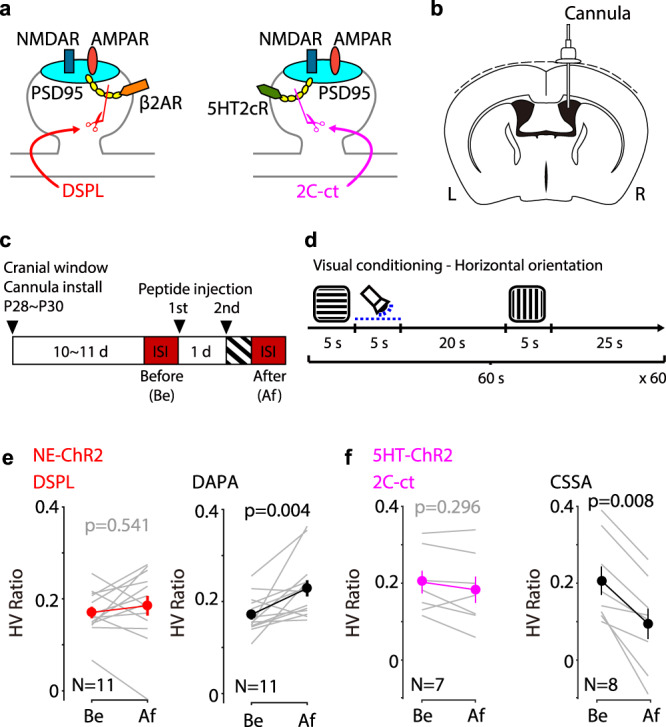
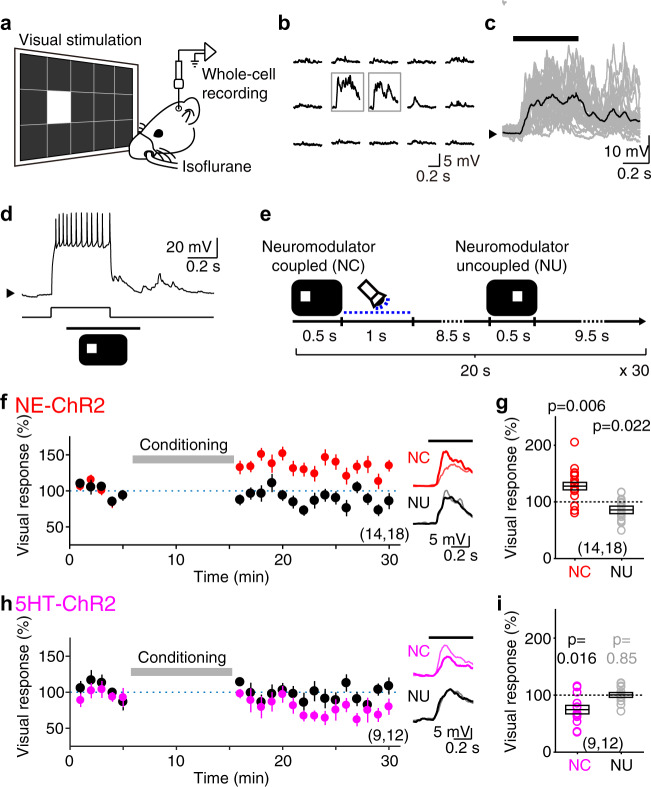
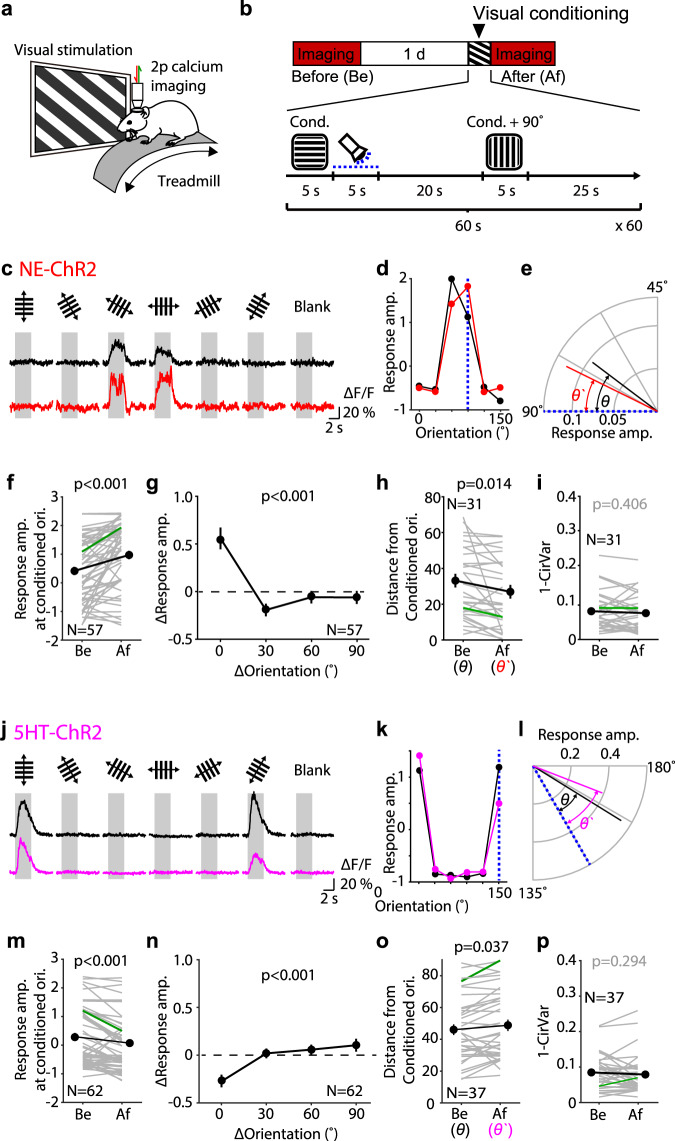
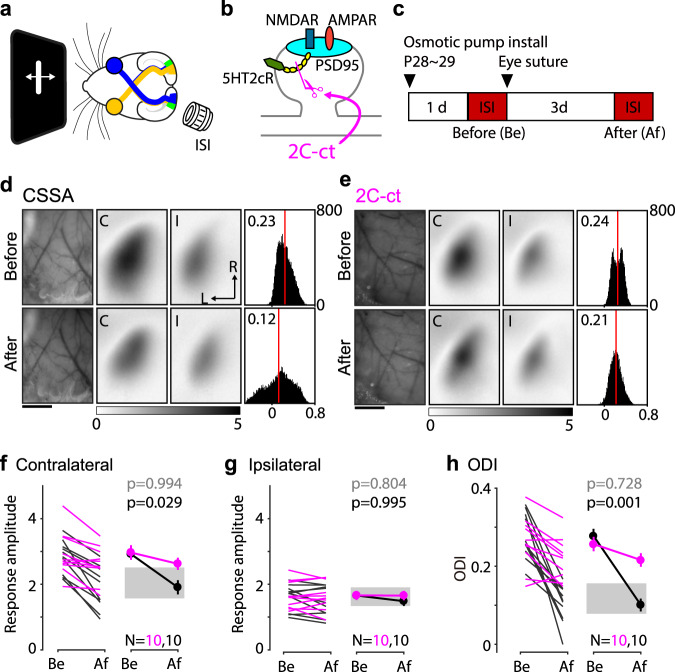
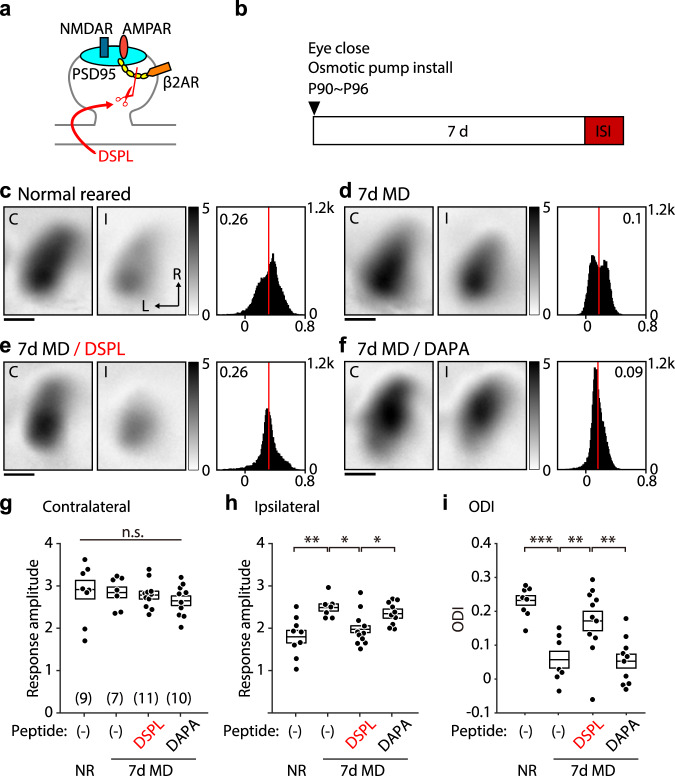
Reinforcement allows organisms to learn which stimuli predict subsequent biological relevance. Hebbian mechanisms of synaptic plasticity are insufficient to account for reinforced learning because neuromodulators signaling biological relevance are delayed with respect to the neural activity associated with the stimulus. A theoretical solution is the concept of eligibility traces (eTraces), silent synaptic processes elicited by activity which upon arrival of a neuromodulator are converted into a lasting change in synaptic strength. Previously we demonstrated in visual cortical slices the Hebbian induction of eTraces and their conversion into LTP and LTD by the retroactive action of norepinephrine and serotonin Here we show in vivo in mouse V1 that the induction of eTraces and their conversion to LTP/D by norepinephrine and serotonin respectively potentiates and depresses visual responses. We also show that the integrity of this process is crucial for ocular dominance plasticity, a canonical model of experience-dependent plasticity.


Conflict of interest statement

The authors declare no competing interests

Figures

Fig. 1
Fig. 1. Potentiation and depression of visual cortical responses by the retroactive action of norepinephrine and serotonin.
a Schematic of the optical imaging of the intrinsic signal (ISI) of the visual cortical response from the V1. b Experiment timeline (top) and the visual conditioning protocol (bottom). Blue dotted line indicates photoactivation of ChR2. c, d Optogenetic transformation of LTP trace induces potentiation of the associated visual cortical response of the NE-ChR2 mice. c Representative change of the visual cortical response by the visual conditioning. Left: vasculature pattern of the imaged region used for alignment. Scale bar, 1 mm. Middle: magnitude map of the visual cortical response evoked by horizontal [H] or vertical [V] drifting bar. Gray scale (bottom): response magnitude as the fractional change in reflection x104. Arrows: L lateral, R rostral. Right: histogram of HV ratio illustrated in the number of pixels (x-axis: HV ratio, y-axis: number of pixels). d Summary of changes in response amplitude evoked by the horizontal (left) or vertical (middle) drifting bar as well as the change of HV ratio (right) before (Be) and after (Af) the conditioning. Thin line: individual experiments; thick line and symbols: average ± s.e.m. e, f Optogenetic transformation of LTD trace induces depression of the associated visual cortical response of the 5HT-ChR2. Same format with (c and d). Source data are provided as a Source Data file.
Fig. 2
Fig. 2. Peptides targeting the conversion of eTraces prevent reinforcement-like conditioning of visual cortical responses.
a Diagrams illustrating that DSPL (left) or 2C-ct (right) disrupts the direct interaction of the β2AR or 5HT2cR with PSD-95, respectively. b A diagram illustrating the implantation of the cannula to inoculate the disrupting peptides to the lateral ventricle. c Experiment timeline. The peptide was injected 1 day (1st) and 30 min (2nd) earlier than the visual conditioning. d For the visual conditioning, horizontal or vertical drifting gratings were alternately shown at 30 s intervals. Photoactivation to induce the release of neuromodulators was retroactively coupled to the horizontal drifting gratings. e Summary of the HV ratio change by the visual conditioning in the presence of the disrupting peptide (DSPL) or the control peptide (DAPA) of the NE-ChR2 mice. f Summary of the HV ratio change by the visual conditioning in the presence (2C-ct) or the control peptide (CSSA) of the 5HT2cR disrupting peptide of the 5HT-ChR2 mice. Thin line: individual animals; thick line and symbols: average ± s.e.m. Source data are provided as a Source Data file.
Fig. 3
Fig. 3. Potentiation and depression of VEPSPs by Hebbian induction and optogenetic conversion of eligibility traces.
a Schematic of in vivo whole-cell patch-clamp recording of the superficial V1 neurons. b Example of the VEPSPs elicited by visual stimuli at each subregion of a screen. Gray boxes indicate the two panels chosen for visual stimulation. c Individual (gray traces) and averaged (black trace) VEPSPs elicited by the visual stimulus presentation (black bar on top) of a representative neuron. Black arrow on the left indicates Vm (−70 mV). d Pairing of VEPSP with a burst of postsynaptic spikes. The current injected via recording pipette and the timing of visual stimulus are shown at the bottom. Black arrow on the left indicates Vm (−70 mV). e Visual conditioning protocol. f Normalized change of the NC (red) or NU (black) VEPSP amplitude of the NE-ChR2 mice by the visual conditioning. Inset traces show the VEPSPs of a representative neuron averaged initial (thin line) or last (thick line) 5 min of the recording. g Summary of VEPSP changes by the visual conditioning. Box plot: average ± s.e.m. Sample number indicates the number of animals and the number of recorded neurons. h, i Same as panel (f, g) but for the 5HT-ChR2 mice. Source data are provided as a Source Data file.
Fig. 4
Fig. 4. Optogenetic transformation of eligibility traces changes orientation responses of individual V1 neurons.
a Schematic of the two-photon calcium imaging of head-fixed mice. b Experiment timeline (top) and the visual conditioning protocol (bottom). Blue dotted line indicates photoactivation of ChR2. ce Analysis of a representative neuron from a NE-ChR2 mouse. c Fluorescence signal elicited by various orientations of the drifting gratings before (black) and after (red) the visual conditioning. Each trace indicates the average response across 16 trials consisting of both directions. Gray area indicates the visual stimulus. d Orientation tuning curve before (black) and after (red) the visual conditioning. Blue dotted line indicates the conditioned orientation. e Vectors indicating the preferred orientation before (black) and after (red) the visual conditioning. Blue dotted line indicates the conditioned orientation. θ and θ` indicate the angular differences between the preferred orientations and the conditioned orientation. fi Summary of the changes in NE-ChR2 mice. f Change of the response amplitude at the conditioned orientation. g Response amplitude change according to the difference from the conditioned orientation. Data at two orientations (clockwise and counterclockwise) were pulled for comparison. (Kruskal–Wallis test, KW stat = 42.58, p < 0.001, and post hoc Dunn’s multiple comparison test (vs. 0° ΔOrientation, 30°: p < 0.001, 60°: p = 0.005, 90°: p = 0.001). h Angular difference between the preferred orientations and the conditioned orientation measured before and after the visual conditioning diminished. This analysis includes only oriented cells with initial preferred direction significantly different from the conditioned one. i 1-CirVar as a measure of orientation selectivity of the cells measured before and after visual conditioning (see “Methods”). Thin gray lines in (h, i): individual neurons; thick line and symbols: average ± s.e.m. Green lines indicate the example neuron in (ce). jp Summary of the changes in 5HT-ChR2 mice. Same format with (fi). (Kruskal–Wallis test, KW stat = 30.59, p < 0.001, and post hoc Dunn’s multiple comparison test (vs. 0° ΔOrientation, 30°: p < 0.001, 60°: p < 0.001, 90°: p < 0.001). Source data are provided as a Source Data file.
Fig. 5
Fig. 5. Blockage of the conversion of the LTD trace impairs the ocular dominance plasticity in juvenile mice.
a Schematic of the experiment to record the visual cortical response in the binocular region (green region in left hemisphere) of the V1. b A diagram illustrating that 2C-ct disrupts the direct interaction of the 5HT2c receptor with PSD-95. c Experiment timeline. ISI was performed before (Be) and after (Af) the 3d MD. d, e Representative change of the visual cortical response by the 3d MD in the presence of the control peptide, CSSA (d), or 2C-ct (e). Left: vasculature pattern of the imaged region used for alignment. Scale bar, 1 mm. Middle: magnitude map of the visual cortical response evoked by contralateral [C] or ipsilateral [I] eye from the recorded hemisphere. Gray scale (bottom): response amplitude as the fractional change in reflection x104. Arrows: L, lateral, R, rostral. Right: histogram of the ODI illustrated in the number of pixels (x-axis: ODI, y-axis: number of pixels). Red line indicates the average. fh Summary of the changes in response amplitude evoked by the contralateral (f) and ipsilateral (g) eye as well as the change of ODI (h) before (Be) and after (Af) the conditioning. Left: individual experiments in the presence of CSSA (black) or 2C-ct (purple); Right: average ± s.e.m. of the left plot. p-values: Two-way ANOVA and post hoc Sidak’s multiple comparisons test between the 2C-ct group and the CSSA group at before (gray) and after(black) the 3d MD. Gray region indicates a 95% confidential interval of 3d MD mice without peptide infusion. Source data are provided as a Source Data file.
Fig. 6
Fig. 6. Blockage of the conversion of the LTP trace impairs the ocular dominance plasticity in young adult mice.
a A diagram illustrating that DSPL disrupts the direct interaction of the β2-adrenergic receptor with PSD-95. b Experiment timeline. For the MD, the contralateral eye to the recorded hemisphere was closed for 7 days before the ISI. Peptide infusion was started when the eye closed. cf Representative visual cortical response of the mouse normal reared (c), after 7 days of MD (d), after 7 days of MD with the infusion of DSPL (e), and after 7 days of MD with the infusion of the control peptide, DAPA (f). Left and middle: each magnitude map shows the visual cortical response from the contralateral (C) or the ipsilateral (I) eye from the recorded hemisphere. Gray scale: response amplitude as the fractional change in reflection ×104. Arrows: L, lateral, R, rostral. Right: histogram of the ODI illustrated in the number of pixels (x-axis: ODI, y-axis: number of pixels). gi Summary of the response amplitude evoked by the contralateral (g) and ipsilateral (h) eye as well as the ODI (i) of each group. Box plot: average ± s.e.m. One-way ANOVA and post hoc Holm–Sidak’s multiple comparison test, g F(3,33) = 0.578, p = 0.633; h F(3,32) = 6.267, p = 0.001; i F(3,33) = 12.31, p < 0.001; *p < 0.05, **p < 0.01, ***p < 0.001. Source data are provided as a Source Data file.

References

    1. Avery MC, Krichmar JL. Neuromodulatory systems and their interactions: a review of models, theories, and experiments. Front. Neural Circuits. 2017;11:108. doi: 10.3389/fncir.2017.00108. - DOI - PMC - PubMed
    1. Gerstner, W., Lehmann, M., Liakoni, V., Corneil, D. & Brea, J. Eligibility traces and plasticity on behavioral time scales: experimental support of neohebbian three-factor learning rules. Front. Neural Circuits12, 53 (2018). - PMC - PubMed
    1. Mackintosh NJ. Blocking of conditioned suppression: role of the first compound trial. J. Exp. Psychol.: Anim. Behav. Process. 1975;1:335–345. - PubMed
    1. Rothkopf, C. A. & Ballard, D. H. Credit assignment in multiple goal embodied visuomotor behavior. Front. Psychol.1, 173 (2010). - PMC - PubMed
    1. Crow TJ. Cortical synapses and reinforcement: a hypothesis. Nature. 1968;219:736–737. doi: 10.1038/219736a0. - DOI - PubMed

Publication types