. 2022 Jun 9;13(1):3328.
doi: 10.1038/s41467-022-31053-5.

Association between resting-state functional brain connectivity and gene expression is altered in autism spectrum disorder

Affiliations

Association between resting-state functional brain connectivity and gene expression is altered in autism spectrum disorder

Stefano Berto et al. Nat Commun. .

Abstract

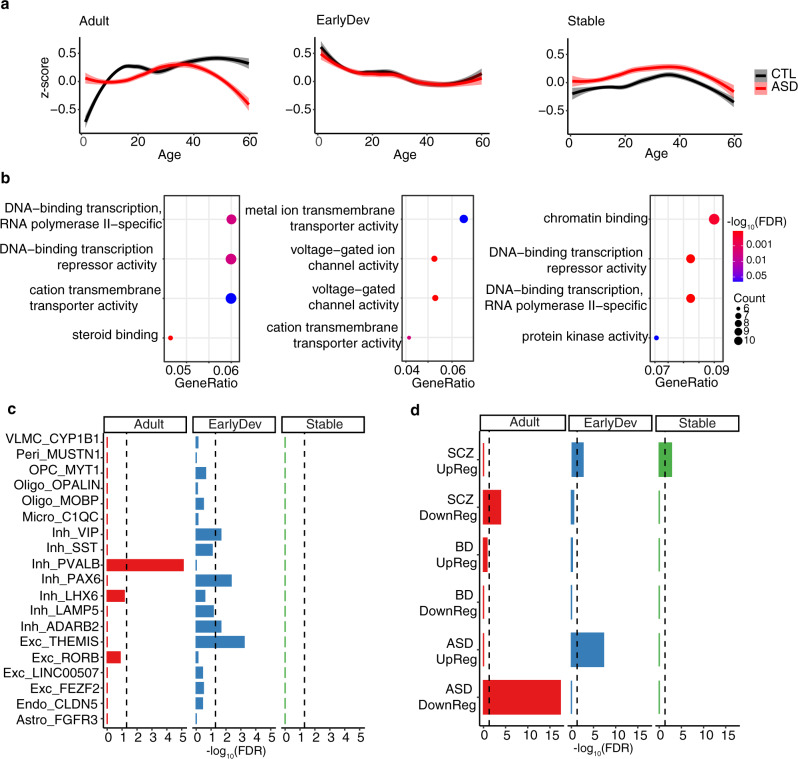
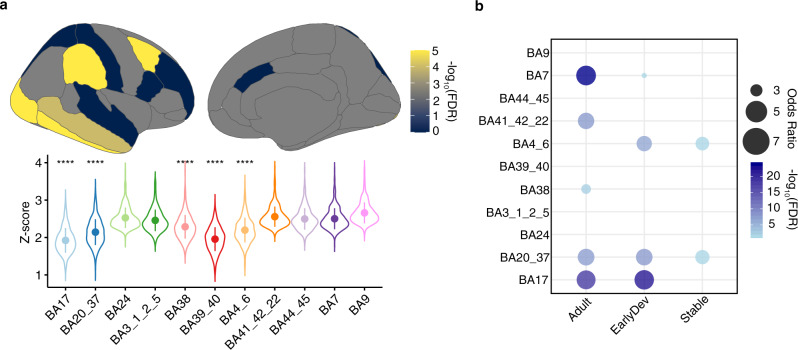
Gene expression covaries with brain activity as measured by resting state functional magnetic resonance imaging (MRI). However, it is unclear how genomic differences driven by disease state can affect this relationship. Here, we integrate from the ABIDE I and II imaging cohorts with datasets of gene expression in brains of neurotypical individuals and individuals with autism spectrum disorder (ASD) with regionally matched brain activity measurements from fMRI datasets. We identify genes linked with brain activity whose association is disrupted in ASD. We identified a subset of genes that showed a differential developmental trajectory in individuals with ASD compared with controls. These genes are enriched in voltage-gated ion channels and inhibitory neurons, pointing to excitation-inhibition imbalance in ASD. We further assessed differences at the regional level showing that the primary visual cortex is the most affected region in ASD. Our results link disrupted brain expression patterns of individuals with ASD to brain activity and show developmental, cell type, and regional enrichment of activity linked genes.


Conflict of interest statement

The authors declare no competing interests.

Figures

Fig. 1
Fig. 1. Flowchart of the analytical framework and pipeline.
Gene expression values were obtained for 11 cortical regions from individuals diagnosed with autism spectrum disorder (ASD) and demographically matched neurotypical individuals (CTL: control). For fMRI, the ABIDE I and II datasets were used to select ASD and CTL individuals that demographically matched with the gene expression cohort. Regional Homogeneity (ReHo) and fractional amplitude of low frequency oscillations (fALFF) were calculated from these individuals for the 11 cortical regions. 200 subsampled matches were selected from CTL individuals. Spearman’s rank correlation was used to infer a correlation between gene expression and fMRI separately for both fMRI measurements. For differential correlation (DC genes) between ASD and CTL, the mean correlation values of matches were transformed to a z score (Fisher’s r to z transformation) and statistics combined (Fisher’s combined method). A gene was called differentially correlated if the differential correlation p-value was less than 0.01 (DiffCorP < 0.01) and FDR < 0.05 in CTL. The final list consisted of genes that are differentially correlated using both fMRI measurements.
Fig. 2
Fig. 2. Imaging differences between ASD and CTL.
a Differences between ASD and CTL calculated by Cohen’s d (effect sizes) derived from ASD–CTL comparison for both rs-fMRI measurements across the ROIs analyzed. b Scatter plot depicting the spatial correlation between Cohen’s d values of fALFF and ReHo. Each dot corresponds to the ROI analyzed.
Fig. 3
Fig. 3. Overview of differentially correlated genes.
a Schematic workflow to define differentially correlated genes. b Barplot depicting the number of differentially correlated genes positively (purple) and negatively (yellow) correlated with CTL. c Density plot depicting the distribution of differential correlation effect sizes (z). Line corresponds to the p value cutoff used. Genes of interest are highlighted with a gradient color that reflects the relative effect size. P-value threshold for Differential Correlation analysis is shown based on Fisher’s combined P-value. d Upset plot showing the intersection between the genes significantly correlated only in CTL for both fALFF and ReHo and two previous rs-fMRI—gene expression studies using only data from neurotypical individuals. e Upset plot showing the intersection between DC genes and two previous rs-fMRI—gene expression studies using only data from neurotypical individuals. f Scatterplots showing the relationship (Spearman’s rank correlation) between rs-fMRI (Y-axis) and gene expression for two candidate genes (X-axis) in CTL and ASD. g Gradient of CTL expression (PC1), PVALB, and SCN1B gene expression. Bar plot depicts the correlation between PVALB and SCN1B gene expression with ReHo, fALFF, expression PC1, and expression PC2.
Fig. 4
Fig. 4. Differentially correlated genes in individuals with ASD are important for brain development.
a The 415 genes were clustered in three developmental time groups: adult (Adult), early development (EarlyDev), stable (Stable). X-axis represents developmental time. Y-axis represents the expression based on human brain developmental time. Loess regression with confidence intervals depicts the overall distribution. Smooth curves are shown with 95% confidence bands with relative trendlines. b Bubblechart representing the functional enrichment for modules associated with developmental time. Y-axis corresponds to the odds ratio, X-axis corresponds to the −log10(FDR). c Bar plot depicting the −log10(FDR) of the Fisher’s exact test enrichment between developmental clusters and cell-type markers (Y-axis) from single-nuclei RNA-seq from multiple brain regions (“Methods”). VLMC=vascular leptomeningeal cell, Peri=pericytes, OPC=oligodendrocyte precursor cell, Micro=microglia, Inh=inhibitory neuron, Exc=excitatory neuron, Endo=endothelial cell, Astro=astrocyte. d Bar plot depicting the −log10(FDR) of the Fisher’s exact test enrichment between developmental clusters and genes differentially regulated in ASD, schizophrenia (SCZ), and bipolar disorder (BD) (Y-axis) from an independent study (“Methods”).
Fig. 5
Fig. 5. Leave one region out (LoRo) analysis underscores the importance of specific brain regions.
a Brain visualizations and violin plots depicting the contribution of each ROI in the differential correlation after the specific region was removed (LoRo). Brain visualizations represent the −log10(FDR) of the comparative analysis between ROIs after LoRo analysis (One-sided Wilcoxon’s rank sum test). Violins represent the Z-score (Y-axis) of differential correlation after the specific region (X-axis) was removed. **** corresponds to a significant lower Z-score compared with other regions (p < 0.001; One-sided Wilcoxon’s rank sum test). Dots represent the mean Z-score for the specific Brodmann area. Lines represent the standard deviation (SD). N = 415 genes from independent analysis. Exact P-value: BA17 p < 2e−16, BA20_37 p < 2e−16, BA38 p = 6.8e−05, BA39_40 p < 2e−16, BA4_6 p < 2e−16. b Bubblechart with −log10(FDR) and Odds Ratio from Fisher’s Exact test representing enrichment between developmental groups and genes differentially expressed in each region. X-axis shows abbreviations for each region. Y-axis represents each developmental cluster identified.

Similar articles

Cited by

References

    1. Hawrylycz M, et al. Canonical genetic signatures of the adult human brain. Nat. Neurosci. 2015;18:1832–1844. doi: 10.1038/nn.4171. - DOI - PMC - PubMed
    1. Hawrylycz MJ, et al. An anatomically comprehensive atlas of the adult human brain transcriptome. Nature. 2012;489:391–399. doi: 10.1038/nature11405. - DOI - PMC - PubMed
    1. Lein ES, Belgard TG, Hawrylycz M, Molnar Z. Transcriptomic perspectives on neocortical structure, development, evolution, and disease. Annu Rev. Neurosci. 2017;40:629–652. doi: 10.1146/annurev-neuro-070815-013858. - DOI - PubMed
    1. Anderson, K. M. et al. Heritability of individualized cortical network topography. Proc Natl Acad. Sci. USA10.1073/pnas.2016271118 (2021). - PMC - PubMed
    1. Grasby, K. L. et al. The genetic architecture of the human cerebral cortex. Science10.1126/science.aay6690 (2020). - PubMed

Publication types

MeSH terms