. 2022 Jun 9;12(1):9510.
doi: 10.1038/s41598-022-12751-y.

Elevated plasma level of the glycolysis byproduct methylglyoxal on admission is an independent biomarker of mortality in ICU COVID-19 patients

Affiliations

Elevated plasma level of the glycolysis byproduct methylglyoxal on admission is an independent biomarker of mortality in ICU COVID-19 patients

Fadhel A Alomar et al. Sci Rep. .

Abstract

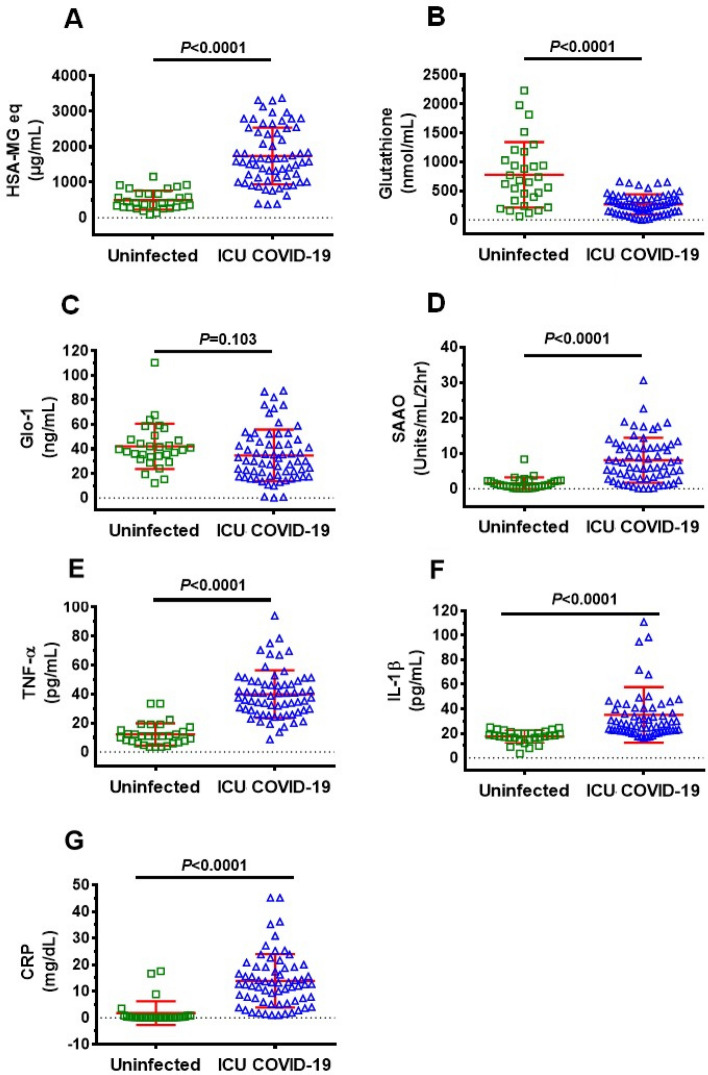
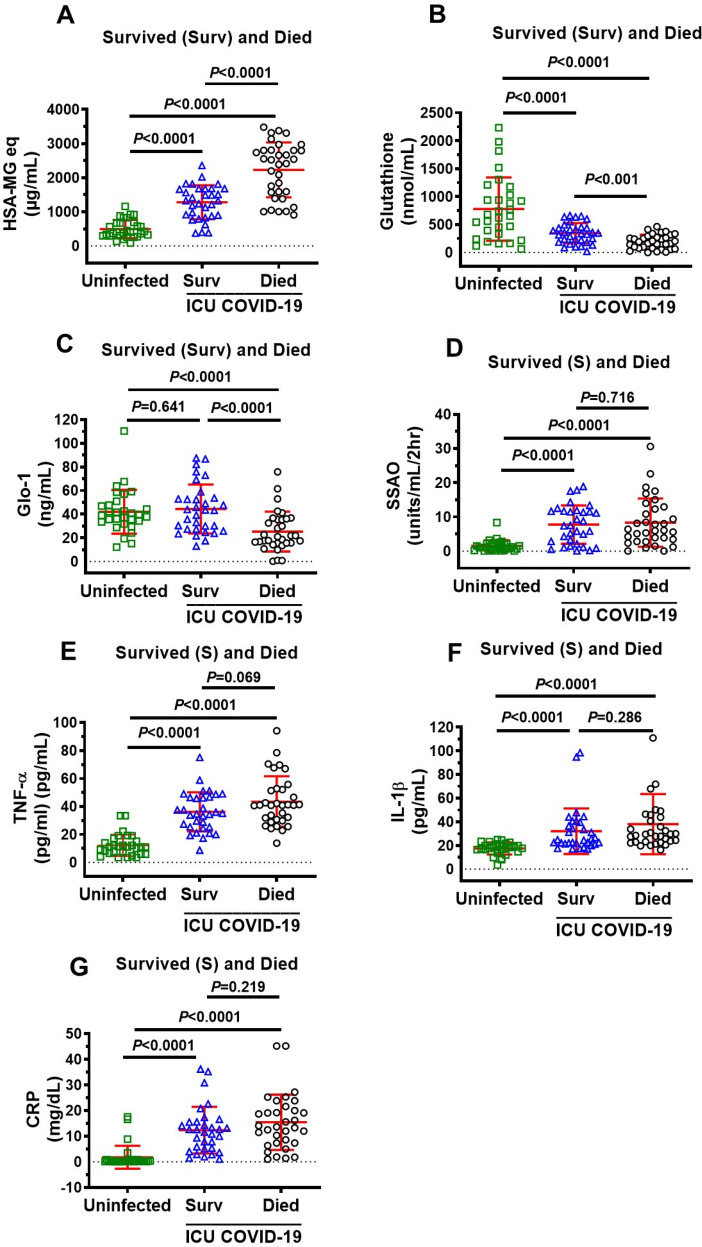
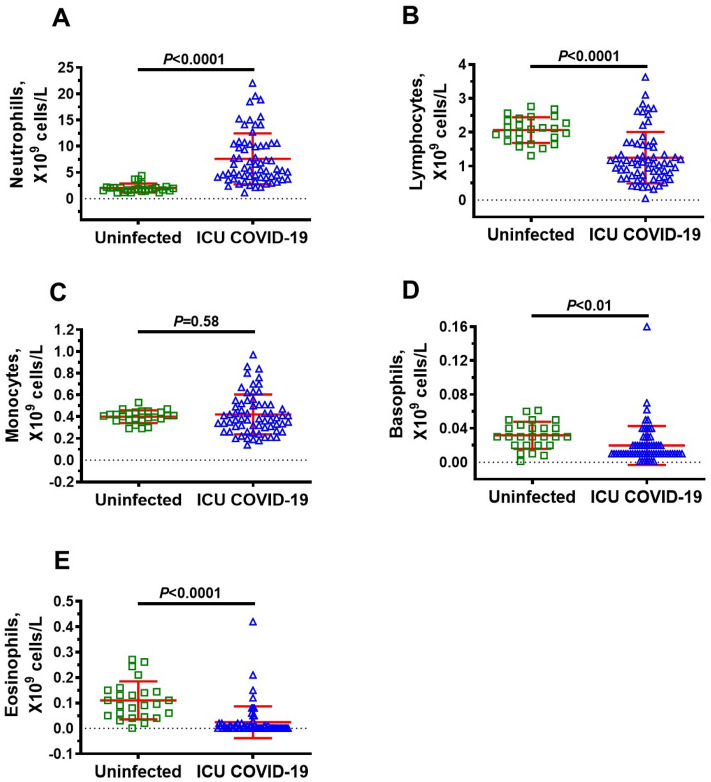
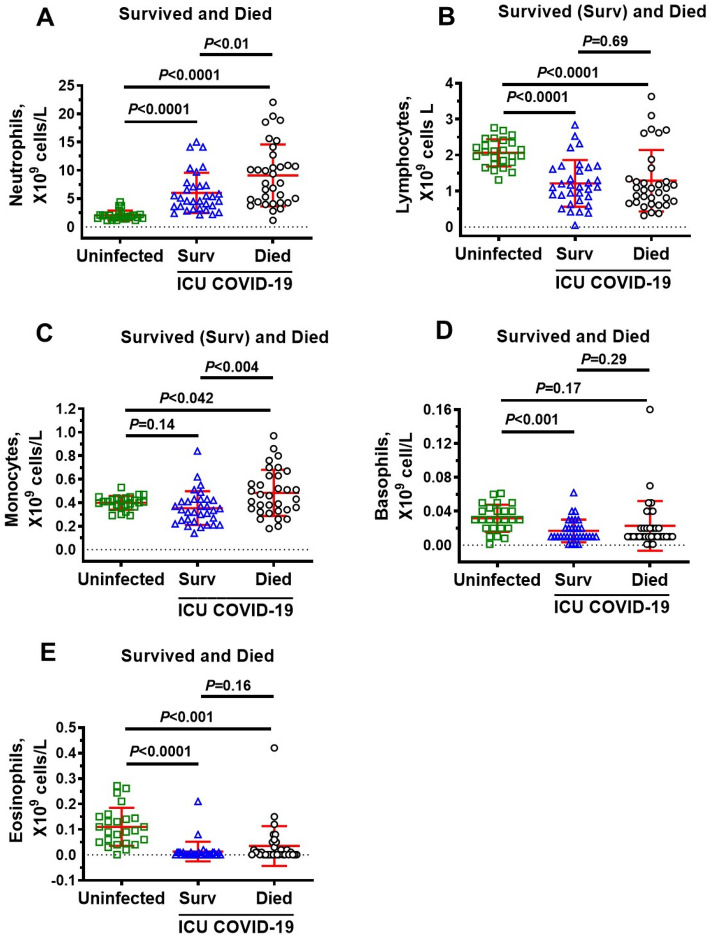
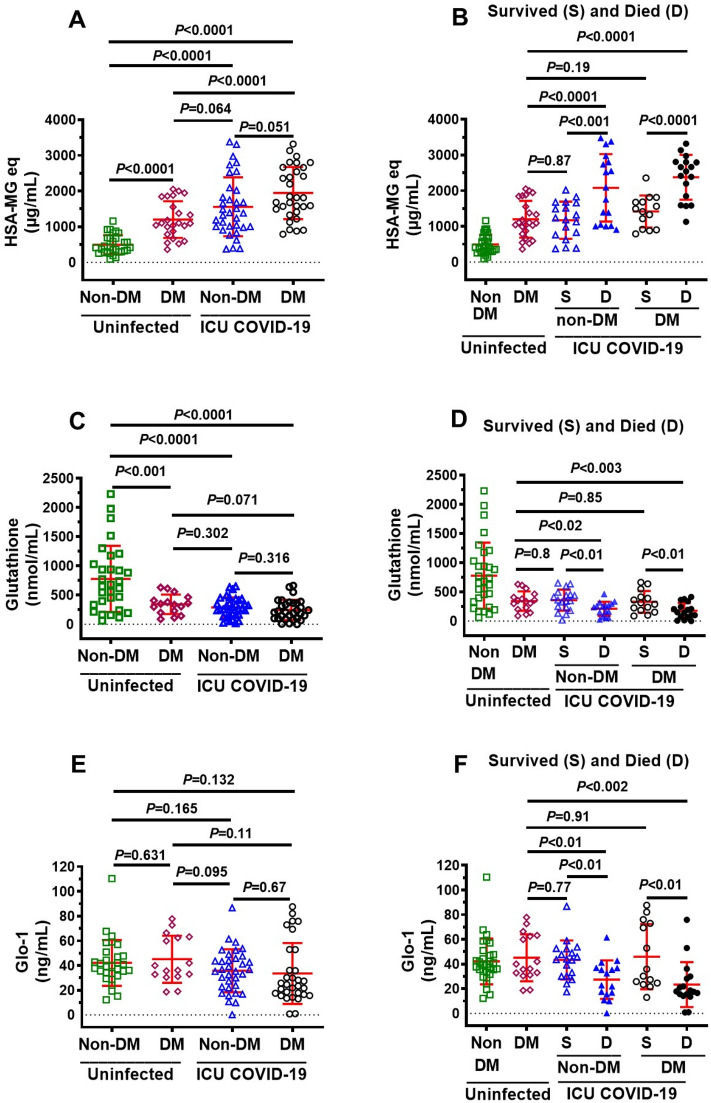
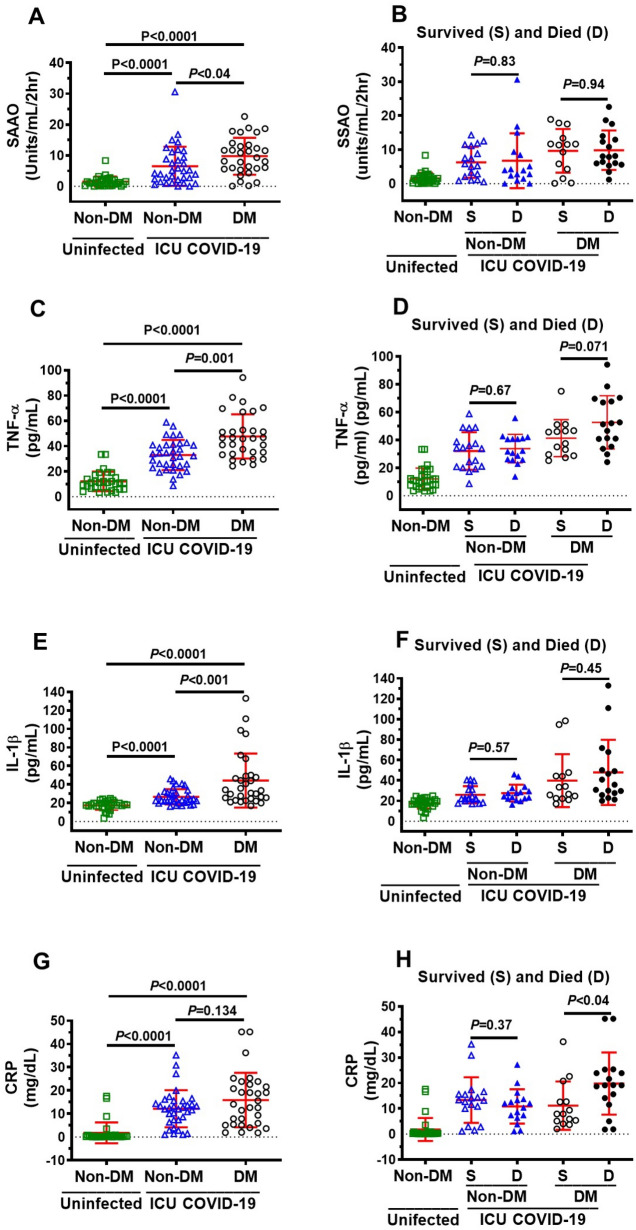
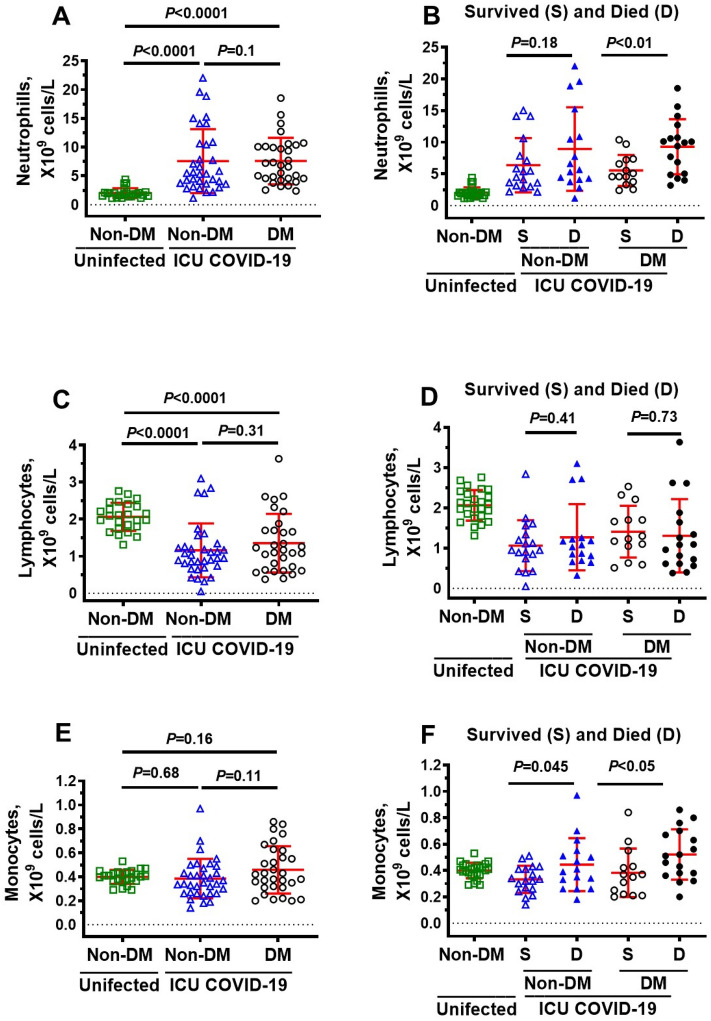
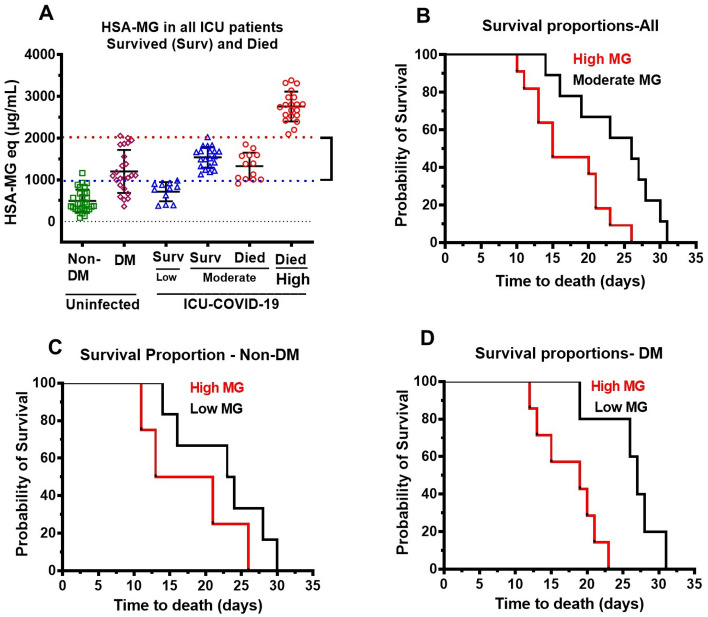
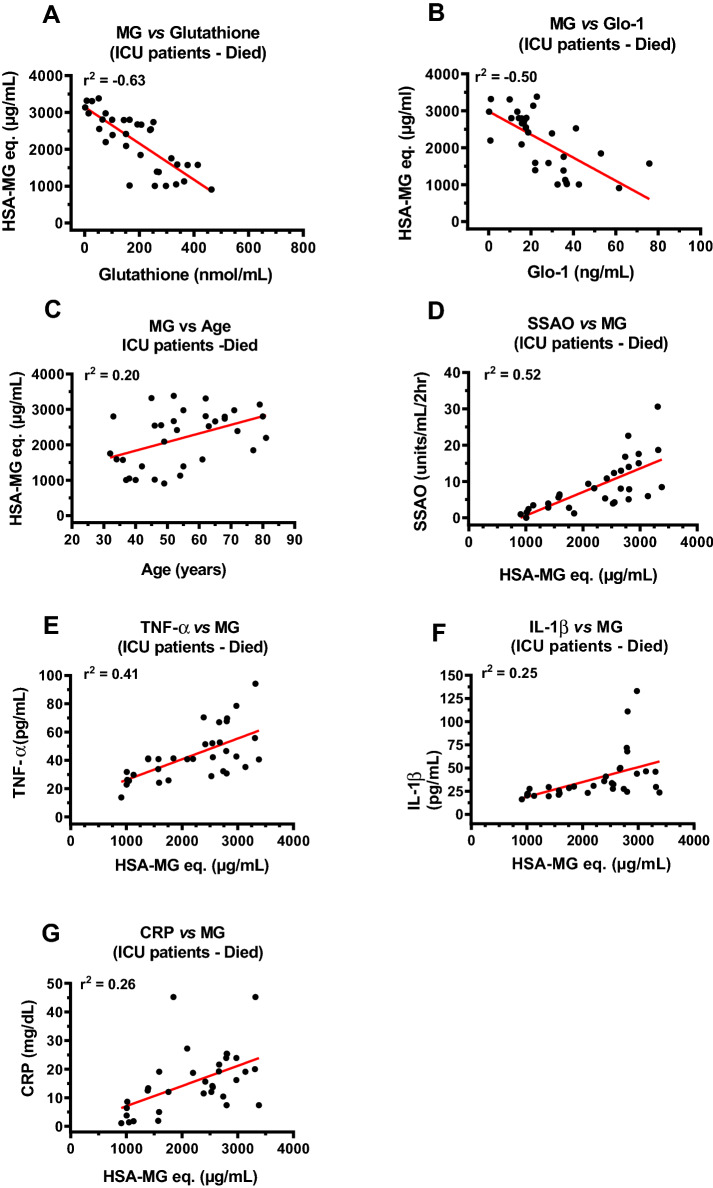
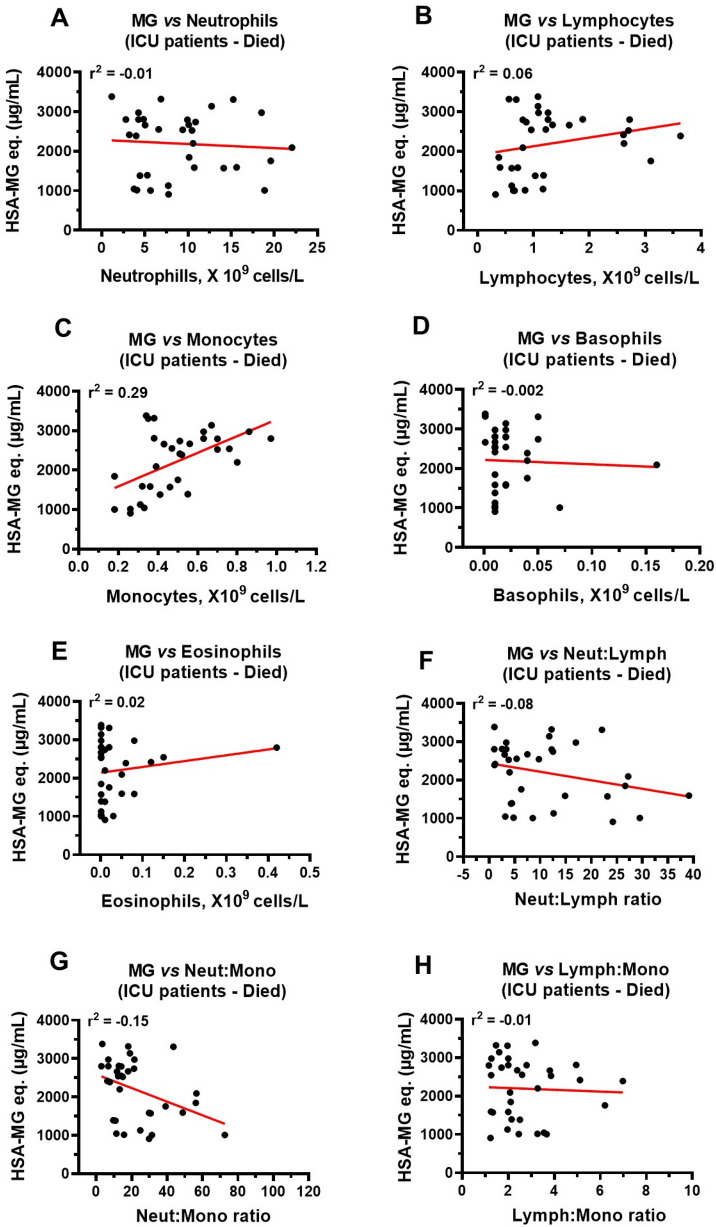
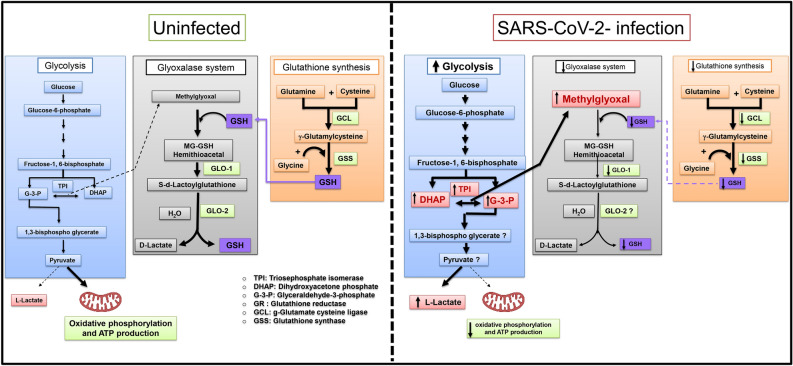
Biomarkers to identify ICU COVID-19 patients at high risk for mortality are urgently needed for therapeutic care and management. Here we found plasma levels of the glycolysis byproduct methylglyoxal (MG) were 4.4-fold higher in ICU patients upon admission that later died (n = 33), and 1.7-fold higher in ICU patients that survived (n = 32),compared to uninfected controls (n = 30). The increased MG in patients that died correlated inversely with the levels of the MG-degrading enzyme glyoxalase-1 (r2 = - 0.50), and its co-factor glutathione (r2 = - 0.63), and positively with monocytes (r2 = 0.29). The inflammation markers, SSAO (r2 = 0.52), TNF-α (r2 = 0.41), IL-1β (r2 = 0.25), CRP (r2 = 0.26) also correlated positively with MG. Logistic regression analysis provides evidence of a significant relationship between the elevated MG upon admission into ICU and death (P < 0.0001), with 42% of the death variability explained. From these data we conclude that elevated plasma MG on admission is a novel independent biomarker that predicts mortality in ICU COVID-19 patients.


Conflict of interest statement

The authors declare no competing interests.

Figures

Figure 1
Figure 1
Plasma levels of MG, glutathione, Glo1 SSAO, TNF-α, IL-1β and CRP in uninfected control and ICU COVID-19 patients. (A) MG levels (detected as its surrogate, HSA-MG) were significantly higher in ICU COVID-19 patients compared to uninfected controls. (B) Glutathione levels were significantly lower in ICU COVID-19 patients compared to uninfected controls. (C) Glo1 levels in ICU COVID-19 patients were not significantly different from uninfected controls. (DG) SSAO, TNF-α, IL-1β and CRP levels were significantly higher in ICU COVID-19 patients compared to uninfected controls, respectively. Data shown are for each patient with mean ± S.E.M from n = 30 uninfected controls (26.6% females) and n = 65 ICU COVID-19 patients (29.3% females). Statistical significances are shown above sets of data points on the graphs.
Figure 2
Figure 2
Plasma levels of MG, glutathione, Glo1, SSAO activity, TNF-α, IL-1β and CRP in uninfected controls and ICU COVID-19 patients that survived and died. (A) MG levels in plasma from ICU COVID-19 patients that survived and died were significantly higher than that in uninfected controls. MG levels in plasma from ICU COVID-19 that died were also significantly higher than ICU COVID-19 patients that survived. (B) Glutathione in plasma from ICU COVID-19 patients that survived and died were significantly lower than that in uninfected controls. Glutathione levels in plasma from ICU COVID-19 that died were also significantly lower than ICU COVID-19 patients that survived. (C) Glo1 in plasma from ICU COVID-19 patients that survived were not significantly different from that in uninfected controls. Glo1 levels in plasma from ICU COVID-19 patients that died were significantly lower than that in uninfected controls and ICU COVID-19 patients that survived. (D) SSAO activities in plasma from ICU COVID-19 patients that survived and died were significantly higher than that in uninfected controls. However, there were no significant difference in plasma SSAO activities between ICU COVID-19 patients that survived and died. (E) TNF-α levels in plasma from ICU COVID-19 patients that survived and died were significantly higher than that in uninfected controls. However, there were no significant difference in plasma levels of TNF-α in ICU COVID-19 patients that survived and died. (F) IL-1β levels in plasma from ICU COVID-19 patients that survived and died were significantly higher than that in uninfected controls. However, there were no significant difference in plasma levels of IL-1β in ICU patients that survived and died. (G) CRP levels in plasma from ICU COVID-19 patients that survived and died were significantly higher than that in uninfected controls. However, there were no significant difference in plasma levels of CRP in ICU patients that survived and died. Data shown are mean ± S.E.M from n = 30 in uninfected controls (26.6% females), n = 33 died (42.4% females) and n = 32 in survived (37.5% females). Statistical significance levels are shown above data points on each graph.
Figure 3
Figure 3
Plasma levels of neutrophils, lymphocytes, monocytes, basophils and eosinophils in uninfected control and ICU COVID-19 patients. (A) Neutrophils levels were significantly higher in ICU COVID-19 patients than that in uninfected controls. (B) Lymphocytes levels were significantly lower in ICU COVID-19 patients than that in uninfected controls. (C) Monocytes levels in ICU COVID-19 patients were not significantly different from uninfected controls. (D, E) Basophils and eosinophils levels were significantly lower in ICU COVID-19 patients compared to uninfected controls, respectively. Data shown are for each patient with mean ± S.E.M from n = 30 uninfected controls (26.6% females) and n = 65 ICU COVID-19 patients (29.3% females). Statistical significances are shown above sets of data points on the graphs.
Figure 4
Figure 4
Plasma levels of neutrophils, lymphocytes, monocytes, basophils and eosinophils in uninfected non-DM individuals and ICU COVID-19 patients that survived and died. (A) Neutrophils levels in blood from ICU COVID-19 patients that survived and died were significantly higher than that in uninfected controls. Neutrophils levels in blood from ICU COVID-19 that died were also significantly higher than ICU COVID-19 patients that survived. (B) Lymphocytes in blood from ICU COVID-19 patients that survived and died were significantly lower than that in uninfected controls. However, there were no significant difference in blood levels of lymphocytes in ICU COVID-19 patients that survived and died. (C) Monocytes in blood from ICU COVID-19 patients that survived were not significantly different from that in uninfected controls. However, monocytes levels in blood from ICU COVID-19 patients that died were significantly higher than that in uninfected controls and ICU COVID-19 patients that survived. (D) Basophils levels in blood from ICU COVID-19 patients that survived but not died were significantly higher than that in uninfected controls. There was no significant difference in blood basophils levels between ICU COVID-19 patients that died and survived. (E) Eosinophils levels in blood from ICU COVID-19 patients that survived and died were significantly higher than that in uninfected controls. However, there were no significant difference in blood levels of eosinophils in ICU COVID-19 patients that survived and died. Data shown are mean ± S.E.M from n = 30 in uninfected controls (26.6% females), n = 33 died (42.4% females) and n = 32 in survived (37.5% females). Statistical significance levels are shown above data points on each graph.
Figure 5
Figure 5
Plasma levels of MG, glutathione, and Glo-1 in ICU COVID-19 patients without diabetes mellitus (non-DM) and with diabetes (DM) and separated into those that survived and those that died. (A) MG levels were significantly higher in non-DM ICU COVID-19 patients compared to uninfected non-DM but not uninfected DM individuals. There was a significant difference in MG levels between DM ICU COVID-19 patients and uninfected non-DM or uninfected DM individuals. There was not a significant difference in MG levels between non-DM ICU COVID-19 and DM ICU COVID-19. (B) Plasma of MG in non-DM and DM ICU COVID-19 patients that died were significantly higher than that survived. There was not a significant difference in MG levels between DM ICU COVID-19 patients that survived and uninfected DM individuals. However, there was a significant difference in MG levels between non-DM ICU COVID-19 patients that died and uninfected DM individuals. (C) Glutathione levels were significantly lower in non-DM and DM ICU COVID-19 patients than that in uninfected non-DM individuals. There were no significant differences in glutathione levels in non-DM and DM ICU COVID-19 patients compared to uninfected DM individuals. (D) Plasma of glutathione levels in non-DM and DM ICU COVID-19 patients that died had significantly lower than that in patients that survived. There was also a significant difference in MG levels of non-DM and DM ICU COVID-19 that died compared to uninfected DM individuals. There was not a significant difference in glutathione levels between non-DM and DM ICU COVID-19 patients that survived and uninfected DM individuals. (E) Glo1 levels in plasma of non-DM and DM ICU COVID-19 patients were not significantly different from that of uninfected non-DM or uninfected DM individuals. (F) Plasma of Glo1 levels in non-DM and DM ICU COVID-19 patients that died had significantly lower than that in non-DM and DM ICU COVID-19 patients that survived. There were also significantly lower in Glo-1 plasma levels of non-DM and DM ICU COVID-19 patients that died compared to uninfected DM individuals. Data shown in (A, C, E) are mean ± S.E.M from each of the n = 30 uninfected controls (26.6% females), n = 34 for non-DM (33.3% females) and n = 31 for DM (25.8% females). Data shown in (B, D, F) are mean ± S.E.M for each of the n = 30 in uninfected controls (26.6% females), n = 18 in non-DM survived (44.4% females), n = 16 in non-DM died (30.7% females), n = 14 DM in survived (28.6% females), and n = 17 in DM died (37.5% females) groups. Statistical significances are shown above data points on each graph.
Figure 6
Figure 6
Plasma SSAO activities and levels of TNF-α, IL-1β and CRP in ICU COVID-19 patients without diabetes mellitus (non-DM) and with diabetes (DM) and separated into those that survived and those that died. (A) SSAO activities in plasma from non-DM and DM ICU COVID-19 patients were significantly higher than uninfected non-DM individuals. There was also a significant difference in plasma SSAO activities between non-DM and DM ICU COVID-19 patients. (B) No significant differences in SSAO activities in plasma from non-DM and DM ICU COVID-19 patients that died and survived. (C) TNF-α levels in plasma from non-DM and DM ICU COVID-19 patients were significantly higher than uninfected non-DM individuals. There was a significant difference in TNF-α in plasma from non-DM and DM ICU COVID-19 patients. (D) No significant differences in plasma levels of TNF-α in non-DM and DM ICU COVID-19 patients that died and survived. (E) IL-1β levels in plasma of non-DM and DM ICU COVID-19 patients were significantly higher than that in uninfected non-DM individuals. IL-1β levels in plasma from ICU COVID-19 with DM were also significantly higher than of ICU-COVID-19 patients without DM. (F) No significant difference in plasma levels of IL-1β in non-DM and DM ICU COVID-19 patients that died and survived. (G) Significantly higher CRP in plasma from non-DM and DM ICU COVID-19 patients compared to uninfected non-DM individuals. CRP in plasma from DM ICU COVID-19 was not significantly higher than non-DM ICU-COVID-19 patients. (H) Significant difference in plasma levels of CRP between DM ICU COVID-19 patients that died and survived. However, there was not significant differences in plasma levels of CRP in non-DM ICU COVID-19 patients between died and survived. Data shown in (A, C, E, G)are mean ± S.E.M from n = 30 in uninfected non-DM individuals (26.6% females), n = 34 in non-DM (33.3% females) and n = 31 in DM (25.8% females) group. Data shown in (B, D, F, H) are mean ± S.E.M from n = 30 in uninfected non-DM individuals (26.6% females), n = 18 in non-DM survived (44.4% females), n = 16 in non-DM died (30.7% females), n = 14 DM in survived (28.6% females), and n = 17 in DM died (37.5% females) groups. Statistical significances are shown above data points on each graph.
Figure 7
Figure 7
Blood levels of neutrophils, lymphocytes, and monocytes in ICU COVID-19 patients without diabetes mellitus (non-DM) and with diabetes (DM) and separated into those that survived and those that died. (A) Neutrophils levels in blood from non-DM and DM ICU COVID-19 patients were significantly higher than uninfected non-DM individuals. There was also a significant difference in blood neutrophils levels between non-DM and DM ICU COVID-19 patients. (B) No significant differences in neutrophils levels in blood from non-DM ICU COVID-19 patients that died and survived. However, there was a significant difference in blood neutrophils levels between DM ICU COVID-19 patients that survived and died. (C) Lymphocytes levels in blood from non-DM and DM ICU-COVID-19 patients were significantly higher than uninfected non-DM individuals. There was not a significant difference in lymphocytes levels in blood from non-DM and DM ICU COVID-19 patients. (D) No significant differences in blood levels of lymphocytes in non-DM and DM ICU COVID-19 patients that died and survived. (E) Monocytes levels in blood from non-DM and DM ICU COVID-19 patients were not significantly higher than uninfected non-DM individuals. Monocytes levels in blood from DM ICU COVID-19 were also not significantly higher than of non-DM ICU-COVID-19 patients. (F) Significant difference in blood levels of monocytes in non-DM and DM ICU COVID-19 patients that died and survived. Data shown in (A, C, E) are mean ± S.E.M from n = 30 in uninfected non-DM individuals (26.6% females), n = 34 in non-DM (33.3% females) and n = 31 in DM (25.8% females) group. Data shown in (B, D, F) are mean ± S.E.M from n = 30 in uninfected non-DM individuals (26.6% females), n = 18 in non-DM survived (44.4% females), n = 16 in non-DM died (30.7% females), n = 14 DM in survived (28.6% females), and n = 17 in DM died (37.5% females) groups. Statistical significances are shown above data points on each graph.
Figure 8
Figure 8
Blood levels of basophils and eosinophils in ICU COVID-19 patients without diabetes mellitus (non-DM) and with diabetes (DM) and separated into those that survived and those that died. (A) Basophils levels in blood from DM ICU-COVID-19 patients, but not non-DM ICU-COVID-19 were significantly higher than uninfected non-DM individuals. There was not a significant difference in blood basophils levels between non-DM ICU-COVID-19 and DM ICU-COVID-19 patients. (B) No significant differences in blood levels of basophils in non-DM and DM ICU COVID-19 patients that died and survived. (C) Eosinophils levels in blood from non-DM and DM ICU-COVID-19 patients were significantly higher than uninfected non-DM individuals. There was not a significant difference in eosinophils levels in blood from non-DM and DM ICU COVID-19 patients. (D) No significant differences in blood levels of eosinophils in non-DM and DM ICU COVID-19 patients that died and survived. Data shown in (A, C) are mean ± S.E.M from n = 30 in uninfected non-DM individuals (26.6% females), n = 34 in non-DM (33.3% females) and n = 31 in DM (25.8% females) group. Data shown in (B, D) are mean ± S.E.M from n = 30 in uninfected non-DM individuals (26.6% females), n = 18 in non-DM survived (44.4% females), n = 16 in non-DM died (30.7% females), n = 14 DM in survived (28.6% females), and n = 17 in DM died (37.5% females) groups. Statistical significances are shown above data points on each graph.
Figure 9
Figure 9
Kaplan–Meier curves for non-DM and DM ICU COVID-19 patients that died. (A) Low MG (< 2 times higher than uninfected non-DM), moderate MG (between 2 and 3 times higher than uninfected non-DM) and high MG (> 4times higher than uninfected non-DM) in ICU patients that survived and died along with MG in uninfected non-DM and DM individuals. Data shown are mean ± S.E.M for each of n = 30 uninfected controls (26.6% females), n = 11 survived for low, and n = 21 survived moderate. n = 13 died for moderate and n = 20 died, for high MG. (B) Kaplan–Meier survival curve for all ICU COVID-19 patients that died with moderate MG (n = 13) and high MG (n = 20). (C) Kaplan–Meier survival curve for non-DM ICU COVID-19 patients that died with moderate (n = 8) and high MG (n = 8). (D) Kaplan–Meier survival curve for DM ICU COVID-19 patients that died with moderate (n = 5) and high MG (n = 12).
Figure 10
Figure 10
Correlations between plasma MG and glutathione, Glo1, SSAO, TNF-α, IL-1β and CRP in ICU patients that died. (A, B) Strong inverse correlation between MG and glutathione (r2 = − 0.63), and MG and Glo1 (r2 = − 0.50) in ICU COVID-19 patients that died. (C) Weak correlation between plasma MG and age (r2 = 0.20) in ICU COVID-19 patients that died. (D) Strong positive correlation (r2 = 0.52) between plasma MG and SSAO activity in ICU patients that died. (E) Moderate positive correlation (r2 = 0.41) between plasma MG and TNF-α in ICU COVID-19 patients that died. (F, G) Weak correlation between plasma MG and IL-1β (r2 = 0.25) and between MG and CRP (r2 = 0.26) in ICU COVID-19 patients that died. Data in graphs are for n = 33 patients.
Figure 11
Figure 11
Correlations between plasma MG and neutrophils, lymphocytes, monocytes, basophils, and eosinophils in ICU patients that died. (A, B) No significant correlations between MG and neutrophils (r2 = − 0.01) and lymphocytes (r2 = 0.06) in ICU patients that died. (C) A significant correlation between plasma MG and monocytes (r2 = 0.29) in ICU COVID-19 patients that died. (DH) No significant correlations between MG and basophils (r2 = − 0.002), eosinophils (r2 = 0.02), neutrophil:lymphocyte ratio (r2 = − 0.08) neutrophil:monocyte ratio (r2 = − 0.15) and lymphocytes:monocytes ratio (r2 = − 0.01), respectively in ICU COVID-19 patients that died. Data in graphs are for n = 33 patients.
Figure 12
Figure 12
Overview of methylglyoxal (MG)formation via glycolysis and the degradation of the methylglyoxal-glutathione hemiacetal in uninfected and SARS-CoV-2 infected individuals. MG is formed from the interconversion of the dihydroxyacetone phosphate (DHAP) and glyceraldehyde-3-phosphate (G3P) via triosephosphate isomerase that generates MG. MG is detoxified by the dual-enzyme glyoxalase system. In the first step, the rate-limiting glyoxalase 1 (Glo1) converts the hemithioacetal formed between MG and reduced glutathione (MG-GSH) to the thioester S-d-lactoylglutathione. In the second step glyoxalase 2 (Glo2) enzyme catalyzes the hydrolysis of S-d-lactoylglutathione to form d-lactate. During this reaction, GSH is recycled. Following SARS-CoV-2 infection, glycolysis is upregulated in the infected cells and host immune cells. At the same time, Glo1 and GSH are down regulated, resulting in cytotoxic levels of MG.

References

    1. Johns Hopkins University and Medicine (2021). Coronavirus COVID-19 Global Cases by the Center for Systems Science and Engineering (CSSE). https://coronavirus.jhu.edu/map.html (2021). Accessed 20 May 2022.
    1. Pierron D, et al. Smell and taste changes are early indicators of the COVID-19 pandemic and political decision effectiveness. Nat. Commun. 2020;11:5152. doi: 10.1038/s41467-020-18963-y. - DOI - PMC - PubMed
    1. Du RH, et al. Hospitalization and critical care of 109 decedents with COVID-19 pneumonia in Wuhan, China. Ann. Am. Thorac. Soc. 2020;17:839–846. doi: 10.1513/AnnalsATS.202003-225OC. - DOI - PMC - PubMed
    1. Younis NK, Zareef RO, Maktabi MAN, Mahfouz R. The era of the coronavirus disease 2019 pandemic: A review on dynamics, clinical symptoms and complications, diagnosis, and treatment. Genet. Test. Mol. Biomark. 2021;25:85–101. doi: 10.1089/gtmb.2020.0227. - DOI - PubMed
    1. Amdal, C.D. et al. Health-related quality of life issues, including symptoms, in patients with active COVID-19 or post COVID-19; a systematic literature review. Qual. Life Res. (2021). - PMC - PubMed

Publication types