. 2022 Jun 9;13(1):3336.
doi: 10.1038/s41467-022-30957-6.

Profiling Fusobacterium infection at high taxonomic resolution reveals lineage-specific correlations in colorectal cancer

Affiliations

Profiling Fusobacterium infection at high taxonomic resolution reveals lineage-specific correlations in colorectal cancer

Dexi Bi et al. Nat Commun. .

Erratum in

Abstract

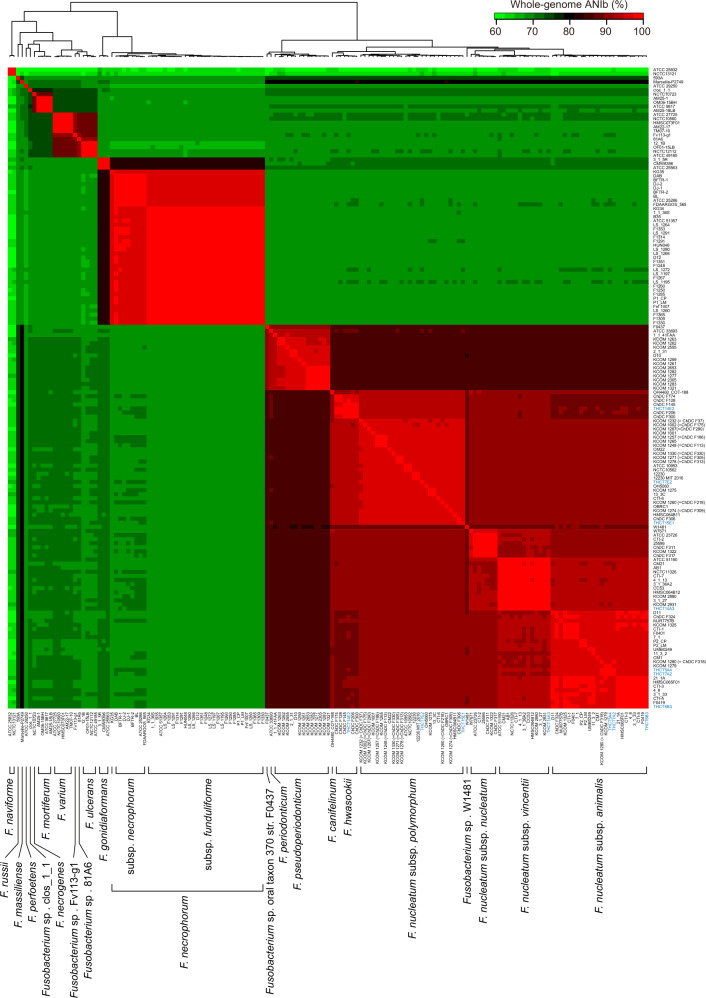
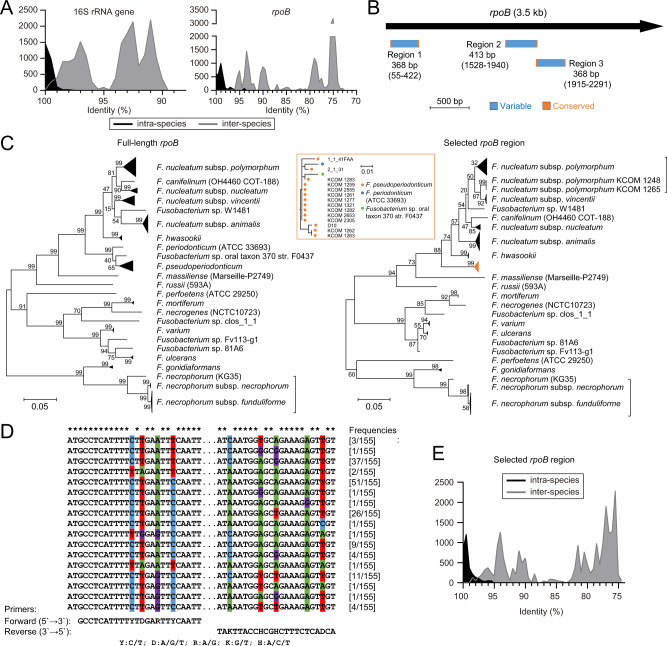
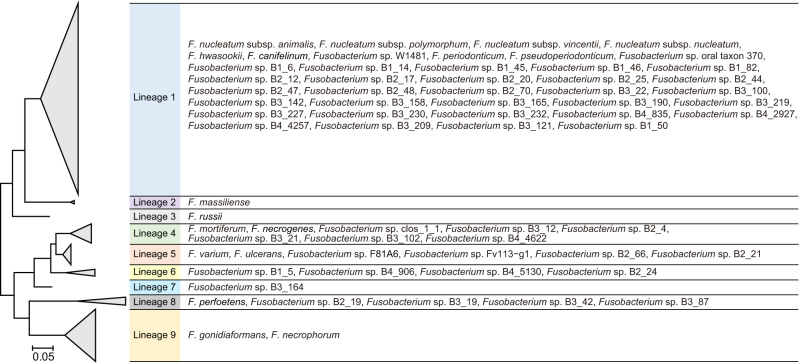
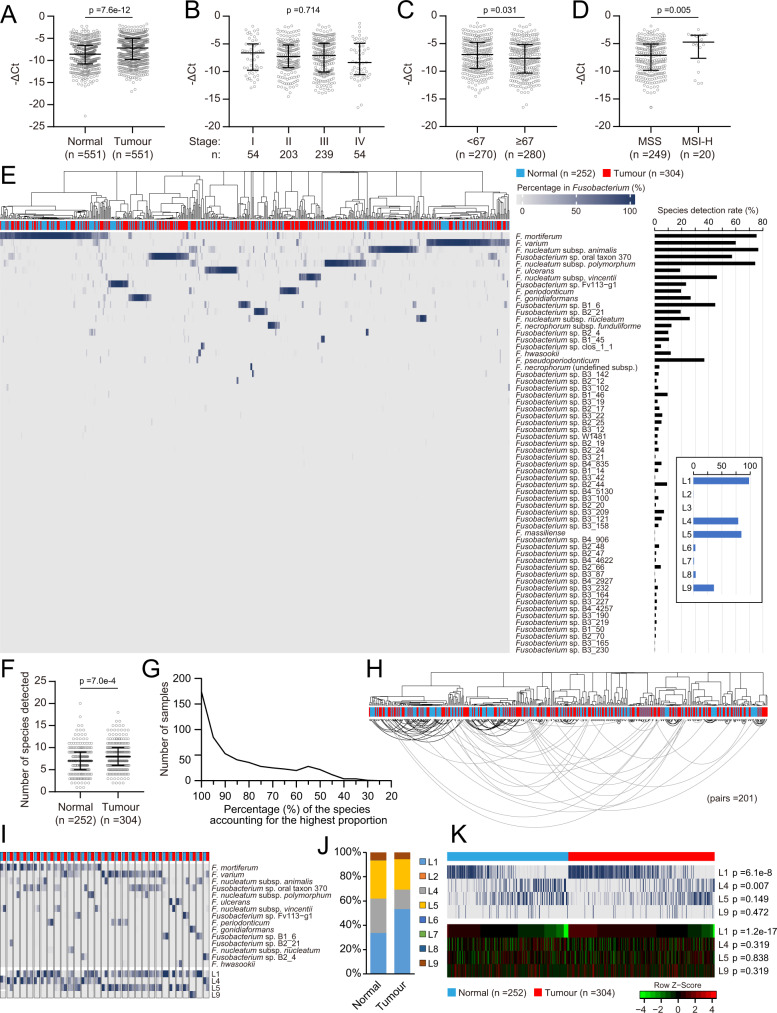
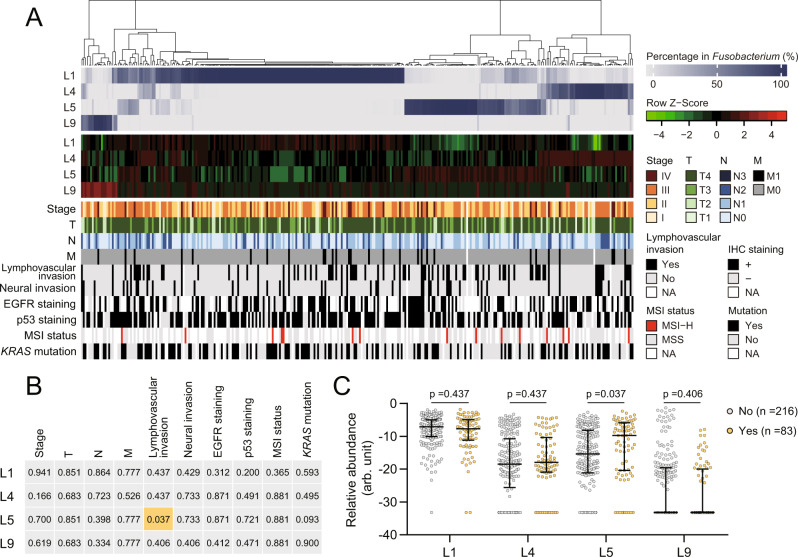
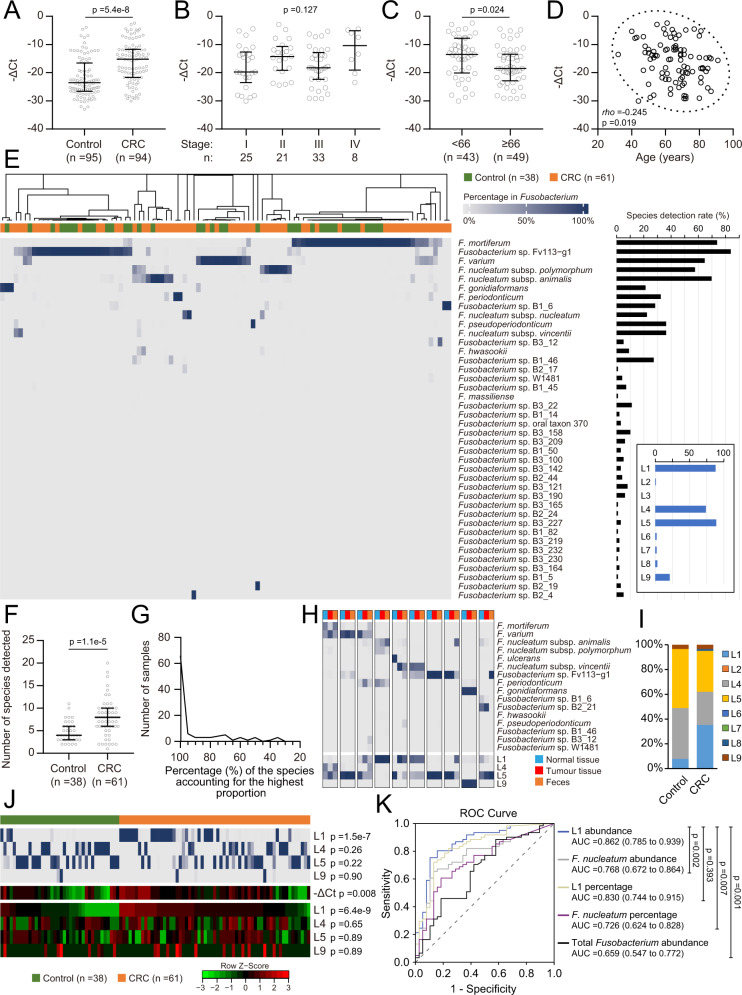
The bacterial genus Fusobacterium promotes colorectal cancer (CRC) development, but an understanding of its precise composition at the species level in the human gut and the relevant association with CRC is lacking. Herein, we devise a Fusobacterium rpoB amplicon sequencing (FrpoB-seq) method that enables the differentiation of Fusobacterium species and certain subspecies in the microbiota. By applying this method to clinical tissue and faecal samples from CRC patients, we detect 62 Fusobacterium species, including 45 that were previously undescribed. We additionally reveal that Fusobacterium species may display different lineage-dependent functions in CRC. Specifically, a lineage (designated L1) including F. nucleatum, F. hwasookii, F. periodonticum and their relatives (rather than any particular species alone) is overabundant in tumour samples and faeces from CRC patients, whereas a non-enriched lineage (designated L5) represented by F. varium and F. ulcerans in tumours has a positive association with lymphovascular invasion.


Conflict of interest statement

D.B., Y.Z., Q.W. and H.Q. are the inventors on a patent application (no. 202010246901.4; entitled ‘A molecular approach for the detection and species-level taxonomic identification of Fusobacterium in microbiota samples’) relating to the FrpoB-seq method filed by the Shanghai Tenth People’s Hospital. The remaining authors declare no competing interests.

Figures

Fig. 1
Fig. 1. Whole-genome ANIb analysis effectively defined Fusobacterium species and reclassified mislabelled species annotations for genomes in the NCBI database.
A total of 157 Fusobacterium genomes were used for pairwise ANIb analysis. A 157 × 157 matrix of ANIb values (Supplementary Data 2) calculated for all strains in a pairwise manner is presented as a heatmap. Strain names are listed on the right side of and under the heatmap. Blue names denote strains sequenced in this study. The resulting species/subspecies designation is shown at the bottom. ANIb, average nucleotide identity calculated with BLAST.
Fig. 2
Fig. 2. Development of a rpoB-based approach for Fusobacterium differentiation at the species level.
A Distributions of pairwise intra- and inter-species identities of the 16S rRNA (n = 2610 and n = 17,696, respectively) and rpoB genes (n = 3068 and n = 20,802, respectively) from the genomes. B Locations of three candidate regions compatible with amplicon sequencing found in rpoB. The reference length and coordinates (in parentheses) in the rpoB gene of F. nucleatum subsp. nucleatum ATCC 25586 are given. Region 1 was selected for further study. C Phylogenetic trees of full-length rpoB and their corresponding selected rpoB region. Strain names are given in parentheses for the species with only one sequenced genome available. Branches of the same species/subspecies or those otherwise illustrated in the orange box (corresponding to the orange triangle) are compressed as applicable. There is an exception in the sub-tree of F. necrophorum subsp. funduliforme, which is illustrated in Fig. S3. Strain names are also provided for those that could not be compressed together. D Alignment of the non-redundant terminal conserved sequences of the selected rpoB region and universal primers designed based on these conserved regions. Asterisks denote consensus bases. Variations are denoted by nucleotide-specific colour shades. E Distribution of pairwise intra- and inter-species identities of the selected rpoB region (n = 3068 and n = 20,802, respectively). Complete gene sequences available in the sequenced genomes were used for analysis (144 16S rRNA gene and 155 rpoB sequences). F. naviforme genomes (n = 2) were not included. The analysis considered the four F. nucleatum subspecies as separate species. Source Data are provided as a source data file.
Fig. 3
Fig. 3. Fusobacterium had diverse species members and could be divided into nine phylogenetic lineages.
Newly identified and previously known species (except F. naviforme) were included. The tree was based on the corresponding sequences in the genomes or obtained via FrpoB-seq. Branches of the same lineages are compressed with lineage names shaded in different colours, and the names of species belonging to those lineages are listed accordingly. See also Fig. S5 for the full tree.
Fig. 4
Fig. 4. Compositional features of the Fusobacterium communities in colorectal cancer tissues.
A Relative abundance of total Fusobacterium among bacteria in tumour and adjacent normal tissues. The p value of Mann–Whitney test is shown while that of Wilcoxon matched-pair signed-rank test is 8 × 1e–30. B Relative abundance of Fusobacterium in tumour tissues of different stages. Kruskal–Wallis test followed by Dunn’s multiple comparison test. The p value of Kruskal–Wallis test is shown. C Relative abundance of Fusobacterium in tumour tissues of different age groups separated by the median age. Mann-Whitney test. D Relative abundance of Fusobacterium in tumour tissues grouped by MSI status. Mann–Whitney test. E Fusobacterium species detected in tumour and normal tissues. Their percentages in the Fusobacterium community of each sample are presented as a heatmap. The black or blue histogram on the right shows the detection rate of each species or defined lineage in the samples, respectively. F Numbers of detected species in tumour and normal tissues. Mann–Whitney test. G Distribution of the percentage of the most abundant Fusobacterium species in each sample. H Dendrogram based on the Fusobacterium species compositions (Fig. S9) of 201 paired tumour and normal tissues. Paired samples are connected by lines. The grey lines indicate the paired samples located on separate major branches while black lines indicate otherwise. I Fusobacterium species compositions showing different patterns in paired tumour and normal tissues. The colour gradient scheme is the same as that in (G). Species with a <5% proportion are not shown. J Overall Fusobacterium lineage compositions in the tumour and normal tissues. L, lineage. K Percentages in Fusobacterium communities (upper heatmap) and estimated relative abundance among bacteria (lower heatmap) of the defined lineages compared between tumour and normal tissues. Lineages with low detection rates were not included; Mann-Whitney test followed by the Benjamini-Hochberg correction. Adjusted p values are shown. For AD and F, individual data points are shown along with the medians and interquartile ranges. All statistical analyses are two-sided where applicable. Source data are provided as a source data file and in supplementary data 3.
Fig. 5
Fig. 5. Lineage 5 was enriched in tumour samples associated with lymphovascular invasion.
A A heatmap showing the percentages in Fusobacterium communities and estimated relative abundance among bacteria in tumours and corresponding pathological characteristics were included for analysis. B Associations between lineage abundance and pathological characteristics. For each pathological characteristic, patients were grouped by the corresponding categories listed in (A), and lineage abundance was compared. The p values are summarised with orange and grey shades denoting significant and insignificant results. See (C) and Fig. S10 for details of comparison and statistical analyses. C L5 abundance showed an association with lymphovascular invasion. Mann-Whitney test (two-sided) followed by the Benjamini-Hochberg correction. Adjusted p values are shown. Individual data points are shown along with the medians and interquartile ranges. arb. unit, arbitrary unit. See Supplementary Data 3 and  4 for detailed data.
Fig. 6
Fig. 6. FrpoB-seq identified similar Fusobacterium patterns in faeces and that lineage 1 abundance was predictive of CRC.
A Relative abundance of total Fusobacterium among bacteria in faecal samples from colorectal cancer (CRC) patients and healthy controls. Mann–Whitney test. B Relative abundance of Fusobacterium in faecal samples from CRC patients at different stages. Kruskal–Wallis test was followed by Dunn’s multiple comparison test. The p value of Kruskal–Wallis test is shown. C Relative abundance of Fusobacterium in faecal samples from CRC patients in different age groups separated by the median age. Mann–Whitney test. D Correlation analysis between the relative abundance of Fusobacterium in faecal samples and patient age. Spearman correlation test. E Fusobacterium species compositions were detected in the faecal samples from CRC patents and healthy controls. The black or blue histogram on the right indicates the detection rate of each species or defined lineage, respectively. F The number of detected species in faecal samples. Mann–Whitney test. G Distribution of the percentage of the most abundant species in each sample. H Fusobacterium species compositions in faecal samples and matching normal and tumour tissues. Species with a <5% proportion are not shown. L, lineage. I Overall Fusobacterium lineage compositions in the CRC and control faecal samples. J Percentages in the Fusobacterium community (upper heatmap) and estimated relative abundance among bacteria (lower heatmap) of the defined lineages compared between CRC and control. The scale in E is applicable to the percentage heatmap. Lineages with low detection rates were not included. The Mann–Whitney test followed by the Benjamini–Hochberg correction was used, and adjusted p values are shown. K Receiver operating characteristic (ROC) curve for predicting CRC. AUC, the area under the ROC curve. In brackets are the 95% confidence intervals. The data were obtained from the participants in (E). Pairwise comparisons of ROC curves were conducted with MedCalc (the DeLong method) followed by the Benjamini–Hochberg correction, and adjusted p values are shown. For (A)–(C) and (F), medians and interquartile ranges are shown. All statistical analyses are two-sided where applicable. Source Data are provided as a source data file and in Supplementary data 3.

References

    1. Wong, S. H. & Yu, J. Gut microbiota in colorectal cancer: mechanisms of action and clinical applications. Nat. Rev. Gastroenterol. Hepatol.16, 690–704 (2019). - PubMed
    1. Zhou, Z., Chen, J., Yao, H. & Hu, H. Fusobacterium and colorectal cancer. Front Oncol.8, 371 (2018). - PMC - PubMed
    1. Brennan, C. A. & Garrett, W. S. Fusobacterium nucleatum - symbiont, opportunist and oncobacterium. Nat. Rev. Microbiol.17, 156–166 (2019). - PMC - PubMed
    1. Kostic, A. D. et al. Genomic analysis identifies association of Fusobacterium with colorectal carcinoma. Genome Res.22, 292–298 (2012). - PMC - PubMed
    1. Castellarin, M. et al. Fusobacterium nucleatum infection is prevalent in human colorectal carcinoma. Genome Res.22, 299–306 (2012). - PMC - PubMed

Publication types

MeSH terms

LinkOut - more resources