. 2022 Jun;54(6):850-860.
doi: 10.1038/s41588-022-01082-3. Epub 2022 Jun 9.

Genomic analysis defines clonal relationships of ductal carcinoma in situ and recurrent invasive breast cancer

Collaborators, Affiliations

Genomic analysis defines clonal relationships of ductal carcinoma in situ and recurrent invasive breast cancer

Esther H Lips et al. Nat Genet. 2022 Jun.

Abstract

Ductal carcinoma in situ (DCIS) is the most common form of preinvasive breast cancer and, despite treatment, a small fraction (5-10%) of DCIS patients develop subsequent invasive disease. A fundamental biologic question is whether the invasive disease arises from tumor cells in the initial DCIS or represents new unrelated disease. To address this question, we performed genomic analyses on the initial DCIS lesion and paired invasive recurrent tumors in 95 patients together with single-cell DNA sequencing in a subset of cases. Our data show that in 75% of cases the invasive recurrence was clonally related to the initial DCIS, suggesting that tumor cells were not eliminated during the initial treatment. Surprisingly, however, 18% were clonally unrelated to the DCIS, representing new independent lineages and 7% of cases were ambiguous. This knowledge is essential for accurate risk evaluation of DCIS, treatment de-escalation strategies and the identification of predictive biomarkers.


Conflict of interest statement

H.R.D. and S.N.Z. hold patent filings on algorithms for tumor classification (PCT/EP2017/060294PCT/EP2017/060289, PCT/EP2017/060279). The remaining authors declare no competing interests.

Figures

Fig. 1
Fig. 1. Study design.
a, Graphical representation of our clinical cohort with long-term follow up to study clonal relatedness between primary DCIS and subsequent disease. The two different groups of subsequent recurrences (ipsilateral DCIS recurrences and ipsilateral invasive recurrences) are shown, together with sample numbers and the median time to follow up. b, The two different strategies undertaken to unravel clonality in DCIS with subsequent disease. First, we microdissected a large cohort of DCIS recurrence pairs and analyzed them with whole exome sequencing, panel sequencing and copy number analyses. Subsequently, we assessed clonal relatedness by counting the number of shared mutations and copy number aberrations. Second, as means of validation, tissue of paired lesions was dissociated, followed by scDNA-seq to study shared tumor subclones.
Fig. 2
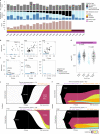
Fig. 2. Clonality assessment using whole exome sequencing.
a, The total number of mutations, followed by the mutations type (primary private, recurrence private and shared), the breakclone score and the final clonality conclusion plotted for each DCIS-invasive recurrence pair. b, Scatter plots showing the VAF of mutations in three clonal related pairs. c, As in b, for three clonal unrelated pairs. d, Boxplots comparing VAF primary private (n = 702), recurrence private (n = 1,257) and shared mutations (n = 433). Minima and maxima are present in the lower and upper bounds of the boxplot, respectively. Adjusted P values for Holm–Bonferroni method P = 5.96 × 10–84 and P = 3.84 × 10–39 were calculated with two-sided Wilcoxon test. For the shared mutations, both the VAF in the DCIS tissue (Primary shared) and the invasive recurrence (Recurrence shared) are shown. Center solid lines represent the median, box edges show the 25th and 75th percentiles and whiskers represent the maximum and minimum data points within 1.5× the interquartile range outside box edges. e, Lineage tracing for two patients with clonal unrelated tumors. f, As in e, for two clonal related tumor pairs.
Fig. 3
Fig. 3. Validation of clonality using copy number profiling.
a, Distribution of breakpoints in primary DCIS and recurrent invasive pairs derived from copy number in lpWGS. The top row (gray) shows the total number of breakpoints for each patient, the next row whether the breakpoints were unique (private) to the primary or recurrence or shared and the final row (pink) the breakclone score. b, Genome-wide segmented copy number profiles and called aberrations heatmaps of two clonally related (P052, P068) and two clonally unrelated (P125, P120) pairs, illustrating relatedness between primary DCIS (purple) and its paired recurrent invasive disease (orange) based on lpWGS copy number analysis. In the copy number profile plot, raw log ratios are in color and segmented log ratios are in black. Called aberrations of gains (red) and losses (blue) are presented in heatmaps below. Shared aberration events (top bar; gray) and shared breakpoints (bottom bar, black) between pairs are shown underneath the heatmaps. The genomic position is indicated by chromosome 1 on the left and up to chromosome X on the right in both graphs.
Fig. 4
Fig. 4. Summary heatmap of clonality calls and clinical characteristics.
The clonality calls calculated by copy number (CN, panel sequencing (Pan) and WES are shown as well as the final clonality call (FCC). The samples are ordered by subsequent FFC, time to recurrence (TTR) and location (Loc) overlap between primary DCIS and recurrence. a, Summary of primary DCIS-invasive recurrence pairs. b, Summary of primary DCIS-subsequent DCIS recurrence pairs.
Fig. 5
Fig. 5. Clonal lineage reconstruction by single-cell genome sequencing.
a, UMAP plots of single-cell copy number profiles from FFPE tissue showing clusters of subclones at primary timepoint or recurrence for two DCIS patients with independent lineages. b, Clustered heatmaps of single-cell copy number profiles for two DCIS cases where the recurrence event represents an independent lineage, with selected breast cancer genes annotated below the heatmap. c, Muller plots showing clonal frequencies and lineages reconstructed from neighbor-joining trees using timescape, with selected breast cancer genes annotated, and chromosomal gains and losses indicated by plus and minus signs, respectively. d, UMAP plots of single-cell copy number profiles from FFPE tissue for two clonally related pairs showing subclones at the primary DCIS and at the recurrence time points. e, Muller plots of the same two clonally related pairs showing clonal frequencies and lineages reconstructed from neighbor-joining trees using timescape, with selected breast cancer genes annotated, again with gains and losses annotated with plus and minus signs, respectively.
Fig. 6
Fig. 6. Mutations and copy number alterations in primary DCIS and subsequent clonally related invasive recurrences.
a, Oncoplots for primary DCIS samples (left) and invasive recurrences (right) based on WES and targeted sequencing. Of the 45 genes covered by all sequencing platforms, only genes mutated in more than 3% of the primary DCIS or invasive recurrence samples are shown. We removed C>T mutations with allele frequency < 0.1 and fewer than three entries in the COSMIC database. b, Frequency plot of genome-wide copy number alterations in clonally related DCIS and invasive recurrences (n = 55) showing primary DCIS (purple) and its paired ipsilateral invasive recurrence (orange). The y axis shows the percentage of samples with gains (above zero line) and losses (below zero line). The genomic position is indicated by chromosome 1 on the left and up to chromosome X on the right with chromosome boundaries indicated by vertical lines.
Extended Data Fig. 1
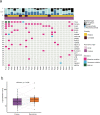
Extended Data Fig. 1. Mutational landscape of DCIS samples.
a, Distribution of mutations in subsequent samples with DCIS and invasive recurrences based on WES data (n = 24). b, Boxplot comparing mutation counts in primary DCIS vs invasive recurrences (p = 0.039, n = 23). P value was computed using paired Wilcoxon test. Minima and maxima are present in the lower and upper bounds of the boxplot, respectively. Center solid lines represent the median, box edges show the 25th and 75th percentiles, whiskers represent the maximum and minimum data points within 1.5× interquartile range outside box edges.
Extended Data Fig. 2
Extended Data Fig. 2. Clonality assessment in 16 DCIS-INV pairs where copy number was assessed by SNP-array.
The top row (gray) shows the total number of breakpoints for each patient, the next row whether the breakpoints were unique (private) to the primary or recurrence or shared and the final row (pink) the breakclone score.
Extended Data Fig. 3
Extended Data Fig. 3. Clonality assessment in primary DCIS-DCIS recurrence pairs.
a, Oncoplot of mutations present in the 10 primary DCIS which recurred as DCIS. b, The total number of mutations, followed by the mutations type (primary private, recurrence private and shared), the breakclone score and the final clonality conclusion plotted for 10 DCIS-DCIS recurrence pairs. c, Scatter plots showing the variant allele frequency of mutations in 2 clonally unrelated related pairs. d, Similar as c, for 4 clonally related pairs. e, Boxplots comparing variant allele frequency between private primary (n = 283), private recurrence (n = 289) and shared mutations (n = 241) showing that, as in DCIS-INV pairs, shared mutations had significantly higher allele frequencies compared to private mutations. Minima and maxima are present in the lower and upper bounds of the boxplot, respectively. Adjusted p-values for Holm–Bonferroni method p = 5.20 ×10–48 and p = 1.84 ×10⁻³⁵, were calculated with two-sided Wilcoxon test. For the shared mutations, both the variant allele frequency in the DCIS tissue (Primary shared) and the DCIS recurrence (Recurrence shared) are shown. Center solid lines represent the median, box edges show the 25th and 75th percentiles, whiskers represent the maximum and minimum data points within 1.5× interquartile range outside box edges. f, Distribution of breakpoints in 25 primary DCIS and recurrent DCIS pairs derived from copy number. The top row (gray) shows the total number of breakpoints for each patient, the next row whether the breakpoints were unique (private) to the primary or recurrence or shared and the final row (pink) the breakclone score.
Extended Data Fig. 4
Extended Data Fig. 4. Additional clonal lineages inferred from single-cell genome sequencing.
a, Clustered heatmaps of single-cell copy number profiles in genomic order from two DCIS cases with related clonal lineages, with cluster and timepoint information on the right panels and selected breast cancer genes annotated below. b-c, Consensus copy number heatmaps of subclones calculated from clusters of single-cell copy number profiles from clonally related (b,) and clonally unrelated (c,) patients. d, Neighbor-joining trees of clonal lineages constructed from consensus subclones from clonally related and unrelated patients rooted by a diploid node.
Extended Data Fig. 5
Extended Data Fig. 5. Fraction of genome aberrated assessed by copy number in clonally related primary DCIS and invasive recurrence pairs (n = 55).
The boxplots present the distribution of a, Total fraction of genome aberrated; b, Fraction of genome gained; c, Fraction of genome amplified; d, Fraction of genome lost for all the primary DCIS cases (purple) and the invasive recurrences (orange). One-sided Wilcoxon signed-rank test p-values are shown and reveal that invasive recurrences have more copy number gains than the primary DCIS. Minima and maxima are present in the lower and upper bounds of the boxplots, respectively. Center solid lines represent the median, box edges show the 25th and 75th percentiles, whiskers represent the maximum and minimum data points within 1.5× interquartile range outside box edges.
Extended Data Fig. 6
Extended Data Fig. 6. Lineage tracing for two cases which recurred as invasive disease with co-existing DCIS and WES was performed on primary DCIS, recurrent DCIS and recurrent invasive disease.
Mueller plots showing clonal frequencies and lineages reconstructed from neighbor-joining trees using timescape. a, recurrent invasive disease comprised four subclones, two of which were detected in the initial primary DCIS and two that appeared in the recurrent synchronous DCIS and invasive disease; b, recurrent invasive disease comprised two subclones one of which the major subclone present in the primary DCIS and the second emerged in the recurrent DCIS and invasive disease. The second subclone present in the primary DCIS which contained a PIK3CA mutation was not found in the recurrent disease.
Extended Data Fig. 7
Extended Data Fig. 7. Two models for matched DCIS-invasive breast cancer recurrences.
Here we present two models for invasive breast cancer recurrence years after the diagnosis of a primary pure DCIS. a, In 80% of the primary DCIS-matched invasive recurrences a clonal relationship is seen, that is similar mutations or copy number profiles are detected in both lesions. Here, DCIS is a true cancer precursor. b, In 20% of the primary DCIS-matched invasive recurrence no clonal relationship is observed, indicating independent lineages and the likelihood of a second primary cancer. In these lesions DCIS is a risk lesion for an invasive cancer and not a precursor lesion.

References

    1. Kerlikowske K. Epidemiology of ductal carcinoma in situ. J. Natl Cancer Inst. Monogr. 2010;41:139–141. doi: 10.1093/jncimonographs/lgq027. - DOI - PMC - PubMed
    1. Ryser MD, et al. Cancer outcomes in DCIS patients without locoregional treatment. J. Natl Cancer Inst. 2019;111:952–960. doi: 10.1093/jnci/djy220. - DOI - PMC - PubMed
    1. Maxwell AJ, et al. Risk factors for the development of invasive cancer in unresected ductal carcinoma in situ. Eur. J. Surg. Oncol. 2018;44:429–435. doi: 10.1016/j.ejso.2017.12.007. - DOI - PubMed
    1. Shaaban AM, et al. Pathological features of 11,337 patients with primary ductal carcinoma in situ (DCIS) and subsequent events: results from the UK Sloane Project. Br. J. Cancer. 2021;124:1009–1017. doi: 10.1038/s41416-020-01152-5. - DOI - PMC - PubMed
    1. Hwang ES, et al. The COMET (Comparison of Operative versus Monitoring and Endocrine Therapy) trial: a phase III randomised controlled clinical trial for low-risk ductal carcinoma in situ (DCIS) BMJ Open. 2019;9:e026797. doi: 10.1136/bmjopen-2018-026797. - DOI - PMC - PubMed

Publication types

MeSH terms

Substances