. 2022 Aug;40(8):1241-1249.
doi: 10.1038/s41587-022-01328-9. Epub 2022 Jun 9.

In vivo engineered B cells secrete high titers of broadly neutralizing anti-HIV antibodies in mice

Affiliations

In vivo engineered B cells secrete high titers of broadly neutralizing anti-HIV antibodies in mice

Alessio D Nahmad et al. Nat Biotechnol. 2022 Aug.

Abstract

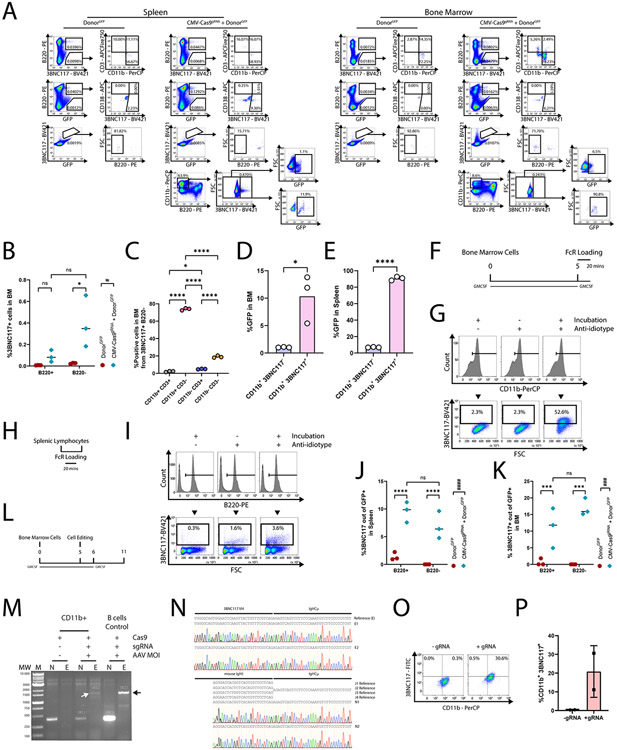
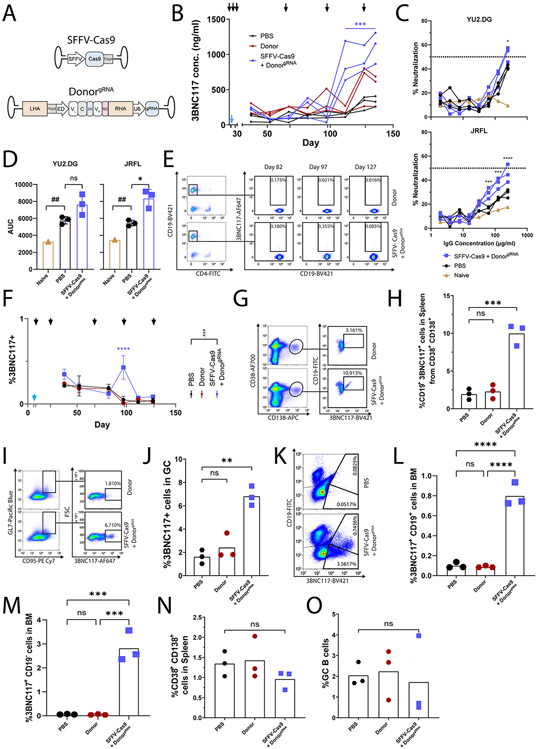
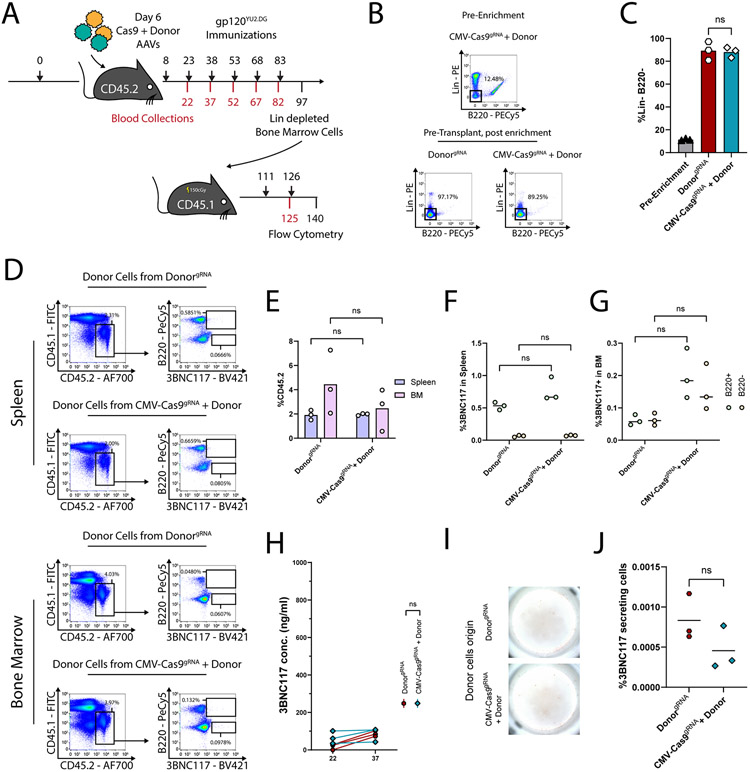
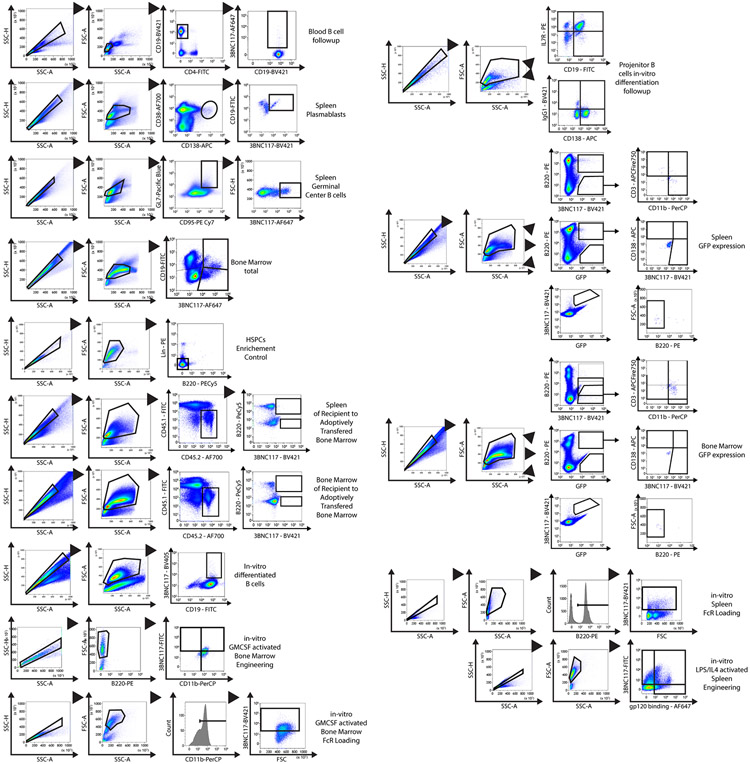
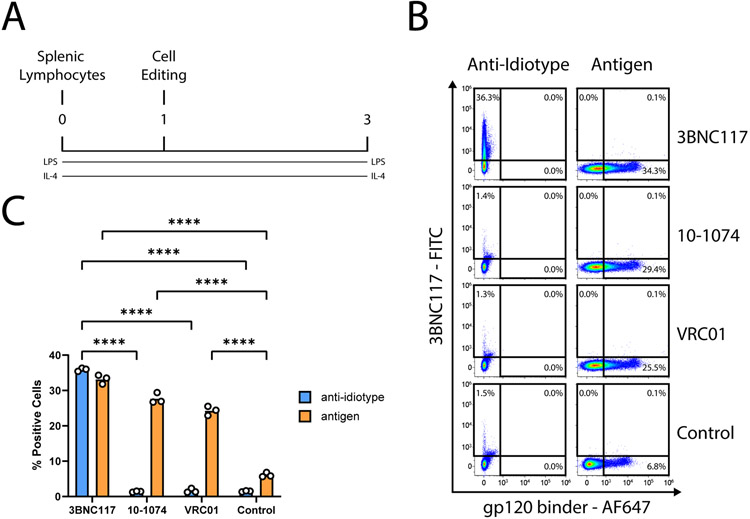
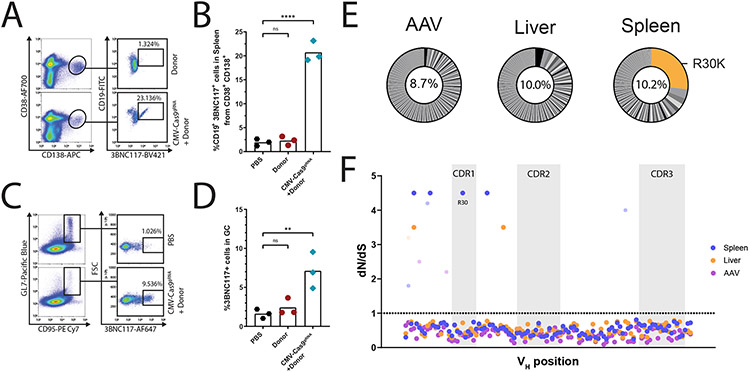
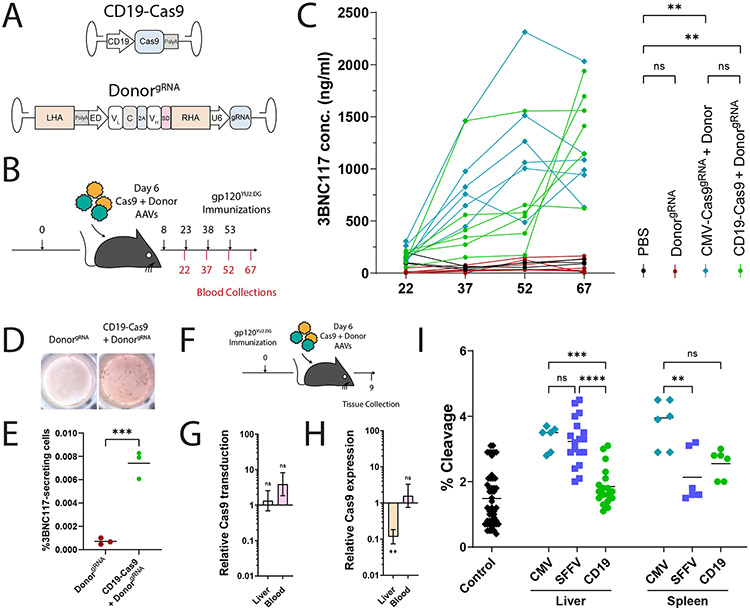
Transplantation of B cells engineered ex vivo to secrete broadly neutralizing antibodies (bNAbs) has shown efficacy in disease models. However, clinical translation of this approach would require specialized medical centers, technically demanding protocols and major histocompatibility complex compatibility of donor cells and recipients. Here we report in vivo B cell engineering using two adeno-associated viral vectors, with one coding for Staphylococcus aureus Cas9 (saCas9) and the other for 3BNC117, an anti-HIV bNAb. After intravenously injecting the vectors into mice, we observe successful editing of B cells leading to memory retention and bNAb secretion at neutralizing titers of up to 6.8 µg ml-1. We observed minimal clustered regularly interspaced palindromic repeats (CRISPR)-Cas9 off-target cleavage as detected by unbiased CHANGE-sequencing analysis, whereas on-target cleavage in undesired tissues is reduced by expressing saCas9 from a B cell-specific promoter. In vivo B cell engineering to express therapeutic antibodies is a safe, potent and scalable method, which may be applicable not only to infectious diseases but also in the treatment of noncommunicable conditions, such as cancer and autoimmune disease.


Figures

Extended Data Fig. 1
Extended Data Fig. 1. Multiple isotypes of the 3BNC117 antibody are expressed by engineered B cells.
A-D. ELISA for each isotype. A. IgM, B. IgG1, C. IgG2c and D. IgA. All samples come from the CMV-Cas9gRNA + Donor injected mice at different time points, as indicated in each legend. Mean and SD are indicated. n=3 biologically independent animals. E-F. Area under the curve (AUC) for A-D. E. IgM, ns; pv = 0.1288, ***; pv = 0.0008, **; pv = 0.0062, F. IgG1, ns; pv = 0.131 and from top to bottom as presented in the graph, **; pv = 0.0044 and pv = 0.0013, G. IgG2c, ***; pv = 0.0007, *; pv = 0.0195, **; pv = 0.0098, H. IgA, ns; pv = 0.0587, **; = pv = 0.0013, *; pv = 0.0403, for two-sided unpaired t-test. n=3 biologically independent animals. For A-H, sample collection day is indicated. Mean values are indicated. I. Fraction of 3BNC117 IgG titers as quantified by ELISA using purified gp120 binding sera from donor injected mice immunized with gp120, at day 37. ***; pv = 0.0007 for two-sided unpaired t-test. n=3 biologically independent samples. Mean values are indicated.
Extended Data Fig. 2
Extended Data Fig. 2. bNAb genomic integration, sera titers and neutralization as a function of immunizations and co-injection of the CRISPR-Cas9 vector.
A. Area under the Curve (AUC) of Fig. 2D for YU2.DG (left) and JRFL (right) **; pv = 0.0036 (YU2.DG) and pv = 0.005 (JRFL) for unpaired t-test for CMV-Cas9gRNA + Donor to PBS comparison and ##; pv = 0.0072 (YU2.DG) and pv = 0.0063 (JRFL) for one-sample t-test for Naïve to PBS comparison. n=3 for CMV-Cas9gRNA + Donor and PBS. Naïve sample is from a single, non-immunized, non-AAV-injected mouse. Mean values +/− SD are indicated. B. Area under the curve (AUC) of Fig. 2C. From top to bottom, *; pv = 0.0185 and pv = 0.0103, **; pv = 0.0036 for two-sided unpaired t-test. n=3 biologically independent animals. Mean values +/− SEM are indicated. C. RT-PCR on RNA from sorted, 3BNC117+, CD19+, CD4 blood lymphocytes from day 37. Here, we used a reverse primer in a membranal exon of either IgHCμ or IgHCγ (all subtypes) and a forward primer on the VH of the coded 3BNC117. Numbers indicate different mice, injected with either a) PBS, b) the donor vector and the CMV-Cas9gRNA vector, or c) the donor vector only, as indicated above the gels. Control sample (C+) comes from in-vitro engineered primary mouse splenic lymphocytes, as described previously. Ladder sizes are indicated on the left. Arrow indicates the expected amplicon size. For each group, experiment was reproduced 3 times with independent samples, as indicated by the numbers. Molecular weight markers (M) and their respective size in base pairs (MW) are indicated. D. Total DNA from the previous reaction as in (C) was purified and a semi-nested PCR with the same forward primer and a reverse primer on the CH1 of the respective constant domains. Ladder sizes are indicated on the left. Arrow indicates the expected amplicon size. For each group, experiments were reproduced 3 times with independent samples. Molecular weight markers (M) and their respective size in base pairs (MW) are indicated. E. Sanger sequencing alignment and chromatogram of the purified amplicon from the previous step. Reference sequences are indicated above. For the IgHCγ, each subtype reference is indicated. Sequencing of the IgHCμ amplicon of donor 3 has failed. F. Experimental design for (G-I). Splenic lymphocytes were activated with LPS and IL-4 and engineered, ex vivo, by AAV transduction and Cas9 electroporation with or without a gRNA. G. Flow cytometry of engineered splenic lymphocytes two days following treatment. Pre-gated on live, singlets. FcR block was used in the staining. Engineering parameters are indicated above each plot. H. EtBr gel electrophoresis showing products of an RT-PCR reaction with RNA from cells two days following treatment as in (F). For each sample, a control (C) reaction was performed amplifying the endogenous IgHG1 cDNA. Ladder sizes are indicated on the left. Arrow indicates the expected amplicon size. The experiment was reproduced once, with similar results. Molecular weight markers (M) and their respective size in base pairs (MW) are indicated. I. Sanger sequencing of the previous amplicons, confirming the integration.
Extended Data Fig. 3
Extended Data Fig. 3. Detection of engineered B cells in the spleen, the blood and the bone marrow.
A. Flow cytometry plots demonstrating 3BNC117 expression among CD19+ CD11b cells in the spleen at day 82 of 2CC immunized mice. Pregated on live, singlets. FcR block was used in the staining. B. Quantification of B. ***; pv = 0.0006 for two-sided unpaired t-test. C. Flow cytometry plots demonstrating 3BNC117 expression among blood B cells (CD19+, CD4). D. Quantification of blood 3BNC117-expressing cells over time. The black arrows indicate immunizations and the blue arrow indicates AAV injection. ####; pv < 0.0001 for Two-Way ANOVA comparison between groups and *; pv = 0.0133, ****; pv < 0.0001 Two-Way ANOVA with Šidák’s multiple comparison for time points comparison to PBS. For each group, each line represents the mean +/−SD of n=3 biologically independent mice. E. Quantification of total CD38+ CD138+ in spleens of recipient mice as in Fig. 3A. From top to bottom: ns; pv = 0. 2380 and pv = 0.9907 for One-Way ANOVA with Tukey’s multiple comparisons test. F. Quantification of total GL7+ CD95+ cells as in Fig. 3E. From top to bottom: ns; pv = 0.9857 and pv = 0.9985 for One-Way ANOVA with Tukey’s multiple comparisons test. G. Flow cytometry plots demonstrating the presence of 3BNC117-expressing B cells in the bone marrow. H-I. Quantification of G. ns; pv = 0.9965, ****; pv < 0.0001 (G) and from top to bottom: ns; pv > 0.9999, *; pv = 0.0387 and pv = 0.0372 (H) for One-Way ANOVA with Tukey’s multiple comparison.
Extended Data Fig. 4
Extended Data Fig. 4. Assessing expression of the transgene in different subsets of cells.
A. Flow cytometry examples for Fig. 5C-G and Extended Data Fig. 3B-E, J-K. B. Quantification of 3BNC117+ cells in bone marrow. #; pv = 0.0129 for Two-Way ANOVA and *; pv = 0.0255 for Two-Way ANOVA with Tukey’s multiple comparison. C. Quantification of the indicated populations from 3BNC117+ B220 cells in the bone marrow. *; pv = 0.0335, **** = pv < 0.0001 for One-Way ANOVA with Tukey’s multiple comparison. D-E. Quantification of GFP+ cells from the CD11b+ 3BNC117+ or CD11b+ 3BNC117 populations in the bone marrow (D) or spleen (E). *; pv = 0.0214, **** = pv <0.0001 for unpaired two-tailed t-test. Mean values are indicated. F. Experimental scheme for (G). Bone marrow cells were collected and activated in the presence of GMCSF. 5 days later, cells were cultured in the presence of purified mouse 3BNC117 for FcR presentation and then collected for analysis by flow cytometry. G. Analysis by flow cytometry, using the anti-3BNC117 anti-idiotypic antibody, of bone marrow cells activated by GMCSF and subsequently cultured with 3BNC117. Experimental conditions are indicated above. Pre-gated on CD11b, live, singlets. H. Experimental scheme for (I). Splenic Lymphocytes are collected from mice and cultured with purified mouse 3BNC117. Next, cells are collected for Flow Cytometry. I. Analysis by flow cytometry, using the anti-3BNC117 anti-idiotypic antibody, of splenic lymphocytes cultured with 3BNC117. Experimental conditions are indicated above. Pre-gated on B220+, live, singlets. J-K. Quantification of 3BNC117+ cells from GFP+ cells in the spleen (J) ####; pv < 0.0001 for Two-Way ANOVA and ns; pv = 0.1748, ****; pv < 0.0001 for Two-Way ANOVA with Tukey’s multiple comparison or bone marrow (K) ###; pv = 0.001 for Two-Way ANOVA and ns; pv = 0.6177, and from left to righ: ***; pv = 0.0005 and pv = 0.0005 for Two-Way ANOVA with Tukey’s multiple comparison. BM = bone marrow. L. Experimental scheme of in-vitro engineering of primary GMCSF activated bone marrow cells for (M-N). M. EtBr gel electrophoresis showing the product of an RT-PCR reaction of RNA from activated bone marrow cells, six days following treatment as in (L). For each sample, two reactions were performed (N or E). N amplifies endogenous IgHCμ mRNA. E amplifies the transgene mRNA joined by splicing to the IgHCμ exons following engineering. Indicated labeling of the amplicons (E1, E2, N1 and N2) performed for reference in (N). The experiment was performed once with expected results. Molecular weight markers (M) and their respective size in base pairs (MW) are indicated. N. Sanger sequencing of the amplicons, confirming correct integration. Amplicons are annotated E1, E2, N1 and N2 as in (M). O. Flow cytometry example of engineered GMCSF activated primary bone marrow cells. Pre-gated on B220, live, singlets. P. quantification of O. Control cells are cells transduced with the AAV and electroporated only with the spCas9, without the sgRNA (-gRNA). For A-P and Fig. 3, FcR block was used in the staining. For each group, n=2 biologically independent samples.
Extended Data Fig. 5
Extended Data Fig. 5. Engineering B cells with the sgRNA coded on the donor AAV
A. Vector maps of the AAVs coding for the DonorgRNA and the SFFV-Cas9. B. 3BNC117 IgG titers as quantified by ELISA over time in the SFFV-Cas9 + DonorgRNA group. The black arrows indicate immunizations and the blue arrow indicates AAV injection. Each line represents a mouse. ***; pv = 0.0005 for Two-Way ANOVA comparing the SFFV-Cas9 + DonorgRNA group to the Donor group. n=3 biologically independent mice. In this panel, the PBS and Donor control groups are the same as for Fig. 2B. C. Transduction neutralization of TZM.bl cells by the YU2.DG (top) and JRFL (bottom) HIV pseudoviruses in the presence of day 136 sera IgGs. Neutralization is calculated as percent reduction from maximal luminescence per sample. The PBS control received immunizations, while the naïve control represents serum IgG from an untreated mouse. ns = non-significant, *; pv = 0.0462 and from top to bottom: ***; pv = 0.0007 and pv = 0.0004, ****; pv < 0.0001, Two-Way ANOVA with Šidák’s multiple comparison for time points comparison to PBS. D. Area under the Curve (AUC) for C. for YU2.DG and JRFL. ns; pv = 0.0667 (YU2.DG) and *; pv = 0.0103 (JRFL) for two-sided unpaired t-test for CMV-Cas9gRNA + Donor to PBS comparison and ##; pv = 0.0097 (YU2.DG) and pv = 0.0078 (JRFL) for two-sided one-sample t-test for naïve to PBS comparison. n=3 for CMV-Cas9gRNA + Donor and PBS. Naïve sample from a single, non-immunized, non-AAV-injected mouse. In C-D, the PBS and control group is the same as for Fig. 2C and Extended Data Fig. 2A. Mean values +/− SD are indicated. E. Representative flow cytometry analysis of 3BNC117+, CD19+, CD4 blood lymphocytes over time in the SFFV-Cas9 + DonorgRNA group. F. Quantification of E. The black arrows indicate immunizations and the blue arrow indicates AAV injection. ###; pv = 0.0006 for Two-Way ANOVA comparison between groups and ****; pv < 0.0001 for Two-Way ANOVA with Šidák’s multiple comparison for time points comparison to PBS. For each group, each line represents the mean +/−SD of n=3 biologically independent mice. G. Representative flow cytometry analysis of 3BNC117+, CD19+, CD38+, CD138+ plasmablasts in the spleens of the SFFV-Cas9 + donorgRNA group at day 136. H. Quantification of G. Mean is indicated by the bars. ns; pv = 9892, ***; pv = 0.0005, one-way ANOVA with Tukey’s multiple comparison. I. Representative flow cytometry analysis of GL7+, Fas/CD95+ GC B cells in the spleens of the SFFV-Cas9 + DonorgRNA group at day 136. J. Quantification of I. Mean is indicated by the bars. ns; pv = 0.8916, **; pv = 0.0075, one-way ANOVA with Tukey’s multiple comparison. K. Representative flow cytometry analysis of 3BNC117+ cells in total bone marrow (BM) of the SFFV-Cas9 + DonorgRNA group at day 136. L. Quantification of 3BNC117+ CD19+ cells, ns; pv = 0.9965 and ****; pv < 0.0001 and M. Quantification of 3BNC117+ CD19 cells, ns; pv > 0.9999 and from top to bottom: ***; pv = 0.0003 and pv = 0.0003. Mean is indicated by the bars. One-way ANOVA with Tukey’s multiple comparison. N-O. Assessing overall immune homeostasis. Quantification by flow cytometry of total CD38+ CD138+ plasmablasts in spleen (N) ns; pv = 0.5622, total GL7+, Fas+ GC B cells in the spleen (O), at day 136 ns; pv = 0.9926. Mean is indicated by the bars.One-way ANOVA with Tukey’s multiple comparison. For E-O, the PBS and Donor control groups are the same as for Fig. 3 and Extended Data Fig. 3.
Extended Data Fig. 6
Extended Data Fig. 6. Long-term persistence of serum antibodies and antibody-secreting cells in the bone marrow.
A. Experimental design. Here, all mice were immunized 4 times (days 8,23,38 and 53) and selected groups received 2 additional immunizations on days 68 and 83. B. 3BNC117 IgG titers as quantified by ELISA over time. For each group, each line represents the mean +/−SD between day 22 and day 67 represents n=6 for biologically independent mice and n=3 for day 67 to 97. C-D. Representative ELISPOT experiments (C) and quantification (D) of 3BNC117-secreting cells from the bone marrow of mice of the indicated groups. Numbers in parentheses represent the number of immunizations. From top to bottom followed by left to right, ns; pv = 0.9844 and pv = 0.9963 and pv = 0.0884, *; pv = 0.0135, **; pv = 0.008, ***; pv = 0.0005 and pv = 0.0003 for One-Way ANOVA with Tukey’s multiple comparison. Mean values are indicated. Part of the data presented in panels B-D is presented also in Fig. 6C-E.
Extended Data Fig. 7
Extended Data Fig. 7. Using CD19 rather than CMV promoter, to drive saCas9 expression, reduces the engineering rate of B cell progenitors.
A. Origin of cells used in this experiment. Bone marrows were extracted 100 days following AAV injection and enriched for IL7R+. B. Experimental scheme. Enriched IL7R+ cells were grown in the presence of multiple activation factors as indicated in the representative timeline, numbers indicate days. Horizontal bars below the timeline indicate the presence of a specific factor supplemented to the growth media. C. Representative flow cytometry analysis of in-vitro differentiation of the IL7R+ enriched cells over time. Days as in (B) are indicated above the plots. D. Quantification of C. For each group, each line represents n=3 biologically independent samples. E. Representative flow cytometry analysis of IL7R enrichment from mice, as in (A). F. Quantification of E. G. Representative flow cytometry analysis of 3BNC117+ CD19+ expression by cells, following 9 days of in-vitro differentiation, as in (B). H. Quantification of G. Each dot represents cells collected from a single mouse as in (A). ns; pv = 0.9, *; pv = 0.0122 and **; pv = 0.0077 for One-Way ANOVA with Tukey’s multiple comparison. For C-G, FcR block was used in staining.
Extended Data Fig. 8
Extended Data Fig. 8. Low 3BNC117 staining and ELISA levels are obtained following syngeneic transplantation of Lin enriched cells from mice injected with the donor vector with or without the saCas9 coding vector.
A. Experimental scheme. CD45.2 mice received either a donor AAV expressing the gRNA or both a donor AAV and an AAV expressing saCas9 and the gRNA. Immunization protocol is indicated by the bars in black. On day 97, bone marrow cells were collected, enriched for lineage negative cells (Lin) and transplanted into, recipient CD45.1 mice. Recipient mice are sublethally irradiated before transplantation and immunized after transplantation. B-C. Representative flow cytometry analysis (B) and quantification (C) of the enriched Lin population from the donor mice. ns; pv = 0.9627 for One-Way ANOVA with Tukey’s multiple comparison. D. Representative flow cytometry analysis (D) of spleens (top) or bone marrows (bottom) from recipient mice at day 140, as in (A) E. Quantification of D. for the CD45.2+ CD45.1 population. From top to bottom: ns; pv = 0.4595 and pv > 0.9999 for Two-Way ANOVA with Tukey’s multiple comparison. F-G. Quantification of D. for the rate of 3BNC117-expressing cells for the spleen (F) or the bone marrow (G). From top to bottom: ns; pv = 0.9994 and pv = 0.0668 (F) and pv = 0.2371 and pv = 0.0560 for Two-Way ANOVA with Tukey’s multiple comparison. H. Serum 3BNC117 IgG titers at the indicated time points. The scale of the Y-axis was chosen to correspond to the other 3BNC117 titer plots in this manuscript. ns; pv = 0.1726t for Two-Way ANOVA. I. Representative ELISPOT assay of a day 140 bone marrow from CD45.1 recipient mice. J. Quantification I. ns; pv = 0.1756 for two-sided unpaired t-test. For B-D, FcR block was used in staining.
Extended Data Fig. 9
Extended Data Fig. 9. Gating strategy for each experiment in this study.
Gating strategy for each experiment in this study.
Extended Data Fig. 10
Extended Data Fig. 10. Assessment of the specificity and sensitivity of the anti-idiotype for 3BNC117.
A. Experimental scheme. Cells are engineered a day following extraction from spleen and activation. We used three different donor AAVs, each expressing a different antibody: either 3BNC117, VRC01 or 10-1074. B. Flow cytometry of gp120 or anti-idiotype binding of engineered cells, two days following treatment. Staining procedure is indicated above the plots. FcR block was used in staining. Each row indicates a different AAV used. Untransduced cells serve as the negative control. C. Quantification of B. ****; pv < 0.0001 for Two-Way ANOVA with Tukey’s multiple comparison.
Fig. 1:
Fig. 1:
Targeting an antibody to the IgH locus of B cells in order to facilitate antigen-induced activation, SHM, CSR and affinity maturation. A. Design of the two AAV vectors. One vector codes for saCas9 and an sgRNA under CMV and U6 promoters, respectively. The second vector codes for the 3BNC117 bNAb cassette flanked by homology arms for integration into the CRISPR-Cas9 cut site at the J-C intron of the IgH locus. The bNAb cassette is expressed upon integration under the control of an enhancer dependent (ED) promoter. The cassette includes the light chain in full and the variable segment of the heavy chain, separated by a sequence coding for a furin cleavage site and a 2A peptide. The variable heavy chain is followed by a splice donor sequence to allow fusion with the endogenous constant exons upon integration, transcription and splicing. An upstream polyadenylation site is provided to terminate the transcription of the endogenous variable heavy chain upon integration. B. Depiction of the IgH locus upon integration. The bNAb cassette is integrated downstream of the last J segment (J4) and upstream of the intronic enhancer (iEμ), class switch recombination locus (CSR) and the IgH Cμ exons. C. The bNAb mRNA is terminated by alternative polyadenylation sites allowing for membranal (BCR) or soluble expression, before and after differentiation into a plasma cell, respectively. D. Different isotypes of the integrated antibody may be expressed upon CSR of engineered B cells. E. SHM in the antibody coding genes may allow for affinity maturation and clonal expansion.
Fig. 2:
Fig. 2:
In vivo engineering of B cells to express an anti-HIV bNAb. A. Experimental scheme. Immunizations are indicated in black, above the timeline. Blood collections are indicated in red, below the timeline. B. 3BNC117 IgG titers as quantified by ELISA using an anti-idiotypic antibody to 3BNC117. The black arrows indicate immunizations and the blue arrow indicates the AAV injection. Each line represents a mouse. From left to right: *; pv = 0.047, pv = 0.0201 for Two-Way ANOVA of CMV-Cas9gRNA + Donor compared to the Donor group. n=3. AUC bar graphs are available in Extended Data Fig. 2. C. Transduction neutralization of TZM.bl cells by the YU2.DG (left) and JRFL (right) HIV pseudoviruses in the presence of IgGs purified from day 136 sera. Neutralization is calculated as percent reduction from maximal luminescence per sample. The PBS control received immunizations as in (C), while the naïve control represents serum IgG from an untreated mouse. Each line represents a mouse. From left to right: *; pv = 0.0306, pv = 0.0116, **; pv = 0.0037, Two-Way ANOVA with Šidák’s multiple comparison for time points comparison to PBS. AUC bar graphs are available in Extended Data Fig. 2. D. Experimental scheme and E. 3BNC117 IgG titers as quantified by ELISA for MD39 immunized mice. From left to right: ns; pv = 0.3724 and pv = 0.0539, ###; pv = 0.0008 for Two-Way ANOVA comparison between groups and *; pv = 0.0493, ***, pv = 0.0007 for Two-Way ANOVA with Šidák’s multiple comparison for time points comparison to antigen respective control. F. Experimental scheme and G. 3BNC117 IgG titers as quantified by ELISA for 2CC immunized mice. #### = pv < 0.0001 for Two-Way ANOVA comparison between groups and **** = pv < 0.0001 for Two-Way ANOVA with Šidák’s multiple comparison for time points comparison to PBS. H. A representative ELISPOT experiment of total bone marrows from 2CC immunized mice at day 82. I. Quantification of H. *; pv = 0.0317 for two-sided unpaired t-test.
Fig. 3:
Fig. 3:
In-vivo engineered B-cells are found in lymphatic tissues 130 days following AAV injection. A. Flow cytometry plots demonstrating 3BNC117 expression among plasmablasts (CD38+, CD138+, CD19+) in the spleen at day 136. Pregated on live, singlets. B. Quantification of A. for engineered plasmablasts (CD38+ CD138+ 3BNC117+). Mean is indicated by the bars. ns; pv = 0.9892, ****; pv < 0.0001, One-way ANOVA with Tukey’s multiple comparison. C. Flow cytometry plots demonstrating 3BNC117 expression of cells with a germinal center phenotype (GL7+, CD95/Fas+) in the spleen. Pre-gated on live, singlets. D. Quantification of E. Mean is indicated by the bars, ns; pv = 0.8916, **; pv = 0.0054 One-way ANOVA with Tukey’s multiple comparison. E. Pie charts of 3BNC117 VH variants amplified from spleen and liver DNA at day 136 and from purified AAV. Orange shading indicates the R30K variant. Numbers in the middle of the pies indicate the total frequency of mutant reads in these samples. F. dN/dS values for the positions along the VH segment, based on Illumina sequencing of DNA amplified from the spleen (blue) or liver (orange) of a single mouse or AAV (purple). The dotted line represents values >1, indicative of positive selection. For dots colored with lighter shades, the assignment of a dN/dS value > 1 is not statistically significant. No position in the AAV sample reached statistical significance. Grey shading indicates CDR loops. The R30 position is indicated.
Fig. 4:
Fig. 4:
AAV biodistribution and saCas9 off-target cleavage analysis reveal a high safety profile. A. Donor AAV copy number quantification by qPCR in indicated tissues at day 136 from mice injected with two AAVs as in Fig. 2A. B. Relative copy number of donor AAV between day 37 and day 136 in selected tissues. C. Relative copy number of donor AAV between mice injected with two AAVs, as in Fig. 2A, and mice injected with donor AAV only, at day 136. For B. and C. Indicated are the mean of relative expression and error bars corresponding to lower and upper boundaries derived from two-sided unpaired t-test. For B., from left to right: *; pv = 0.0496, pv = 0.0139, pv = 0.0389, pv = 0.0243, **; pv = 0.0046 for comparison between the two time points and for C., from left to right: *; pv = 0.0128, pv = 0.0147 for comparison between the two mice groups. n=3 biologically independent animals. Y axis in A-C uses a log scale. LN = lymph nodes, BM = bone marrow. D. Unbiased CHANGE-seq analysis of potential saCas9 off-target cleavage with the sgRNA used in this study. Localization, annotation in the genome, number of mismatches and % read counts are indicated for each on- or off-target site. Sequence of the sgRNA with the PAM is indicated on the top. Black arrows indicate target sites used for analysis of mouse samples. Mismatches between off-target sites and intended sgRNA target are color-coded. E. On- and off-target saCas9 cleavage, of target sites indicated in D. by black arrows, in the spleen (mauve) and liver (beige) of mice injected with two AAVs, as in Fig. 2A, at day 136, as compared to uncut, naïve splenic lymphocytes DNA. For spleen and liver tissues, n=3 biologically independent animals. For the control uncut, naïve splenic lymphocyte DNA, n=1. Mean values +/− SD are indicated.
Fig. 5:
Fig. 5:
Assessing expression of the transgene in different subsets of cells. A. Vector design. The donor cassette expresses a GFP, separated from the 3BNC117 cassette by a 2A peptide. B. Experimental design. C-D. Quantification of GFP+ 3BNC117+ in the spleen (C) or bone marrow (D) of recipient mice. Mean values and standard deviation are indicated. For each group, n=3 biologically independent mice. *; pv = 0.0284, ***; pv = 0.0004 for Two-Way ANOVA. E. Quantification of GFP+ cells in spleen. ####; pv < 0.0001 for Two-Way ANOVA and ****; pv < 0.0001 for Two-Way ANOVA with Tukey’s multiple comparison. F-G. Quantification of the 3BNC117+ CD138+ population from B220+, GFP+ cells in the sleen (F) *; pv = 0.0147 for unpaired two-tailed t-test, or bone marrow (G) *; pv = 0.0471 for unpaired two-tailed t-test. Mean values are indicated.
Fig. 6:
Fig. 6:
Improving safety by coding saCas9 and the sgRNA on separate AAVs and expressing saCas9 under the regulation of a B cell-specific promoter. A. Map of the AAV vectors used. saCas9 is expressed under the CD19 promoter, while the sgRNA is coded on the donor vector, outside of the homology arms. B. Experimental scheme. Mice were immunized according to the timeline in black (top), and bled as indicated in red (bottom). C. 3BNC117 IgG titers, quantified by ELISA with an anti-idiotypic antibody. Each line represents a mouse. From top to bottom and left to right: **; pv = 0.0075, and pv = 0.0055, ns; pv = 0.0876 and pv = 0.3288 for two-Way ANOVA. D. Representative ELISPOTs of bone marrows from mice, 45 days following the fourth immunization. E. Quantification of (D). ***; pv = 0.0007 for two-sided unpaired t-test. F. Experimental scheme. Mice immunized with gp120 are dosed with AAVs and tissues are collected three days following AAV injection. G. Relative transduction by the saCas9 coding AAV, calculated as the ratio of copy numbers, in the indicated tissues, between mice receiving AAVs coding for saCas9 under the CD19 or SFFV promoters. Indicated are the mean of relative expression and error bars corresponding to lower and upper boundaries derived from two-sided unpaired t–test. From left to right: ns; pv = 0.6920 and pv = 0.1441. n=3 biologically independent animals. H. Relative saCas9 mRNA expression, depicted as the ratio between saCas9 expression from the CD19 promoter and from the SFFV promoter. Indicated are the mean of relative expression and error bars corresponding to lower and upper boundaries derived from two-sided unpaired t-test. ns; pv = 0.5698, **; pv = 0.0092. n=3 biologically independent animals. I. TIDE analysis of on-target cleavage in the indicated tissues using either CMV, SFFV or CD19 driven saCas9 expression. From left to right: ns; pv > 0.9999 and pv = 0.0760, **; pv = 0.0036, ***; pv = 0.0008, ****; pv < 0.0001 for One-way ANOVA with Tukey’s multiple comparison. Each dot represents a comparison between a control sequence and an independent mouse sequence.

Comment in

References

    1. Mendoza P et al. Combination therapy with anti-HIV-1 antibodies maintains viral suppression. Nature 561, 479–484 (2018). - PMC - PubMed
    1. Bar-On Y et al. Safety and antiviral activity of combination HIV-1 broadly neutralizing antibodies in viremic individuals. Nat. Med (2018). doi:10.1038/s41591-018-0186-4 - DOI - PMC - PubMed
    1. Cohen YZ et al. Safety, pharmacokinetics, and immunogenicity of the combination of the broadly neutralizing anti-HIV-1 antibodies 3BNC117 and 10-1074 in healthy adults: A randomized, phase 1 study. PLoS One 14, 1–18 (2019). - PMC - PubMed
    1. Johnson PR et al. Vector-mediated gene transfer engenders long-lived neutralizing activity and protection against SIV infection in monkeys. Nat. Med 15, 901–906 (2009). - PMC - PubMed
    1. Balazs AB et al. Vectored immunoprophylaxis protects humanized mice from mucosal HIV transmission. Nat. Med 20, 296–300 (2014). - PMC - PubMed

METHODS REFERENCES

    1. Ran FA et al. In vivo genome editing using Staphylococcus aureus Cas9. Nature 520, 186–191 (2015). - PMC - PubMed
    1. Barzel A et al. Promoterless gene targeting without nucleases ameliorates haemophilia B in mice. Nature 517, 360–364 (2015). - PMC - PubMed
    1. Nahmad AD et al. Engineered B cells expressing an anti-HIV antibody enable memory retention, isotype switching and clonal expansion. Nat. Commun 1–10 (2020). doi:10.1038/s41467-020-19649-1 - DOI - PMC - PubMed
    1. Grimm D et al. In Vitro and In Vivo Gene Therapy Vector Evolution via Multispecies Interbreeding and Retargeting of Adeno-Associated Viruses. J. Virol 82, 5887–5911 (2008). - PMC - PubMed
    1. Huang D et al. Vaccine elicitation of HIV broadly neutralizing antibodies from engineered B cells. Nat. Commun 1–10 (2020). doi:10.1038/s41467-020-19650-8 - DOI - PMC - PubMed

Publication types

Substances