. 2022 Jul;3(7):852-865.
doi: 10.1038/s43018-022-00393-y. Epub 2022 Jun 9.

Limited nutrient availability in the tumor microenvironment renders pancreatic tumors sensitive to allosteric IDH1 inhibitors

Affiliations

Limited nutrient availability in the tumor microenvironment renders pancreatic tumors sensitive to allosteric IDH1 inhibitors

Ali Vaziri-Gohar et al. Nat Cancer. 2022 Jul.

Abstract

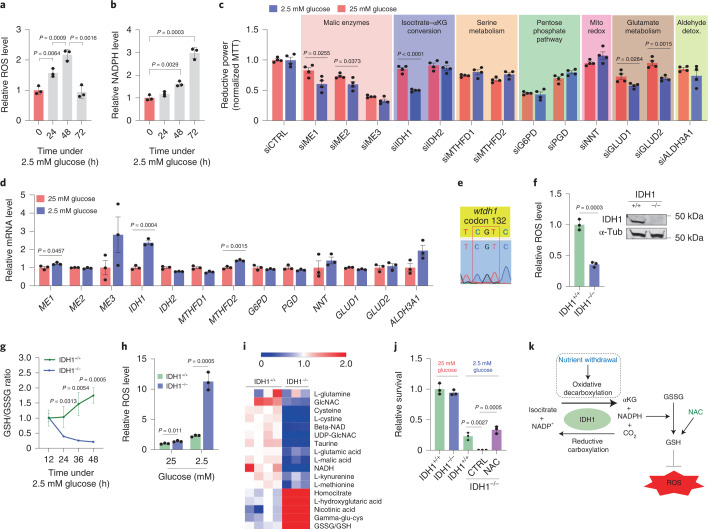
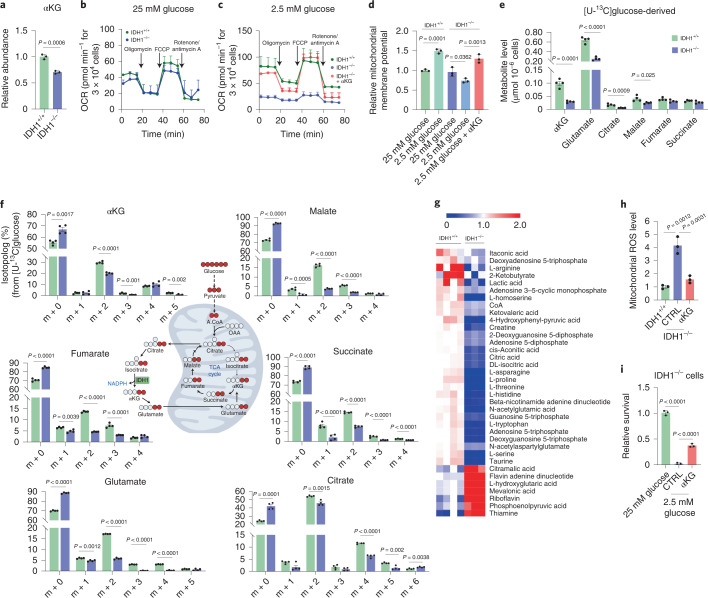
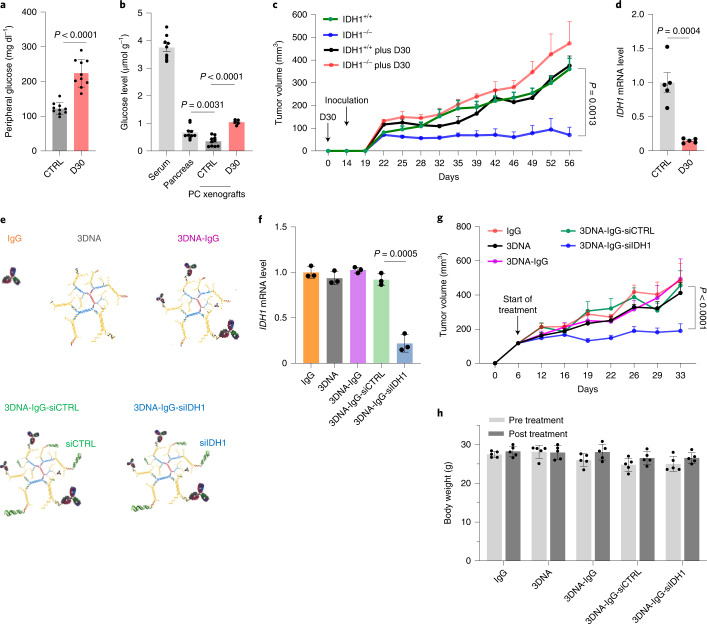
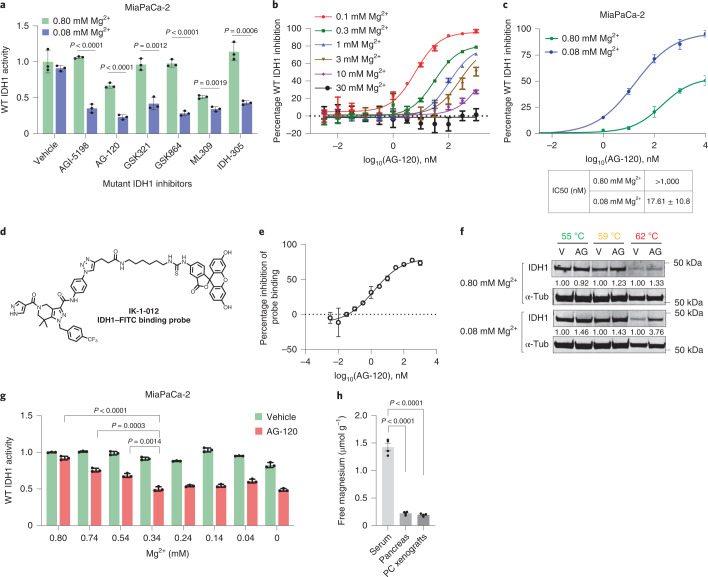
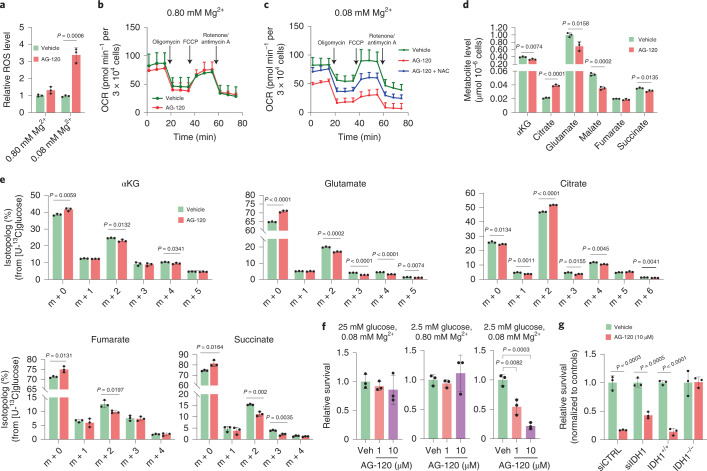
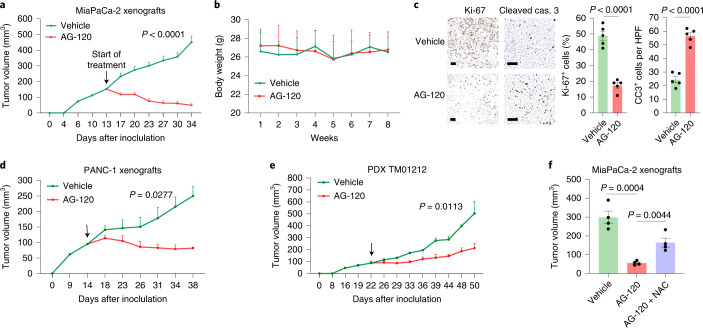
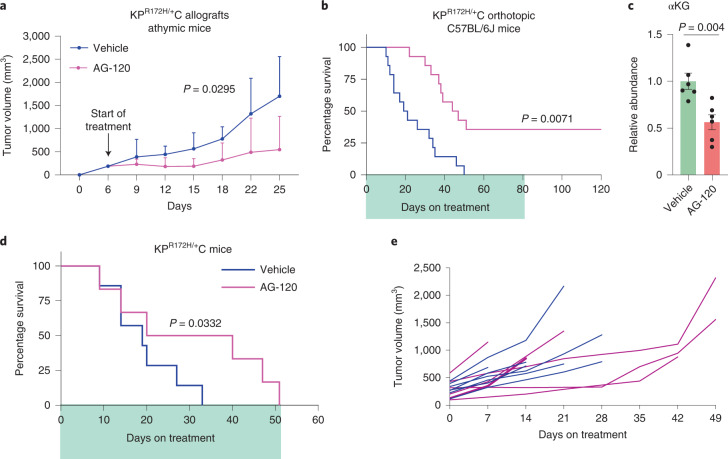
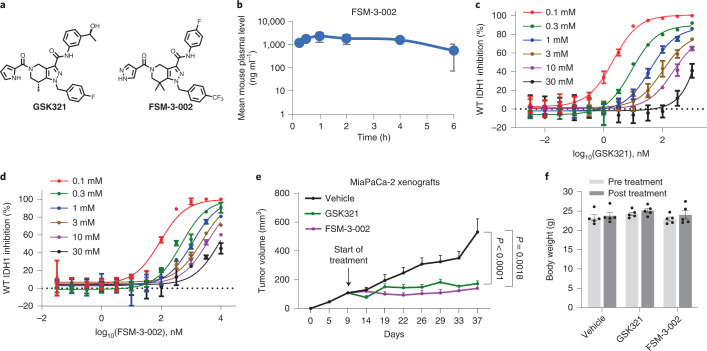
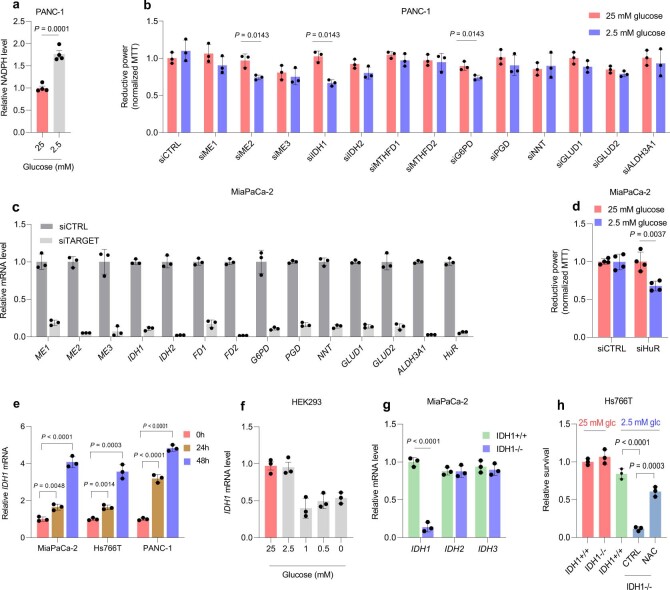
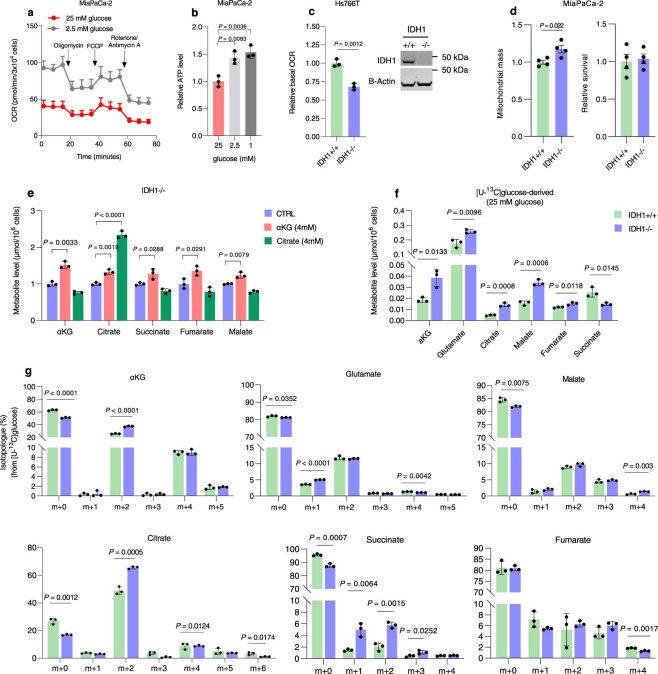
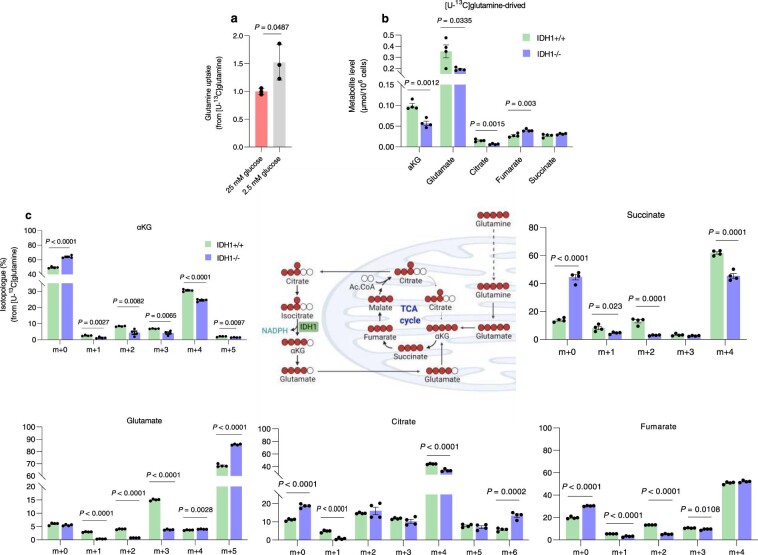
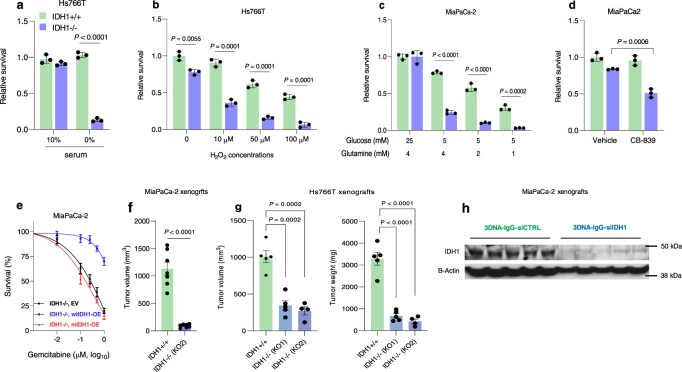
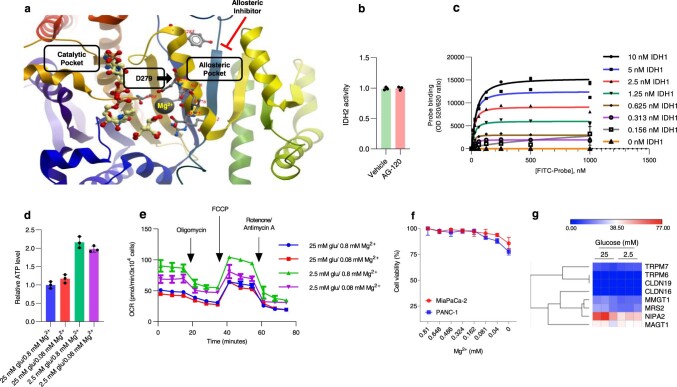
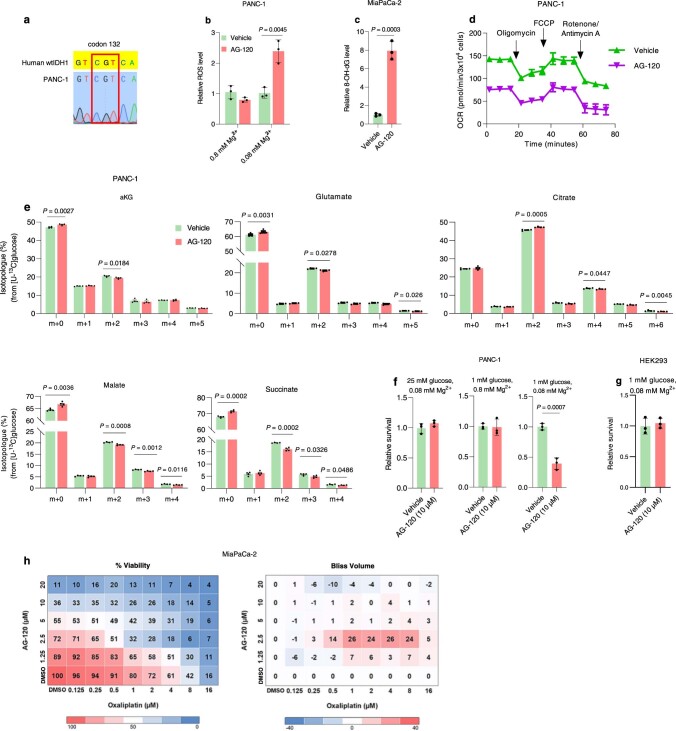
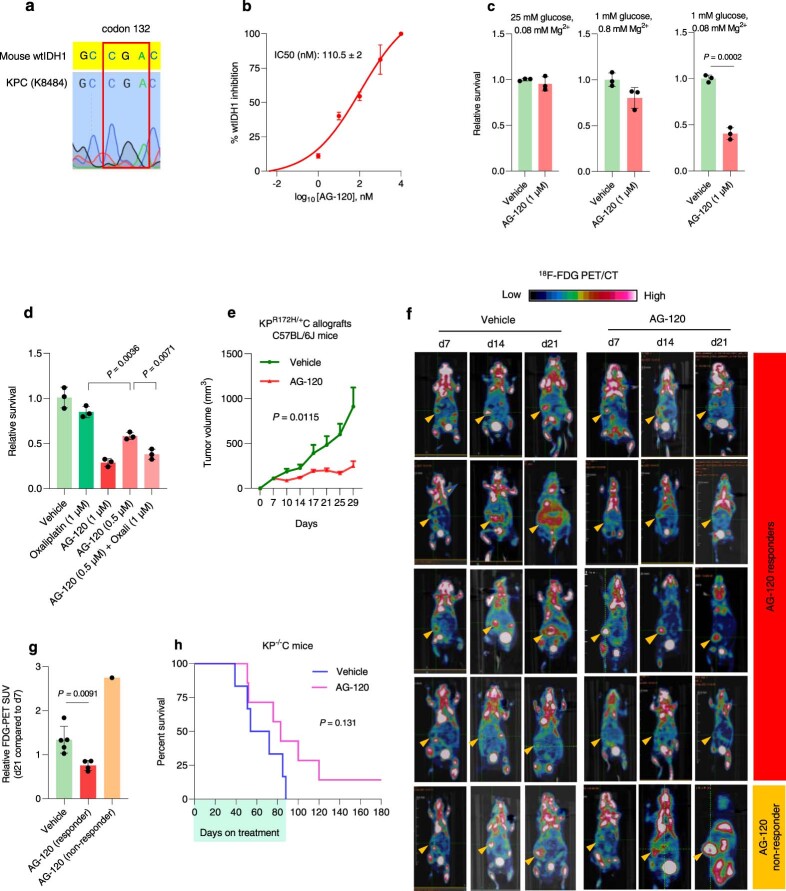
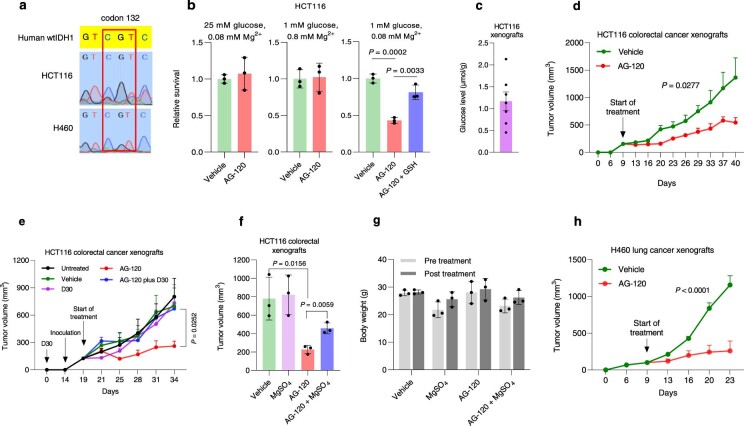
Nutrient-deprived conditions in the tumor microenvironment (TME) restrain cancer cell viability due to increased free radicals and reduced energy production. In pancreatic cancer cells a cytosolic metabolic enzyme, wild-type isocitrate dehydrogenase 1 (wtIDH1), enables adaptation to these conditions. Under nutrient starvation, wtIDH1 oxidizes isocitrate to generate α-ketoglutarate (αKG) for anaplerosis and NADPH to support antioxidant defense. In this study, we show that allosteric inhibitors of mutant IDH1 (mIDH1) are potent wtIDH1 inhibitors under conditions present in the TME. We demonstrate that low magnesium levels facilitate allosteric inhibition of wtIDH1, which is lethal to cancer cells when nutrients are limited. Furthermore, the Food & Drug Administration (FDA)-approved mIDH1 inhibitor ivosidenib (AG-120) dramatically inhibited tumor growth in preclinical models of pancreatic cancer, highlighting this approach as a potential therapeutic strategy against wild-type IDH1 cancers.


Conflict of interest statement

R.G. is an inventor on multiple issued patents and patent applications covering the manufacture and use of 3DNA technology as part of his role in Code Biotherapeutics, Inc. He is also an employee and officer of Code Biotherapeutics, Inc. and has stock and stock options. C.A.L. has received consulting fees from Astellas Pharmaceuticals and Odyssey Therapeutics and is an inventor on patents pertaining to Kras-regulated metabolic pathways, redox control pathways in cancer and targeting of the GOT1-pathway as a therapeutic approach. J.M.S. is a coauthor on patents on IDH1 inhibitors, and has received sponsored research funding from the Barer Institute and patents pending to Wistar Institute. J.M.W., along with University Hospitals, filed the following patent application on 24 September 2020: Methods for Treating Wild Type Isocitrate Dehydrogenase 1 Cancers. Information regarding this patent application is as follows: PCT/US20/52445 filed 24 September 2020, Claiming Priority to US 62/911,717 filed 7 October 2019, file nos: UHOSP-19738 | 2019-014.

Figures

Fig. 1
Fig. 1. IDH1 supports antioxidant defense under nutrient withdrawal in pancreatic cancer (MiaPaCa-2) cells.
a, ROS levels were detected by DCFDA assay under glucose withdrawal (2.5 mM) over 72 h. 0 h indicates that cells were incubated under standard, 25 mM glucose (n = 3 independent biological replicates). b, NADPH levels under the indicated conditions over 72 h (n = 3 independent biological replicates). c, Reductive power, as detected by MTT assay normalized to cell number. Cells were transiently transfected with siRNAs against different NADPH-generating enzymes and incubated under the indicated conditions for 72 h (n = 4 independent biological replicates). d, Relative transcripts per million values for NADPH-generating transcripts under the indicated conditions for 48 h (n = 3 individual biological replicates). e, Sanger sequencing of amplicons correlating with codon 132 of the wtIDH1 gene. The reference human wild-type sequence is shown. f, Immunoblot of IDH1 in IDH1+/+ and IDH1–/– MiaPaCa-2 PDAC cells (representative immunoblots of three biological replicates with similar results are shown) and relative NADPH levels (n = 3 independent experiments). g,h, reduced glutathione/oxidized glutathione (GSH/GSSH) ratio (g) and ROS levels (h) under the indicated conditions for 48 h (n = 3 independent biological replicates). i, Redox-related metabolites in IDH1+/+ and IDH1–/– cells under glucose withdrawal (2.5 mM) for 48 h (IDH1+/+, n = 4; IDH1–/–, n = 3 individual biological replicates). j, Relative clonogenic growth of indicated cells treated with or without glutathione precursor NAC under the indicated conditions. NAC treatment (1.25 mM) was given 16 h before cell culture under low-glucose conditions (n = 3 independent biological replicates). k, Enzymatic reaction of IDH1. Data provided as mean ± s.d. (a,b,fh,j) or mean ± s.e.m. (c). Pairwise comparisons were conducted using two-tailed, unpaired Student’s t-tests. CTRL, control. Source data
Fig. 2
Fig. 2. IDH1 supports mitochondrial function under nutrient withdrawal in pancreatic cancer (MiaPaCa-2) cells.
a, Relative abundance of αKG in cells under low-glucose conditions (2.5 mM glucose) for 48 h (n = 3 independent biological replicates). b,c, OCR in MiaPaCa-2 pancreatic cancer cells under 25 mM (b) and 2.5 mM glucose (c). In a rescue experiment, cells were treated initially with αKG (4 mM) for 6 h and glucose was then lowered to 2.5 mM for 30 h (representative experiments of three independent biological replicates with similar results are shown). d, Mitochondrial membrane potential measured by TMRE assay in cells under the indicated conditions for 30 h (n = 3 independent biological replicates). e,f, Total pool size, including glucose-independent (m + 0) and glucose-dependent isotopologs (e) and isotopolog distribution (f) in cells cultured with unlabeled 2.5 mM glucose for 38 h followed by 2.5 mM [U-13C]glucose for an additional 10 h (n = 4 individual biological replicates). g, Mitochondrial-related metabolites in IDH1+/+ and IDH1–/– cells under glucose withdrawal for 48 h (IDH1+/+, n = 4; IDH1–/–, n = 3 individual biological replicates). h,i, Mitochondrial ROS levels in cells under low-glucose condition for 48 h (h) and relative clonogenic growth of IDH1–/– cells treated with or without αKG (4 mM) (i) under the indicated conditions for 5 days (n = 3 independent biological replicates). Data are provided as mean ± s.d. (ad,h,i) or mean ± s.e.m. (e,f). Pairwise comparisons were conducted using two-tailed, unpaired Student’s t-tests. Source data
Fig. 3
Fig. 3. IDH1 is a therapeutic target in pancreatic cancer.
a, Peripheral glucose levels in mice receiving normal water or D30 for 3 weeks (n = 10 mice per group). b, GC–MS analysis of intratumoral glucose levels (serum, n = 9 mice; pancreas, n = 10 mice; CTRL, n = 10 tumors; D30, n = 5 tumors). c, Growth of subcutaneous MiaPaCa-2 tumors in mice receiving normal water or D30 (n = 5 tumors per group; IDH1+/+ versus IDH1–/– tumors, P = 0.0013). d, qPCR analysis of IDH1 transcripts normalized to 18S in xenografts shown in a (n = 5 tumors per group). e, Cartoon depiction of 3DNA nanocarriers conjugated with IgG antibody (nonspecific targeting construct) and siRNAs. fh, qPCR analysis of IDH1 mRNA transcripts (f, n = 3 tumors per group), growth of subcutaneous tumors (g, n = 5 tumors per group; 3DNA-IgG-siCTRL versus 3DNA-IgG-siCTRL tumors, P < 0.0001) and body weights (h, n = 5 mice per group) from indicated treatment arms. Data provided as mean ± s.e.m. (ad,g,h) or mean ± s.d. (f). Pairwise comparisons were conducted using two-tailed, unpaired Student’s t-tests. Longitudinal mixed models were fit for tumor growth, and time × treatment interactions were assessed. Source data
Fig. 4
Fig. 4. AG-120 inhibits wild-type IDH1 under low Mg2+ conditions.
a, Wild-type (WT) IDH1 activity in MiaPaCa-2 pancreatic cancer cells cultured in medium containing 0.80 or 0.08 mM MgSO4 and 25 mM glucose for 24 h, followed by treatment with mIDH1 inhibitors (100 nM) for 6–8 h (one representative of three independent experiments with similar results is shown). b,c, Cell-free (b, n = 2 independent experiments) and cell-based (c, n = 3 independent biological replicates) IDH1 activity measurements following incubation with AG-120 under the indicated conditions. d,e, The structure of a newly synthesized IDH1 binding probe (d) and binding affinity of the probe in the presence of AG-120 (e, n = 2 independent experiments). f, Immunoblot analysis to evaluate thermal stability of the IDH1 protein in MiaPaCa-2 PDAC cells treated with vehicle (V) or AG-120 (AG, 1 µM) in medium containing 0.80 or 0.08 mM MgSO4 for 6–8 h (representative immunoblots of three biological replicates with similar results are shown). g, IDH1 activity of MiaPaCa-2 cells treated with AG-120 for 24 h under the indicated conditions (one representative of three independent biological replicates with similar results is shown). h, Free magnesium levels in normal pancreas, and MiaPaCa-2 pancreatic cancer xenografts versus serum (n = 4 samples per group). Data provided as mean ± s.d. (ac,e,g) or mean ± s.e.m. (h). Pairwise comparisons were conducted using two-tailed, unpaired Student’s t-tests. Source data
Fig. 5
Fig. 5. Low glucose and Mg2+ levels are required for anticancer activity by an allosteric IDH1 inhibitor (MiaPaCa-2 cells).
a, ROS levels were detected by DCFDA assay in MiaPaCa-2 pancreatic cancer cells treated with AG-120 (1 µM) for 48 h under the indicated conditions and cultured in medium containing 2.5 mM glucose (n = 3 independent experiments). b,c, OCR in MiaPaCa-2 PDAC cells treated with vehicle or AG-120 cultured in medium containing either 0.80 mM Mg2+ and 2.5 mM glucose (b) or 0.08 mM Mg2+ and 2.5 mM glucose (c) for 30 h (representative experiments of three independent biological replicates with similar results are shown). d,e, Total pool size, including glucose-independent (m + 0) and glucose-dependent isotopologs (d) and isotopolog distribution (e) in cells cultured with unlabeled 2.5 mM glucose for 38 h followed by 2.5 mM [U-13C]glucose for an additional 10 h (n = 3 individual biological replicates). f, Relative clonogenic growth of cells treated with vehicle or AG-120 for 4 days under different levels of glucose and Mg2+ (n = 3 independent biological replicates). g, Relative clonogenic growth of indicated cells treated with vehicle or AG-120 for 4 days under 2.5 mM glucose and 0.08 mM Mg2+ (n = 3 independent biological replicates). Data provided as mean ± s.d. Pairwise comparisons were conducted using two-tailed, unpaired Student’s t-tests. Source data
Fig. 6
Fig. 6. AG-120 inhibits pancreatic cancer growth in mice.
a,b, For all animal experiments, mice were treated orally with vehicle or AG-120 (150 mg kg−1, twice daily) unless otherwise indicated. Start of treatment is denoted by an arrow. MiaPaCa-2 xenograft growth (a, n = 8 tumors per group) and body weight (b, n = 5 mice per group) of nude mice treated with vehicle or AG-120. c, Ki-67 and cleaved caspase 3 immunolabeling for tumors in a. d,e, Xenograft growth of PANC-1 (d, n = 5 tumors per group) and PDX TM01212 (e, 75 mg kg–1, once daily, i.p. administration; n = 4 tumors and n = 5 tumors for vehicle and AG-120, respectively). f, Independent MiaPaCa-2 xenograft experiment in nude mice (n = 4 tumors per group). Data provided as mean ± s.e.m. Pairwise comparisons were conducted using two-tailed, unpaired Student’s t-tests. Longitudinal mixed models were fit for tumor size growth, and time × treatment interactions were assessed. Source data
Fig. 7
Fig. 7. AG-120 activity in murine pancreatic cancer.
a, Growth of subcutaneous allografts derived from murine pancreatic cancer (KPC K8484 cells) transplanted into nude mice. Mice were treated with vehicle or AG-120 (n = 3 tumors). b, Survival analysis of C57BL/6 J mice transplanted with orthotopic murine pancreatic cancer treated with vehicle or AG-120 (n = 14 mice per group). c, αKG levels in orthotopic murine pancreatic cancer treated with vehicle or AG-120 for 10 days (n = 6 tumors per group). d,e, Survival analysis (d) and tumor volume (e) measured by ultrasound in KPC (KrasG12D/+; Trp53R172H/+; Pdx1-Cre) mice treated with vehicle (n = 7 mice) or AG-120 (n = 6 mice). Data provided as mean ± s.d. (a) or mean ± s.e.m. (c). Pairwise comparisons were conducted using two-tailed, unpaired Student’s t-tests. Longitudinal mixed models were fit for tumor size growth, and time × treatment interactions were assessed. Survival data represented by Kaplan–Meier curves, and tests for treatment differences were conducted with Fleming–Harrington (0,1) weighted log-rank test statistics. Source data
Fig. 8
Fig. 8. Alternative allosteric wild-type IDH1 inhibitors.
a, Structures of GSK321 and FSM-3-002. b, PK analysis (n = 3 CD-1 mice per time point) for FSM-3-002 after 10 mg kg−1 i.p. administration. c,d, Cell-free analysis of wtIDH1 activity following incubation with GSK321 (c) or FSM-3-002 (d) under the indicated concentrations of Mg2 (n = 2 independent experiments). e. Growth of MiaPaCa-2 xenografts in mice injected i.p. with either vehicle, GSK321 (75 mg kg−1 once daily) or FSM-3-002 (75 mg kg–1 once daily) (n = 5 tumors per group). f, Body weights of nude mice bearing MiaPaCa-2 pancreatic cancer xenografts treated with either vehicle, GSK321 or FSM-3-002 (n = 5 mice per group). Data provided as mean ± s.d. (bd) or mean ± s.e.m. (e,f). Pairwise comparisons were conducted using two-tailed, unpaired Student’s t-tests. Longitudinal mixed models were fit for tumor growth, and time × treatment interactions were assessed. For analyses in e, Bonferroni correction was employed so that a two-sided type I error level of 0.025 was adopted per test. Source data
Extended Data Fig. 1
Extended Data Fig. 1. Validation of IDH1s’ role in redox balance in pancreatic cancer cells.
a, NADPH levels in PANC-1 pancreatic cancer cells under the indicated conditions for 72 hours (n = 4 independent biological replicates). b, Reductive power, as measured by an MTT assay normalized to cell number, after transient transfection of siRNAs against NADPH-generating enzymes in PANC-1 cells. Cells were incubated under the indicated conditions for 72 hours (n = 3 independent biological replicates). c, mRNA levels associated with siRNA screening shown in Fig. 1c (a representative of three independent biological replicates with similar results is shown). d, HuR in MiaPaCa-2 cells as a positive control (n = 4 independent biological replicates). e, qPCR analysis of IDH1 mRNA normalized to 18 S in multiple PDAC cells and under 2.5 mM glucose for the indicated time intervals (n = 3 independent biological replicates). f, qPCR analysis of IDH1 mRNA normalized to 18 S in HEK293 human embryonic kidney cells cultured under different concentrations of glucose for 48 hours (n = 3 independent biological replicates). g, mRNA quantitation in MiaPaCa-2 cells by qPCR of IDH1, IDH2 and IDH3 transcripts normalized to 18 S (n = 3 independent biological replicates). h, Relative clonogenic growth of Hs766T cells with or without NAC (1.25 mM) for five days at the indicated conditions (n = 3 independent biological replicates). Data are provided as mean ± s.d. (b,c,e-h) or mean ± s.e.m. (a,d) or. Pairwise comparisons were conducted using two-tailed, unpaired Student’s t-tests. Source data
Extended Data Fig. 2
Extended Data Fig. 2. IDH1-/- cells have impaired mitochondrial function.
a, Oxygen consumption rates (OCR) in MiaPaCa-2 cells cultured under the indicated glucose conditions for 30 hours (a representative of three independent biological replicates with similar results is shown). b, ATP levels in MiaPaCa-2 cells cultured under the indicated conditions for 24 hours (n = 3 independent biological replicates). c, Basal OCR in Hs766T pancreatic cancer cells cultured in 1 mM glucose for 24 hours (a representative of two independent biological replicates with similar results is shown). Western blot of IDH1 expression (representative immunoblots of two independent biological replicates with similar results are shown). d, Mitochondrial mass and cell viability in MiaPaCa-2 cells cultured with 2.5 mM glucose for 30 hours (n = 4 independent biological replicates). e, Relative abundance of the indicated TCA-related metabolites in MiaPaCa-2 cells cultured with unlabeled 2.5 mM glucose for 38 hours followed by unlabeled αKG (4 mM) or sodium citrate (4 mM) for 10 hours (n = 3 individual biological replicates). f, g, Total pool size (f) and isotopologue distribution (g) of indicated metabolites in cells cultured with unlabeled 25 mM glucose for 38 hours followed by 25 mM [U-13C]glucose for an additional 10 hours (n = 3 individual biological replicates). Data are provided as mean ± s.d. (a-c,e-g) or mean ± s.e.m. (d). Pairwise comparisons were conducted using two-tailed, unpaired Student’s t-tests. Source data
Extended Data Fig. 3
Extended Data Fig. 3. The impact of IDH1 on glutamine metabolism.
a, Relative glutamine uptake was quantified via mass spectrometry in MiaPaCa-2 cells cultured with 4 mM [U-13C]glutamine under 25 or 2.5 mM glucose for 24 hours (n = 3 individual biological replicates). b, c, Total pool size (b) and isotopologue distribution (c) of indicated metabolites in cells cultured with unlabeled 2.5 mM glucose and 4 mM glutamine for 38 hours followed by 2.5 mM glucose and 4 mM [U-13C]glutamine for an additional 10 hours (n = 4 individual biological replicates). Data are provided as mean ± s.d. (a) or mean ± s.e.m. (b,c). Pairwise comparisons were conducted using two-tailed, unpaired Student’s t-tests. Source data
Extended Data Fig. 4
Extended Data Fig. 4. Impaired growth of IDH1-/- PDAC cells under cancer-associated stress.
a, b, Relative survival as detected by Trypan blue assay in Hs766T cells under serum deprivation for 30 hours (a), or hydrogen peroxide and 2% serum for 72 hours (b) (n = 3 independent biological replicates). c, Relative survival of isogenic MiaPaCa-2 cells cultured in different concentrations of glucose and glutamine for five days (n = 3 independent biological replicates). d, Relative survival of isogenic MiaPaCa-2 cells cultured first in 2.5 mM glucose for 24 hours, followed by CB-839 (1 µM) treatment for an additional 24 hours (n = 3 independent biological replicates). e, Relative survival as detected by PicoGreen assay in IDH1-/- MiaPaCa-2 cells, transiently transfected with empty vector (EV), plasmid overexpressing catalytically active, or catalytically altered (R132H) IDH1, and treated with gemcitabine for 5 days under 5 mM glucose (relative glucose withdrawal from 25 mM baseline glucose) (n = 3 independent biological replicates). f, g, Growth of subcutaneous tumors from MiaPaCa-2 (f, n = 7 tumors per group) and Hs766T (g, IDH1 + / + , n = 5 tumors; IDH1-/- (KO1), n = 5 tumors; IDH1-/- (KO2), n = 4 tumors) in nude mice. h, Western blot analysis of IDH1 protein in xenografts treated with 3DNA-IgG-siCTRL or 3DNA-IgG-siIDH1 treated tumors shown in Fig. 3g (n = 5 tumors per group). Data are provided as mean ± s.d. (a-e) or mean ± s.e.m. (f,g). Pairwise comparisons were conducted using two-tailed, unpaired Student’s t-tests. Source data
Extended Data Fig. 5
Extended Data Fig. 5. The impact of magnesium on pancreatic cancer cell metabolism and allosteric inhibitor binding to IDH1.
a, Wild-type IDH1 from the Protein Database. Mg2+ is believed to interact with D279 (Asp279) in the allosteric pocket (accession number: PDB 1T0L). Under high Mg2+ conditions, the cation outcompetes the allosteric inhibitor, to render the drug ineffective. Under low Mg+2 conditions, the drug inhibits wtIDH1. b, The effect of AG-120 on IDH2 activity (cell-based assay) in MiaPaCa-2 PC cells (a representative of three independent biological replicates with similar results is shown. c, Validation of the fluorescent probe binding to wtIDH1 (n = 2 independent experiments). d, e, ATP levels (d, n = 3 independent biological replicates) and oxygen consumption rates (e, a representative of three independent biological replicates with similar results is shown) in MiaPaCa-2 cells under the indicated conditions. f, Cell viability of PDAC cells, cultured in MgSO4 at the indicated concentrations and 25 mM glucose for five days (n = 3 independent biological replicates). g, The impact of the indicated conditions and treatments on genes involved in magnesium homeostasis in MiaPaCa-2 cells (n = 3 individual biological replicates). Data are provided as mean ± s.d. (b-f). Pairwise comparisons were conducted using two-tailed, unpaired Student’s t-tests. Source data
Extended Data Fig. 6
Extended Data Fig. 6. Effects of AG-120 against PDAC cells under low glucose and low Mg2+ conditions.
a, Sanger sequencing of amplicons correlating with codon 132 of the wtIDH1 gene in PANC-1 pancreatic cancer cells. b, Total ROS levels detected in cells under the indicated treatments (n = 3 independent biological replicates). c, Oxidized DNA in MiaPaCa-2 cells as detected by 8-hydroxy-deoxyguanosine (8-OHdG) levels under 2.5 mM glucose and 0.08 mM Mg2+ for 48 hours (n = 3 independent biological replicates). d, Oxygen consumption rates PANC-1 cells treated with vehicle or AG-120 in media containing 0.08 mM Mg2+ and 2.5 mM glucose for 30 hours (a representative of three independent biological replicates with similar results is shown). e, Isotopologue distribution in PANC-1 cells cultured with unlabeled 2.5 mM glucose for 38 hours followed by incubation with 2.5 mM [U-13C]glucose for an additional 10 hours (n = 4 individual biological replicates). f, g, Relative clonogenic growth of PANC-1 (f, n = 3 independent biological replicates) and HEK293 (g, n = 3 independent biological replicates) cells treated with vehicle or AG-120 for five days under the indicated conditions. h, Percent viability and Bliss independence scores with a combination of AG-120 and oxaliplatin at the indicated doses in MiaPaCa-2 cells cultured in 2.5 mM glucose for five days (n = 3 independent biological replicates). Positive values reflect synergism between these two compounds in the cells. Data are provided as mean ± s.d. (b-d,f,g) or mean ± s.e.m. (e). Pairwise comparisons were conducted using two-tailed, unpaired Student’s t-tests. Source data
Extended Data Fig. 7
Extended Data Fig. 7. AG-120 activity against KPC cells.
a, Sanger sequencing of amplicons correlating with codon 132 of the wtIDH1 gene in KPC murine pancreatic cancer cells (K8484). The reference murine wild-type sequence is shown. b, IDH1 activity of KPC cells treated with AG-120 for 24 hours in media containing 0.08 mM Mg2+ (n = 3 independent biological replicates). c, Relative clonogenic growth of KPC cells under the indicated conditions for 5 days (n = 3 independent biological replicates). d, Relative clonogenic growth of KPC cells with the indicated treatments, cultured with 1 mM glucose and 0.08 mM Mg2 for five days (n = 3 independent biological replicates). e, Growth of KPC subcutaneous xenografts in C57BL/6 J mice under the indicated treatment arms (vehicle, n = 5 tumors; AG-120, n = 4 tumors). f, g, CT/18F-FDG-PET images (f) and SUV values (g) of C57BL/6 J mice bearing orthotopic KPC tumors treated with vehicle or AG-120 (n = 5 mice per group). h, Survival analysis in tamoxifen-inducible KP-/-C (KrasG12D/+; Trp53lox/lox; Pdx1-Cre) mice treated with vehicle (n = 6 mice) or AG-120 (n = 7 mice). Data are provided as mean ± s.d. (b-d) or mean ± s.e.m. (e,g). Pairwise comparisons were conducted using two-tailed, unpaired Student’s t-tests. Longitudinal mixed models were fit for tumor size growth, and time by treatment interactions were assessed. Survival data are represented by Kaplan-Meier curves, and tests for treatment differences were conducted with Fleming-Harrington (0,1) weighted log rank test statistics. Source data
Extended Data Fig. 8
Extended Data Fig. 8. AG-120 activity in colorectal and lung cancer xenograft models.
a, Sanger sequencing of codon 132 of the wtIDH1 gene in HCT116 colorectal and H460 lung cancer cells. b, Relative clonogenic growth of HCT116 cells treated with vehicle, AG-120 (10 µM), and GSH (4 mM) under the indicated concentrations of glucose and Mg2+ for five days (n = 3 independent biological replicates). c, Glucose levels in HCT116 colorectal xenografts harvested from nude mice (n = 7 tumors). d-f, Growth rate of HCT116 xenograft tumors (d, n = 4 tumors per group), and with forced hyperglycemia induced by D30 water consumption (e, n = 3 tumors per group; AG-120 vs AG-120 plus D30: P = 0.0252), or with water containing exogenous MgSO4 (f, n = 3 tumors per group). g, Body weights of nude mice bearing HCT116 xenografts treated as indicated (n = 3 mice per group). h, Relative growth of subcutaneous H460 lung xenografts in nude mice (n = 5 tumors per group). Data are provided as mean ± s.d. (b,e-g) or s.e.m. (c,d,h). Pairwise comparisons were conducted using two-tailed, unpaired Student’s t-test. Longitudinal mixed models were fit for tumor size growth, and time by treatment interactions were assessed. Source data

Similar articles

Cited by

References

    1. Vaziri-Gohar A, Zarei M, Brody JR, Winter JM. Metabolic dependencies in pancreatic cancer. Front. Oncol. 2018;8:617. doi: 10.3389/fonc.2018.00617. - DOI - PMC - PubMed
    1. Whatcott CJ, et al. Desmoplasia in primary tumors and metastatic lesions of pancreatic cancer. Clin. Cancer Res. 2015;21:3561–3568. doi: 10.1158/1078-0432.CCR-14-1051. - DOI - PMC - PubMed
    1. Kamphorst JJ, et al. Human pancreatic cancer tumors are nutrient poor and tumor cells actively scavenge extracellular protein. Cancer Res. 2015;75:544–553. doi: 10.1158/0008-5472.CAN-14-2211. - DOI - PMC - PubMed
    1. Olive KP, et al. Inhibition of Hedgehog signaling enhances delivery of chemotherapy in a mouse model of pancreatic cancer. Science. 2009;324:1457–1461. doi: 10.1126/science.1171362. - DOI - PMC - PubMed
    1. Badgley MA, et al. Cysteine depletion induces pancreatic tumor ferroptosis in mice. Science. 2020;368:85–89. doi: 10.1126/science.aaw9872. - DOI - PMC - PubMed

Publication types