

Meta-analysis of diagnostic cell-free circulating microRNAs for breast cancer detection
- PMID: 35681127
- PMCID: PMC9178880
- DOI: 10.1186/s12885-022-09698-8
Meta-analysis of diagnostic cell-free circulating microRNAs for breast cancer detection
Abstract
Background: Breast cancer (BC) is the most frequently diagnosed cancer among women. Numerous studies explored cell-free circulating microRNAs as diagnostic biomarkers of BC. As inconsistent and rarely intersecting microRNA panels have been reported thus far, we aim to evaluate the overall diagnostic performance as well as the sources of heterogeneity between studies.
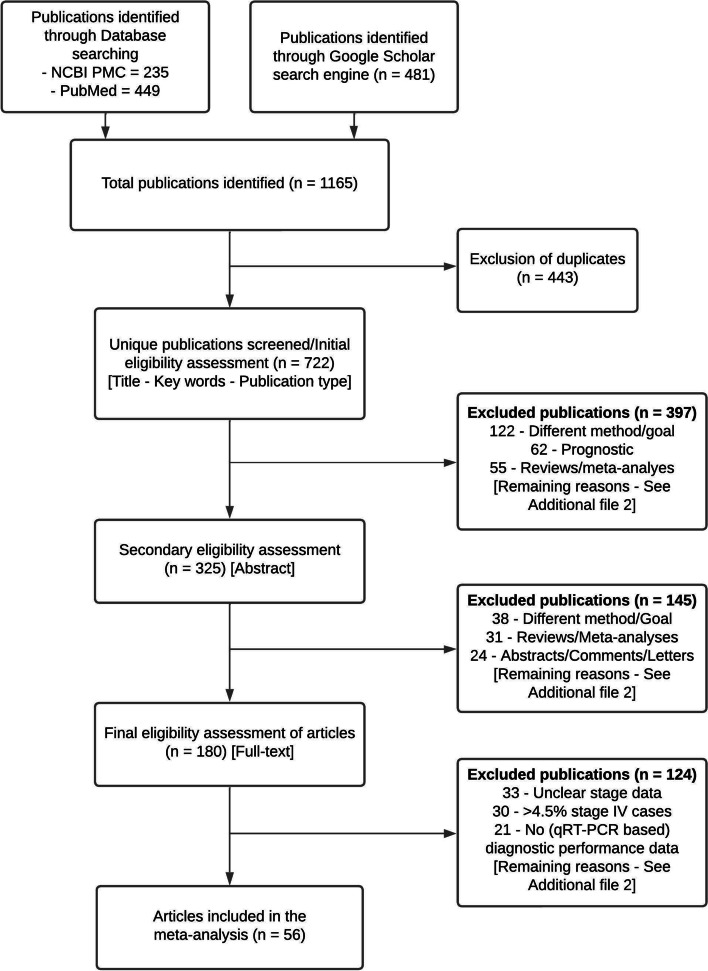
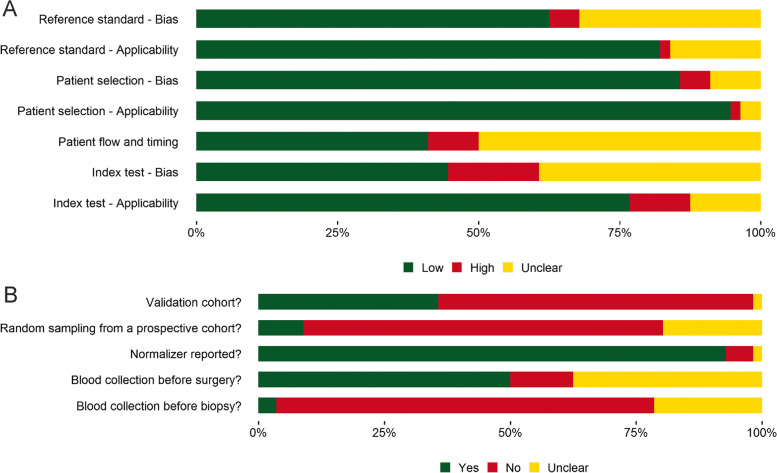
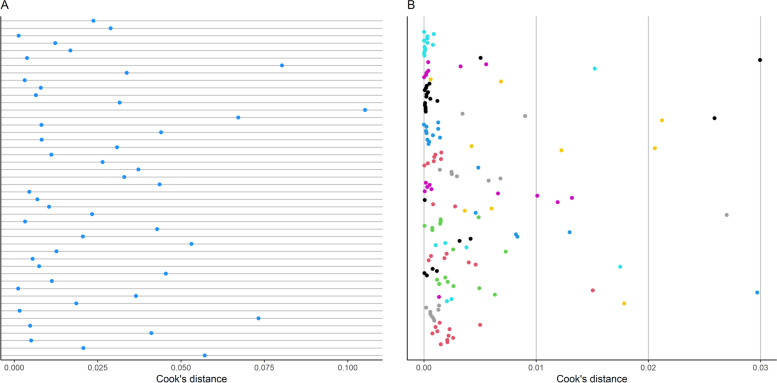
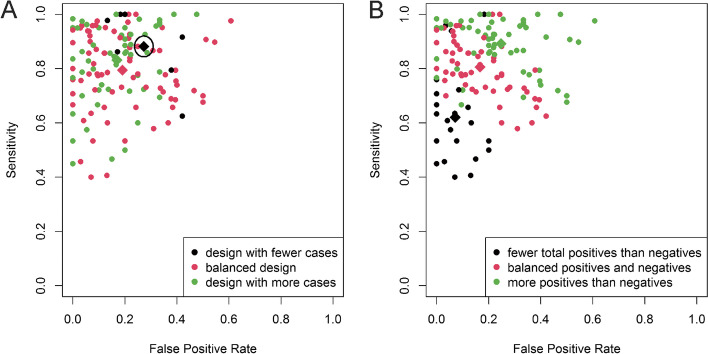
Methods: Based on the search of three online search engines performed up to March 21st 2022, 56 eligible publications that investigated diagnostic circulating microRNAs by utilizing Real-Time Quantitative Reverse Transcription PCR (qRT-PCR) were obtained. Primary studies' potential for bias was evaluated with the revised tool for the quality assessment of diagnostic accuracy studies (QUADAS-2). A bivariate generalized linear mixed-effects model was applied to obtain pooled sensitivity and specificity. A novel methodology was utilized in which the sample and study models' characteristics were analysed to determine the potential preference of studies for sensitivity or specificity.
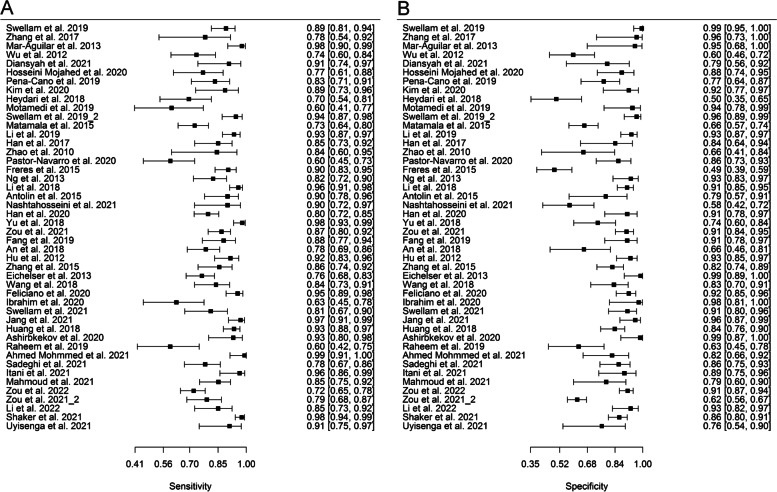
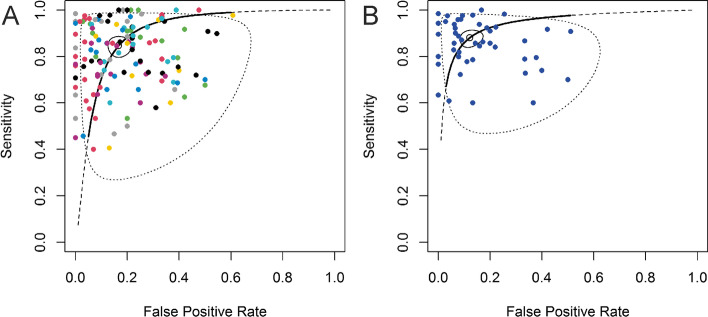
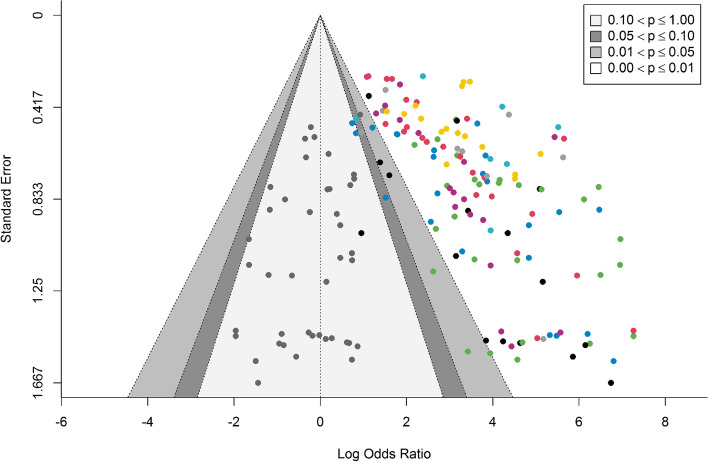
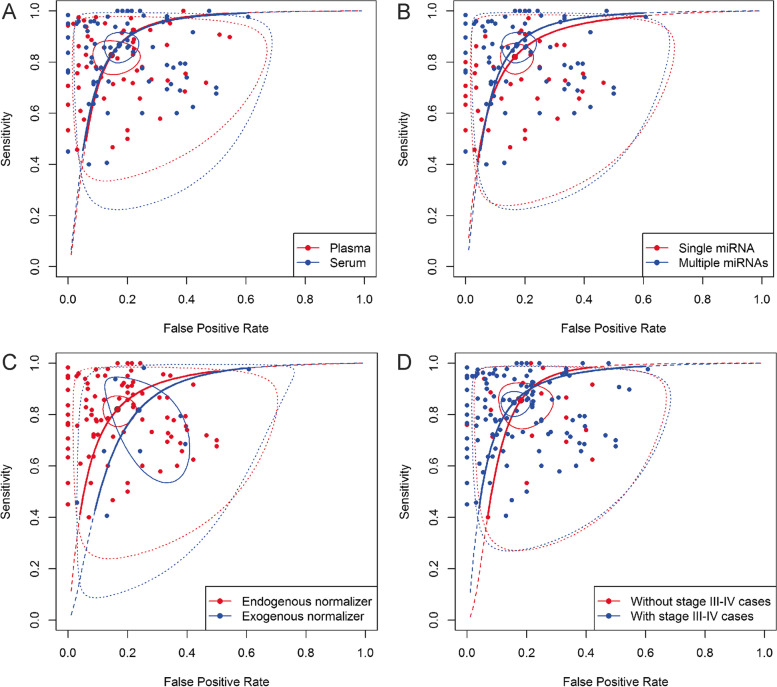
Results: Pooled sensitivity and specificity of 0.85 [0.81-0.88] and 0.83 [0.79-0.87] were obtained, respectively. Subgroup analysis showed a significantly better performance of multiple (sensitivity: 0.90 [0.86-0.93]; specificity: 0.86 [0.80-0.90]) vs single (sensitivity: 0.82 [0.77-0.86], specificity: 0.83 [0.78-0.87]) microRNA panels and a comparable pooled diagnostic performance between studies using serum (sensitivity: 0.87 [0.81-0.91]; specificity: 0.83 [0.78-0.87]) and plasma (sensitivity: 0.83 [0.77-0.87]; specificity: 0.85 [0.78-0.91]) as specimen type. In addition, based on bivariate and univariate analyses, miRNA(s) based on endogenous normalizers tend to have a higher diagnostic performance than miRNA(s) based on exogenous ones. Moreover, a slight tendency of studies to prefer specificity over sensitivity was observed.
Conclusions: In this study the diagnostic ability of circulating microRNAs to diagnose BC was reaffirmed. Nonetheless, some subgroup analyses showed between-study heterogeneity. Finally, lack of standardization and of result reproducibility remain the biggest issues regarding the diagnostic application of circulating cell-free microRNAs.
Keywords: Breast cancer; Circulating cell-free; Diagnostic; Meta-analysis; miRNAs.
© 2022. The Author(s).
Conflict of interest statement
The authors declare that they have no competing interests.
Figures
References
-
- Danckert B, Ferlay J, Engholm G, Hansen H, Johannesen T, Khan S, et al. NORDCAN: Cancer Incidence, Mortality, Prevalence and Survival in the Nordic Countries, Version 8.2. Association of the Nordic Cancer Registries. Danish Cancer Society. 2019 [cited 21 Feb 2021]. Available from: http://www.ancr.nu
Publication types
MeSH terms
Substances
Grants and funding
LinkOut - more resources
Full Text Sources
Medical
Research Materials
