. 2022 Jun 9;14(11):4673-4698.
doi: 10.18632/aging.203241. Epub 2022 Jun 9.

CXCR4 knockdown enhances sensitivity of paclitaxel via the PI3K/Akt/mTOR pathway in ovarian carcinoma

Affiliations

CXCR4 knockdown enhances sensitivity of paclitaxel via the PI3K/Akt/mTOR pathway in ovarian carcinoma

Dan Zi et al. Aging (Albany NY). .

Erratum in

Abstract

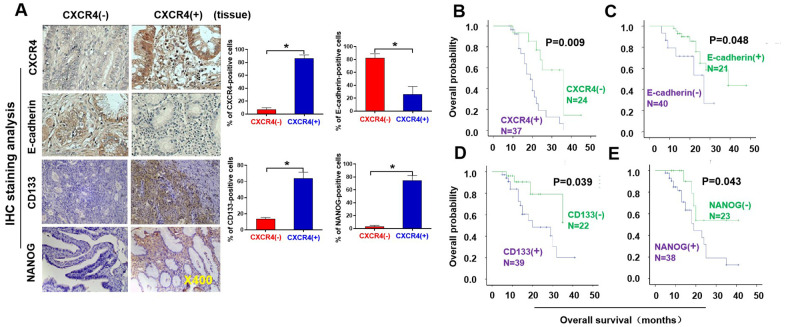
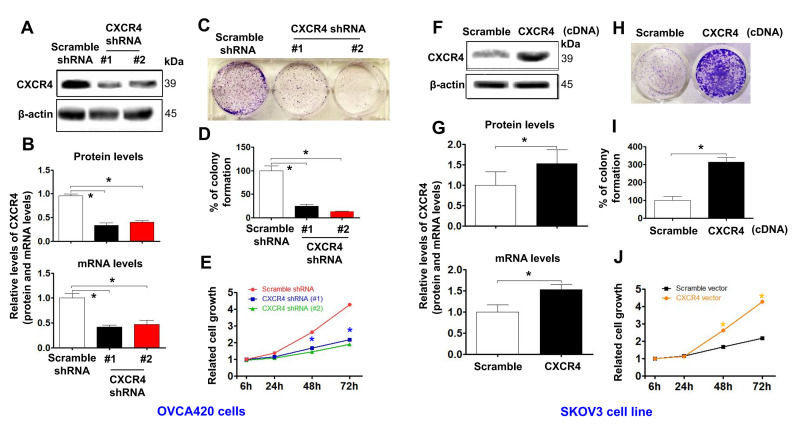
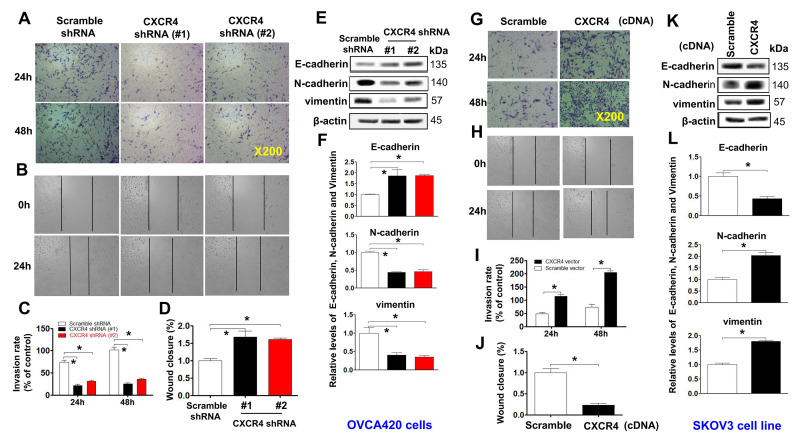
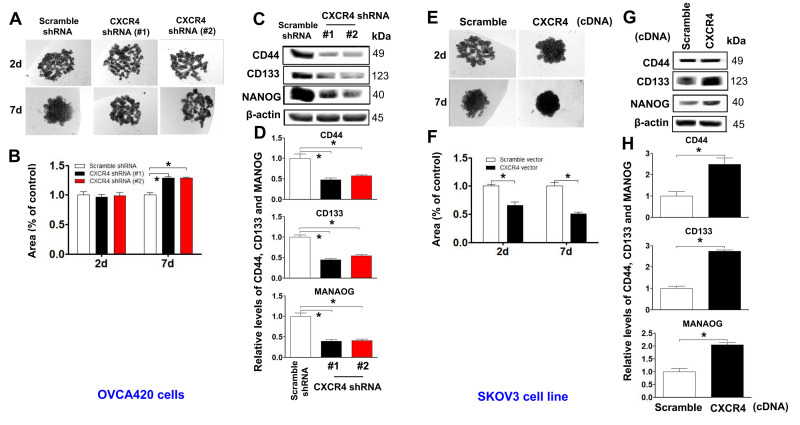
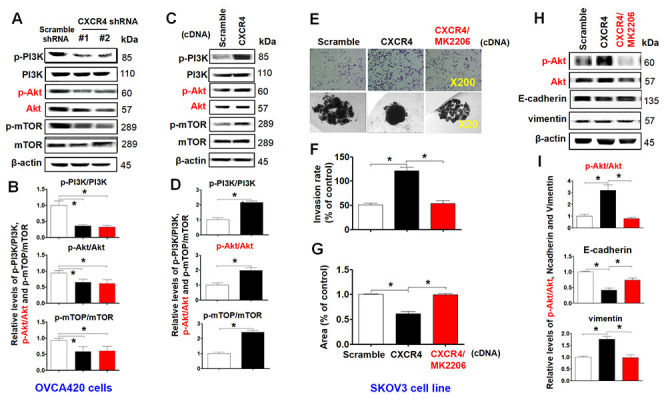
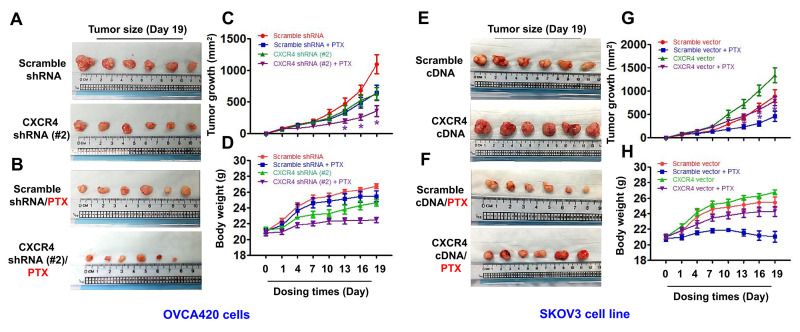
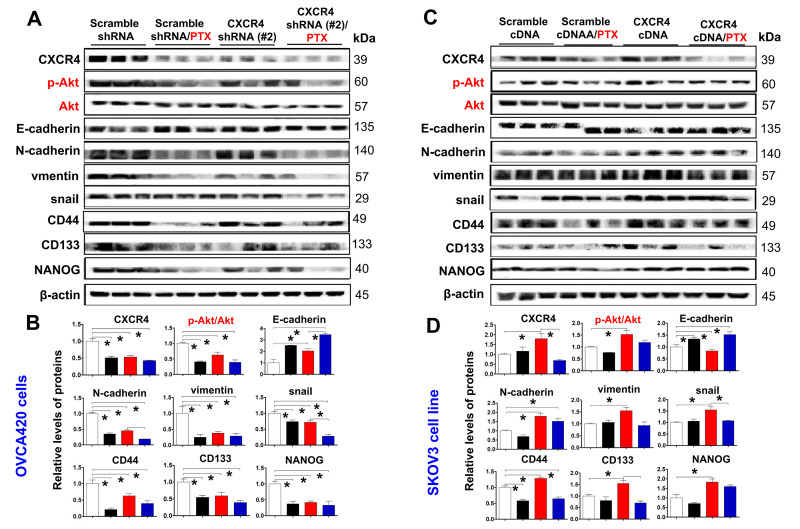
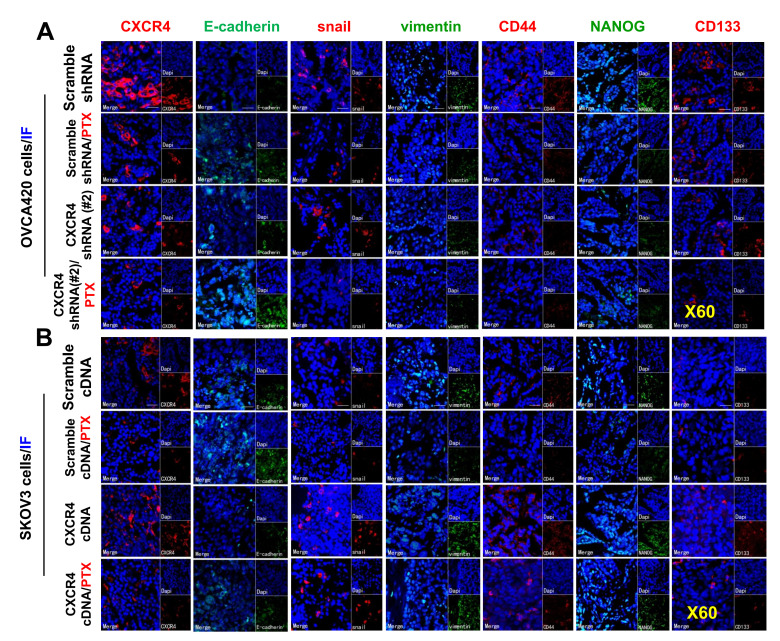
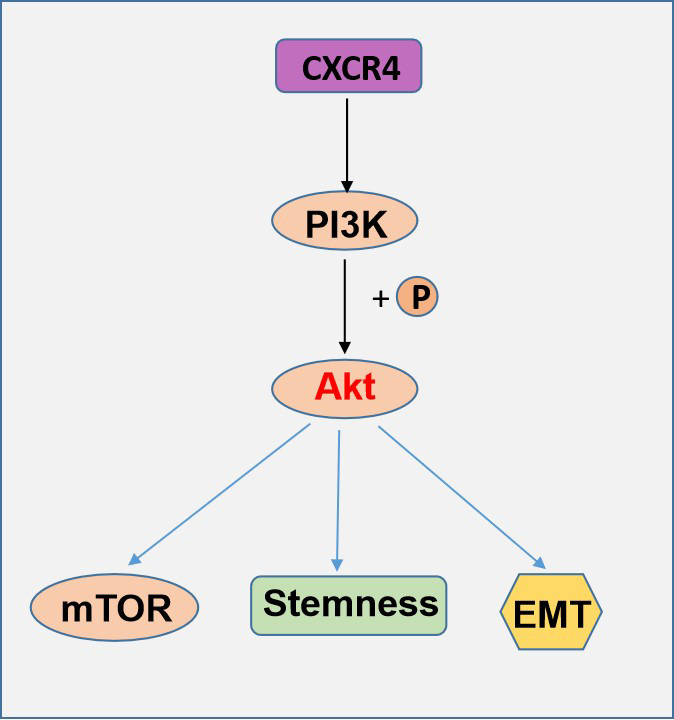
Epithelial ovarian cancer (EOC) is the deadliest gynecological malignancy. EOC control remains difficult, and EOC patients show poor prognosis regarding metastasis and chemotherapy resistance. The aim of this study was to estimate the effect of CXCR4 knockdown-mediated reduction of cancer stem cells (CSCs) and epithelial-mesenchymal transition (EMT) stemness and enhancement of chemotherapy sensitivity in EOC. Mechanisms contributing to these effects were also explored. Our data showed distinct contribution of CXCR4 overexpression by dependent PI3K/Akt/mTOR signaling pathway in EOC development. CXCR4 knockdown resulted in a reduction in CSCs and EMT formation and enhancement of chemotherapy sensitivity in tumor cells, which was further advanced by blocking CXCR4-PI3K/Akt/mTOR signaling. This study also documented the critical role of silencing CXCR4 in sensitizing ovarian CSCs to chemotherapy. Thus, targeting CXCR4 to suppress EOC progression, specifically in combination with paclitaxel (PTX) treatment, may have clinical application value.

Keywords: CSCs; CXCR4; PI3K/Akt/mTOR; PTX; ovarian cancer.


Conflict of interest statement

CONFLICTS OF INTEREST: The authors declare that they have no conflicts of interest.

Figures

Figure 1
Figure 1
Pathological and clinical prognostic analyses of CXCR4, EMT-and CSC-related protein expressions in epithelial ovarian cancer patients. (A) Expressions of CXCR4 and E-cadherin, N-cadherin, CD133, and NANOG in EOC and benign epithelial ovarian tumour tissues were analysed by immunohistochemistry (IHC) staining with the indicated antibody against each protein examined. Notably, presence of CXCR4 expression is in epithelial ovarian cancer (EOC) tissues (mainly located in cytoplasm), but absence of CXCR4 expression in benign epithelial ovarian tumour tissues. E-cadherin expression was higher in CXCR4-negative EOC tissues than in CXCR4-positive samples. Tumour cells in the CXCR4-negative section did not express N-cadherin or vimentin, whereas some tumour cells in the CXCR4-positive section expressed vimentin, snail, CD44, CD133 and NANOG. (BE) Kaplan–Meier survival curve analyses of the association between survival probability and CXCR4, E-cadherin, CD133 and NANOG expression using the log rank test E-cadherin (B); CXCR4 (C), CD133 (D), NONOG (E) expression.
Figure 2
Figure 2
Determining effects of CXCR4 knockdown on diminishing the cancer (EOC) proliferation capacity. CXCR4 expression in CXCR4-kD#1/OVCA420 (CXCR4 shRNA#1), CXCR4-kD#2/OVCA420 (CXCR4 shRNA#2) (A, B) and CXCR4/SKOV3 (CXCR4 cDNA) (F, G) cells were analysed by Western blotting (WB) and qRT-PCR, respectively. The cancer (EOC) proliferation capacity was determined by colony formation assay (C, H) with percentage of colony formation (D, I) in both OVCA420 and SKOV3 stable cell lines modified by CXCR4 knockdown or overexpression, respectively. The MTT assay was used to measure the proliferation of the CXCR4-shRNA knockdown OVCA420 (E) and CXCR4-overexpressed SKOV3 (J), respectively. Absorbance was measured at 490 nm using the average from triplicate wells. Data are presented as the mean ± SD of three independent experiments. Asterisk indicates P<0.05 compared with the controls as determined by t test.
Figure 3
Figure 3
Examining effects of CXCR4 knockdown on decreasing the cancer (EOC) invasion capacity. A transwell tumour cell invasion assay showed that knockdown of CXCR4 reduced the invasion ability of OVCA420 cell lines (A) and that overexpression of CXCR4 enhanced the invasion ability of SKOV3 cells (G). The number of invaded cells were quantified by counting the total number of cells from 10 random fields (magnification, 200X) (C, I). A wound-healing assay showed that knockdown of CXCR4 reduced the migration ability of OVCA420 cells (B, D) and that overexpression of CXCRC4 enhanced the migration ability of SKOV3 cells (H, J), respectively. The effects of CXCR4 on the expression of EMT-related E-cadherin, N-cadherin and vimentin protein levels indicated in both CXCR4-knockdown OVCA420 (E) and -overexpressed SKOV3 (K) cell lines were analysed by WB with the indicated antibody against each protein examined, respectively. Band density ratios of each protein indicated to β-actin were determined by densitometry analysis (F, L). Data are presented as the mean ± SD of three independent experiments. Asterisk indicates P<0.05 compared with the controls as determined by t test.
Figure 4
Figure 4
Determining effects of CXCR4 overexpression on augmenting the cancer (EOC) spheroid formation capacity. A spheroid culture in hanging drops assay showing that knockdown of CXCR4 reduced the spheroid formation ability of OVCA420 cells (A) and that overexpression of CXCRC4 enhanced the spheroid formation ability of SKOV3 cells (E), which were quantified by counting the total spheroid hanging drop area (percentage of control) from both OVCA420 and SKOV3 spheroid culture experiments, respectively (B, F). Accordingly, the CXCR4 effects on expression of CSC-related CD44, CD133 and NANOG proteins in both CXCR4-knockdowned OVCA420 and overexpressed SKOV3 cells were analysed by WB with the indicated antibody against each protein examined, respectively (C, G). Band density ratios of each protein indicated to β-actin were determined by densitometry analysis (D, H). Data are presented as the mean ± SD of three independent experiments. Asterisk indicates P<0.05 compared with the controls as determined by t test.
Figure 5
Figure 5
Characterizing the role of the PI3K/Akt/mTOR pathway in promoting CXCR4 overexpression-mediated ovarian cancer invasion, EMT, and CSC stemness. PI3K/Akt/mTOR pathway-related protein phosphorylated states indicated were analysed in both CXCR4 shRNA knockdowned-OVCA420 and CXCR4 overexpressed SKOV3 cells by WB with the indicated antibody against each protein, respectively (A, C). Band density ratios of phosphorylated-PI3K (p-PI3K), -Akt (p-Akt) and -mTOR to total-PI3K (PI3K), -Akt (Akt) and -mTOR (mTOR) were determined by densitometry analysis, respectively (B, D). Effects of MK-2206 on inhibiting SKOV3 cell invasion induced by CXCR4 overexpressing were analysed by a transwell tumour cell invasion assay (E, upper panel). Effects of MK-2206 on inhibiting SKOV3 cell spheroid formation capacity induced by CXCR4 overexpressing were analysed by a spheroid culture in hanging drops assay (E, lower panel), which were quantified by counting the total number of cells (invasion rate) from 10 random fields (magnification, 200X) (F), and the total spheroid hanging drop area (percentage of control) from the CXCR4-overexpressed SKOV3 culture cell experiments, respectively (G). Furthermore, effects of MK-2206 on inhibiting the expression of p-Akt, Akt, EMT-related proteins (E-cadherin, N-cadherin, vimentin and snail) in the CXCR4 overexpressed SKOV3 cells were analysed by WB with the indicated antibody against each protein examined (H). Band density ratios of p-Akt to Akt, E-cadherin, N-cadherin and vimentin to β-actin were determined by densitometry analysis, respectively (I). Data are presented as the mean ± SD of three independent experiments. Asterisk indicates P<0.05 compared with the controls as determined by t test. Please note that CSC related protein expression profiles in the CXCR4 overexpressed SKOV3 cell line in the presence or absence of MK-2206 treatment were described in the supplementary materials (Supplementary Figure 5).
Figure 6
Figure 6
In vivo evaluating the effects of CXCR4 knockdown and overexpression chemosensitivity of both OVCA420 and SKOV3 tumour cells to PTX treatment in the xenograft tumour nude mouse model. Representative images (day 19) were recorded under macro view representing the size of tumours in the tumour xenograft mice (A, E), when combined with PTX treatment (B, F). Tumour volume (C, G) and body weight (D, H) changes following CXCR4 knockdown and overexpression and, the combined treatment with paclitaxel (PTX) in the OVCA420 and SKOV3 tumour cell xenograft model, respectively. Data represent the means ±S.D. from six nude model mice for each time point examined. Asterisk indicates P< 0.05 compared with the controls as determined by t test.
Figure 7
Figure 7
Ex vivo evaluating the role of CXCR4 knockdown in improving PTX chemosensitivity through reduction of PI3K/Akt/mTOR signalling, EMT- and CSC-related protein expressions. CXCR4, EMT-and CSC-related protein expressions, as well as PI3K/Akt/mTOR signalling pathway in both OVCA420 (A) and SKOV3 (C) cells derived from the tumour xenograft model were analysed by WB using the indicated antibody against each protein examined. Band density ratios of p-Akt to Akt, and CXCR4, E-cadherin, N-cadherin, vimentin and snail, CD44, CD133 and NANOG to β-actin were determined by densitometry analysis, respectively (B, D). Data are presented as the mean ± SD of three independent experiments with triplicated wells for each condition. Asterisk indicates P< 0.05 compared with the control as determined by t test.
Figure 8
Figure 8
Further ex vivo IF examining the expression of CXCR4, EMT- and CSC-related proteins in the OVCA420 and SKOV3 cell xenograft tissues from the tumours nude mice following treatment with PTX. Immunofluorescent (IF) staining analysis images illustrated the location of CXCR4, EMT-, and CSC-related protein expressions in the OVCA420 (A) and SKOV3 (B) cell xenograft tumour tissues. Notably, red fluorescence shows the membrane expression of CXCR4, snail, CD44, and CD133; green fluorescence shows the membrane expression of E-cadherin, vimentin, and NANOG; and blue fluorescence shows all cell nuclei stained with DAPI (4′, 6-diamidino-2-phenylindole). Data represent one of the three independent experiments with similar results. Scale bars=50 μm.
Figure 9
Figure 9
A schematic model of CXCR4 contributes distinctively to PI3K/Akt/mTOR pathway effects in EOC.

References

    1. Lheureux S, Gourley C, Vergote I, Oza AM. Epithelial ovarian cancer. Lancet. 2019; 393:1240–53. 10.1016/S0140-6736(18)32552-2 - DOI - PubMed
    1. Guo Q, Yang Q, Li J, Liu G, Nikoulin I, Jia S. Clinical Trials of Novel Targeted Therapies in Ovarian Cancer: Moving Beyond Poly ADP Ribose Polymerase (PARP) Inhibitors. Curr Pharm Biotechnol. 2018; 19:1114–21. 10.2174/1389201020666181226123054 - DOI - PubMed
    1. Bray F, Ferlay J, Soerjomataram I, Siegel RL, Torre LA, Jemal A. Global cancer statistics 2018: GLOBOCAN estimates of incidence and mortality worldwide for 36 cancers in 185 countries. CA Cancer J Clin. 2018; 68:394–424. 10.3322/caac.21492 - DOI - PubMed
    1. Lheureux S, Braunstein M, Oza AM. Epithelial ovarian cancer: Evolution of management in the era of precision medicine. CA Cancer J Clin. 2019; 69:280–304. 10.3322/caac.21559 - DOI - PubMed
    1. Teicher BA, Fricker SP. CXCL12 (SDF-1)/CXCR4 pathway in cancer. Clin Cancer Res. 2010; 16:2927–31. 10.1158/1078-0432.CCR-09-2329 - DOI - PubMed

Publication types