

Consumption of takeaway and delivery meals is associated with increased BMI and percent fat among UK Biobank participants
- PMID: 35681260
- PMCID: PMC9257477
- DOI: 10.1093/ajcn/nqac078
Consumption of takeaway and delivery meals is associated with increased BMI and percent fat among UK Biobank participants
Abstract
Background: Consumption of meals bought from out-of-home sources is a suggested risk factor for obesity, but the supporting evidence is mixed.
Objectives: To investigate the association between consumption of different types of meals and BMI or percent body fat.
Methods: Data were from the UK Biobank in response to a "Type of Meals Eaten" survey, which specified the sources of the meals consumed over the previous 24 h. Because direction of causality is unknown, the data were analyzed with meal choice as the dependent variable first and then BMI as the dependent variable second.
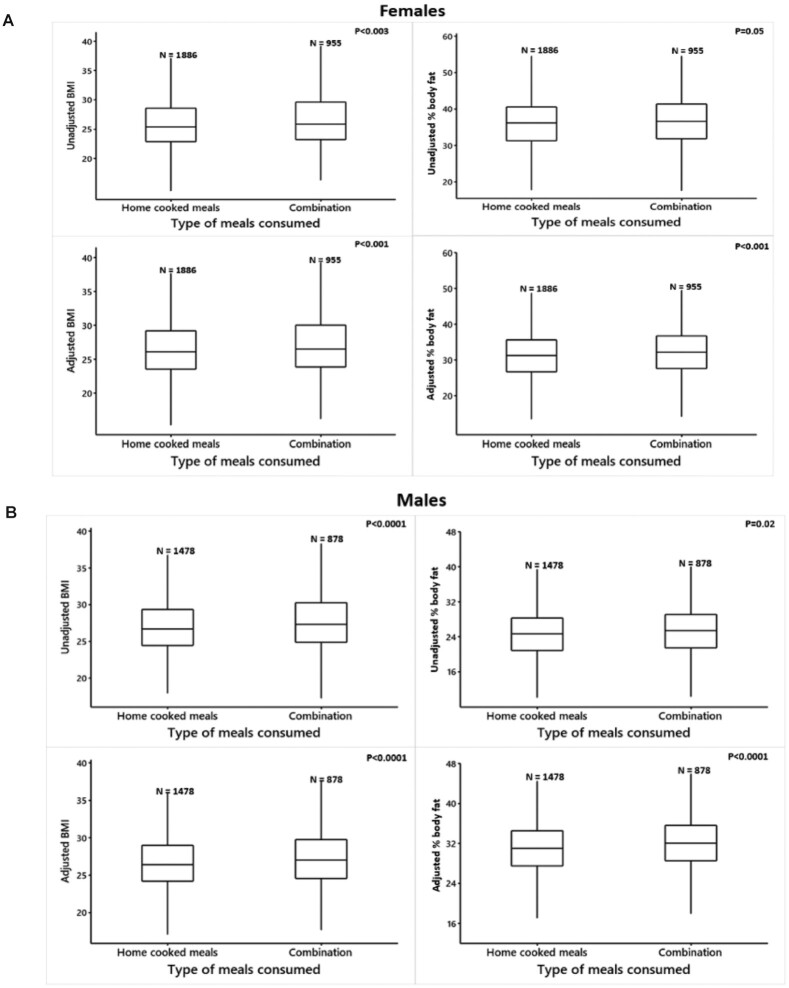
Results: The total number of participants was 5197 (2841 women and 2356 men). Participants with higher BMI and percent body fat were more likely to report consuming takeaway and/or delivery meals, with prevalence ORs (95% CIs) of 2.12 (95% CI: 1.40, 3.22; Bonferroni P < 0.0001) for women's adjusted BMI, 1.95 (95% CI: 1.30, 2.93; Bonferroni P < 0.0001) for women's adjusted percent body fat, 1.65 (95% CI: 1.05, 2.59; Bonferroni P < 0.002) for men's adjusted BMI, and 1.41 (95% CI: 0.70, 2.84; Bonferroni P < 0.01) for men's adjusted percent body fat. As BMI and percent body fat increased, both men and women were increasingly less likely to report having consumed a home-cooked and prepared meal during the previous 24 h. Analyzing the data with BMI and percent body fat as the dependent variable showed that both unadjusted and adjusted BMI and percent body fat were higher in individuals reporting consumption of takeaway and delivery foods the previous day and lower in those consuming homecooked meals. The probability of having consumed a meal that was prepared and eaten at a restaurant and/or café was also associated with BMI and percent fat among men but not women.
Conclusions: Homecooked meals were more often consumed by those with low BMI and percent body fat, whereas delivery and takeaway meals were more often eaten by individuals with higher BMI. Consumption of fast-food/café meals was not consistently associated with BMI or percent body fat. The direction of causality in these associations cannot be inferred from this cross-sectional study.
Keywords: fast food; homemade meals; obesity; ready meals; takeaways; type of meals.
© The Author(s) 2022. Published by Oxford University Press on behalf of the American Society for Nutrition.
Figures


Comment in
-
Does excessive fast-food consumption impair our health?Am J Clin Nutr. 2022 Jul 6;116(1):11-12. doi: 10.1093/ajcn/nqac110. Am J Clin Nutr. 2022. PMID: 35679428 No abstract available.
References
-
- le Roux CW, Hartvig NV, Haase CL, Nordsborg RB, Olsen AH, Satylganova A. Obesity, cardiovascular risk and healthcare resource utilization in the UK. Eur J Prev Cardiol. [epub ahead of print 27 May 2020]. In press. - PubMed
-
- National Health Services (NHS) . Hospital admissions where obesity is a factor increased by 18 per cent. England: NHS digital; 2018.
-
- National Health Services (NHS) . Statistics on obesity, physical activity and diet. England: NHS digital; 2021.
-
- Abarca-Gómez L, Abdeen ZA, Hamid ZA, Abu-Rmeileh NM, Acosta-Cazares B, Acuin Cet al. Worldwide trends in body-mass index, underweight, overweight, and obesity from 1975 to 2016: a pooled analysis of 2416 population-based measurement studies in 128.9 million children, adolescents, and adults. Lancet. 2017;390(10113):2627–42. - PMC - PubMed
Publication types
MeSH terms
Grants and funding
LinkOut - more resources
Full Text Sources
