. 2022 May 26;14(11):2629.
doi: 10.3390/cancers14112629.

Proteomic Analysis of Lung Cancer Types-A Pilot Study

Affiliations

Proteomic Analysis of Lung Cancer Types-A Pilot Study

Simon Sugár et al. Cancers (Basel). .

Abstract

Lung cancer is the leading cause of tumor-related mortality, therefore significant effort is directed towards understanding molecular alterations occurring at the origin of the disease to improve current treatment options. The aim of our pilot-scale study was to carry out a detailed proteomic analysis of formalin-fixed paraffin-embedded tissue sections from patients with small cell or non-small cell lung cancer (adenocarcinoma, squamous cell carcinoma, and large cell carcinoma). Tissue surface digestion was performed on relatively small cancerous and tumor-adjacent normal regions and differentially expressed proteins were identified using label-free quantitative mass spectrometry and subsequent statistical analysis. Principal component analysis clearly distinguished cancerous and cancer adjacent normal samples, while the four lung cancer types investigated had distinct molecular profiles and gene set enrichment analysis revealed specific dysregulated biological processes as well. Furthermore, proteins with altered expression unique to a specific lung cancer type were identified and could be the targets of future studies.

Keywords: NSCLC; SCLC; cancer; gene set enrichment analysis; human tissue; lung cancer; lung tissue; mass spectrometry; proteomics.


Conflict of interest statement

The authors declare no conflict of interest.

Figures
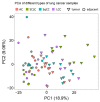
Figure 1
Figure 1
PCA of the different samples analyzed. Triangles and circles indicate tumor and tumor-adjacent samples, respectively. Different colors mark different LC types (red for AC, green for SCLC, turquoise for SqCC, and purple for LCC).
Figure 2
Figure 2
Volcano plot of all quantified proteins. Fold-change and p-values were calculated between all tumor and all adjacent tissue samples. Blue—significantly under-expressed in LC (FC < 0.5), red—significantly overexpressed in LC (FC > 2).
Figure 3
Figure 3
Venn diagram displaying the proteins differentially expressed in the different LC types compared to adjacent tissue.
Figure 4
Figure 4
Box plots of protein examples for distinct expression patterns observed. (a) Cysteine-rich protein 2 showed under-expression in only LCC tumor tissue. (b) Tenascin-X was under-expressed in all tumor tissue types compared to adjacent tissue. (c) Heat shock 70 kDa protein 1A did not show differential expression between any tissue-pairs. (d) Lamina-associated polypeptide 2, isoform alpha was overexpressed in only SCLC tumor tissue. (e) Immunoglobulin heavy constant gamma 2 was overexpressed in AC tumor, while under-expressed in SCLC tumor compared to adjacent tissue. (f) Eukaryotic translational initiation factor 1 was overexpressed in AC tumor while under-expressed in all other tumor types compared to adjacent tissue. Boxes that represent adjacent tissue are striped, while tumor tissue are filled without pattern.
Figure 5
Figure 5
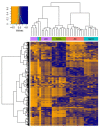
Heatmap with hierarchical clustering of the 571 proteins showing differential expression between the tumorous regions of the 4 LC types investigated (Protein LFQ Intensity values are Z-scored). The histogram in the top left corner shows the correspondence between color hues and values.
Figure 6
Figure 6
Interaction network of gene sets based on the GSEA results for Gene Ontology Biological Process terms enriched in SCLC. Nodes representing suppressed gene sets are colored blue, while red for elevated gene sets. Furthermore, node sizes indicate the number of genes (proteins) detected.

References

    1. Sung H., Ferlay J., Siegel R.L., Laversanne M., Soerjomataram I., Jemal A., Bray F. Global Cancer Statistics 2020: GLOBOCAN Estimates of Incidence and Mortality Worldwide for 36 Cancers in 185 Countries. CA Cancer J. Clin. 2021;71:209–249. doi: 10.3322/caac.21660. - DOI - PubMed
    1. Siegel R.L., Miller K.D., Fuchs H.E., Jemal A. Cancer Statistics, 2021. CA Cancer J. Clin. 2021;71:7–33. doi: 10.3322/caac.21654. - DOI - PubMed
    1. Nicholson A.G., Tsao M.S., Beasley M.B., Borczuk A.C., Brambilla E., Cooper W.A., Dacic S., Jain D., Kerr K.M., Lantuejoul S., et al. The 2021 WHO Classification of Lung Tumors: Impact of Advances Since 2015. J. Thorac. Oncol. 2022;17:362–387. doi: 10.1016/j.jtho.2021.11.003. - DOI - PubMed
    1. Inamura K. Lung Cancer: Understanding Its Molecular Pathology and the 2015 WHO Classification. Front. Oncol. 2017;7:193. doi: 10.3389/fonc.2017.00193. - DOI - PMC - PubMed
    1. Pender A., Popat S. Understanding lung cancer molecular subtypes. Clin. Pract. 2014;11:441–453. doi: 10.2217/cpr.14.39. - DOI

LinkOut - more resources