. 2022 May 26;14(11):2644.
doi: 10.3390/cancers14112644.

Unveiling the Molecular Mechanisms Driving the Capsaicin-Induced Immunomodulatory Effects on PD-L1 Expression in Bladder and Renal Cancer Cell Lines

Affiliations

Unveiling the Molecular Mechanisms Driving the Capsaicin-Induced Immunomodulatory Effects on PD-L1 Expression in Bladder and Renal Cancer Cell Lines

Maria Beatrice Morelli et al. Cancers (Basel). .

Abstract

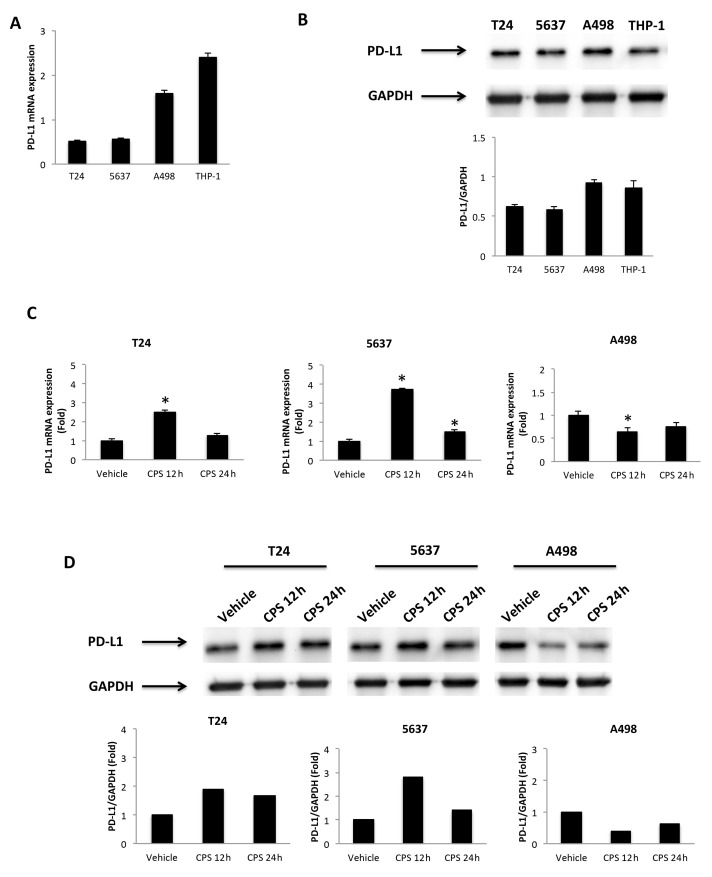
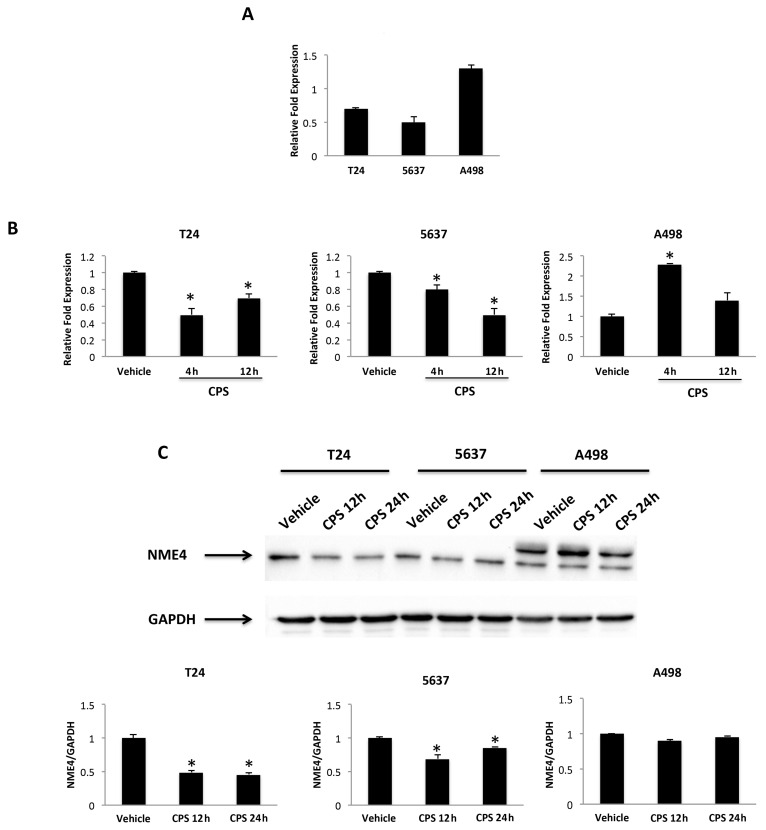
The blockade of the PD-L1/PD-1 immune checkpoint has promising efficacy in cancer treatment. However, few patients with bladder cancer (BC) or renal cell carcinoma (RCC) respond to this approach. Thus, it is important to implement a strategy to stimulate the immune anti-tumor response. In this scenario, our study evaluated the effects of a low capsaicin (CPS) dose in BC and RCC cell lines. Western blot, qRT-PCR and confocal microscopy were used to assess PD-L1 mRNA and protein expression. Alterations to the cellular oxidative status and changes to the antioxidant NME4 levels, mRNA modulation of cytokines, growth factors, transcriptional factors and oncogene, and the activation of Stat1/Stat3 pathways were examined using Western blot, cytofluorimetry and qRT-PCR profiling assays. In BC, CPS triggers an altered stress oxidative-mediated DNA double-strand break response and increases the PD-L1 expression. On the contrary, in RCC, CPS, by stimulating an efficient DNA damage repair response, thus triggering protein carbonylation, reduces the PD-L1 expression. Overall, our results show that CPS mediates a multi-faceted approach. In modulating PD-L1 expression, there is a rationale for CPS exploitation as a stimulus that increases BC cells' response to immunotherapy or as an immune adjuvant to improve the efficacy of the conventional therapy in RCC patients.

Keywords: PD-L1; bladder cancer; capsaicin; genitourinary cancer; immunotherapy; renal cell carcinoma.


Conflict of interest statement

The authors declare no competing financial interest.

Figures

Figure 1
Figure 1
CPS effects on T24, 5637 and A498 cell lines. (A) Cell viability was evaluated by 3-(4,5-dimethylthiazol-2-yl)-2,5-diphenyltetrazolium bromide (MTT) assay in T24, 5637 and A498 cells treated with different doses of CPS for up to 72 h. Data shown are expressed as mean ± SE of three separate experiments; * p < 0.05. (B) T24, 5637 and A498 cells were treated with 50 μM CPS for 24 h and then PI incorporation was analyzed by flow cytometry. Histograms are representative of one of three separate experiments. (C) Representative immunoblots for H2AX expression levels in total cellular lysates from T24, 5637 and A498 cells treated with CPS for up to 24 h. Blots are representative of one of three separate experiments. H2AX densitometry values were normalized to GAPDH, used as the loading control. The H2AX protein levels were determined with respect to time 0. Data are expressed as mean ± SD; * p < 0.001. Detailed information about the Western blotting can be found in Figure S5.
Figure 2
Figure 2
CPS treatment influences PD-L1 expression. (A) The relative PD-L1 mRNA expression in T24, 5637, A498 and THP-1 (positive control) cell lines was evaluated by qRT-PCR. PD-L1 mRNA levels were normalized for GAPDH expression. Data are expressed as mean ± SD. (B) Western blot analysis of PD-L1 protein levels. Blots are representative of one of three separate experiments. PD-L1 densitometry values were normalized to GAPDH, used as the loading control. Data are expressed as mean ± SD. (C) PD-L1 mRNA expression in T24, 5637 and A498 cell lines treated with 50 μM CPS for 12 and 24 h was evaluated by qRT-PCR. PD-L1 mRNA levels were normalized for GAPDH expression. Data are expressed as mean ± SD; * p < 0.05. (D) Western blot analysis of PD-L1 protein expression in T24, 5637 and A498 cell lines treated with 50 μM CPS for 12 and 24 h. Blots and densitometry values are representative of one of three separate experiments. PD-L1 densitometry values were normalized to GAPDH, used as the loading control. The PD-L1 protein levels of treated cells were determined with respect to PD-L1 levels of vehicle-treated cells. Detailed information about the Western blotting can be found in Figure S6.
Figure 3
Figure 3
PD-L1 localization in CPS-treated cells. Confocal microscopy analysis of PD-L1 expression in T24, 5637 and A498 cells treated with CPS. Cells were stained with anti-human PD-L1 followed by Alexa Fluor-594 secondary Ab. We used 40,6-diamidino-2-phenylindole (DAPI) to counterstain nuclei. MFI = mean fluorescence intensity. Data are expressed as mean ± SEM; * p < 0.01 vs. vehicle-treated cells.
Figure 4
Figure 4
(A) Relative ATM and CHK2 mRNA expression in T24, 5637 and A498 cells treated with CPS for 4 and 12 h was evaluated by quantitative reverse transcription (qRT)-PCR. ATM and CHK2 mRNA levels were normalized for GAPDH expression and expressed as the fold with respect to the vehicle. (B) Relative TERT and BRCA1 mRNA expression in T24, 5637 and A498 cells treated with CPS for 4 and 12 h was evaluated by qRT-PCR. TERT and BRCA1 mRNA levels were normalized for GAPDH expression. Data are expressed as mean ± SD. (C) Immunoblot representative of pATM and ATM protein levels in A498 cell line. pATM densitometry values were normalized to ATM, and ATM densitometry values were normalized for β-actin expression, used as the loading control. Data are expressed as mean ± SD; * p < 0.05 vs. vehicle-treated cells. (D) Immunoblot representative of total and phosphorylated CHK2 protein levels in T24, 5637 and A498 cell lines. Densitometry values of CHK2 phosphorylated forms were normalized to total CHK2, and CHK2 densitometry values were normalized for β-actin expression, used as the loading control. Data are expressed as mean ± SD; * p < 0.05 vs. vehicle-treated cells. Detailed information about the Western blotting can be found in Figure S7.
Figure 5
Figure 5
CPS treatment influences PD-L1 expression in a TRPV1-dependent manner. (A) Immunoblot representative of TRPV1 expression in T24, 5637 and A498 cell lines. TRPV1 densitometry values were normalized to GAPDH, used as the loading control. Data are expressed as mean ± SD; * p < 0.001 vs. BC cells. (B) Immunoblot representative of TRPV1 expression in T24 and 5637 cells pretreated with CPZ and then stimulated with CPS for 12 h. TRPV1 densitometry values were normalized to GAPDH, used as the loading control. Data are expressed as mean ± SD; * p < 0.01 vs. vehicle-treated cells, # p < 0.05 vs. CPS-treated cells. Detailed information about the Western blotting can be found in Figure S8.
Figure 6
Figure 6
CPS influences PD-L1 protein levels via ROS production. (A) ROS generation in A498 cells pretreated with NAC for 1 h and then treated with 50 μM CPS for up to 24 h. Cells were stained with DCFDA before flow cytometric analysis. MFI = mean fluorescence intensity. (B) Immunoblot representative of PD-L1 expression in A498 cells pretreated with NAC and then stimulated with CPS for 12 h. PD-L1 densitometry values were normalized to GAPDH, used as the loading control. Data are expressed as the mean ± SD; * p < 0.05 vs. vehicle-treated cells, # p < 0.05 vs. CPS treated cells. (C) Carbonyl groups generated by oxidative stress were subjected to DNPH derivatization, and increases in oxidatively modified proteins were detected with an antibody against DNP after size fractionation followed by Western blotting. Quantification of total protein carbonylation was performed, normalizing the densitometry values to GAPDH, used as the loading control. The image is representative of three independent experiments; * p < 0.01 vs. vehicle-treated cells. (D) Immunoblot representative of PD-L1 expression in T24 and 5637 cells pretreated with NAC and then stimulated with CPS for 12 h. PD-L1 densitometry values were normalized to GAPDH, used as the loading control. Data are expressed as the mean ± SD; * p < 0.05 vs. vehicle-treated cells, # p < 0.05 vs. CPS treated cells. Detailed information about the Western blotting can be found in Figure S9.
Figure 7
Figure 7
CPS treatment influences NME4 expression. (A) Relative NME4 mRNA expression in T24, 5637 and A498 cell lines was evaluated by qRT-PCR. NME4 mRNA levels were normalized for GAPDH expression. Data are expressed as mean ± SD. (B) Relative NME4 mRNA expression in T24, 5637 and A498 cell lines treated with CPS for 4 and 12 h was evaluated by qRT-PCR. NME4 mRNA levels were normalized for GAPDH expression. Data are expressed as mean ± SD; * p < 0.05 vs. vehicle-treated cells. (C) Western blot analysis of NME4 protein levels in T24, 5637 and A498 cell lines treated with CPS for 12 and 24 h. Blots are representative of one of three separate experiments. NME4 densitometry values were normalized to GAPDH, used as the loading control. Data are expressed as mean ± SD; * p < 0.05 vs. vehicle-treated cells. Detailed information about the Western blotting can be found in Figure S10.
Figure 8
Figure 8
CPS effects on Stat1 and Stat3 activation. Western blot analysis of Stat1, Stat1α (pTyr701), Stat1β (pTyr701), pStat3 (pSer727), Stat3α (pTyr705), Stat3β (pTyr705) and Stat3 protein expression in T24, 5637 and A498 cell lines treated with 50 μM CPS for 12 and 24 h. Blots are representative of one of three separate experiments. Stat1α (pTyr701) and Stat1β (pTyr701) densitometry values were normalized to Stat1. Stat3 (pSer727), Stat3α (pTyr705) and Stat3β (pTyr705) densitometry values were normalized to Stat3. Stat1 and Stat3 densitometry values were normalized to β-actin, used as the loading control. Stat1 and Stat3 protein levels of treated cells were determined with respect to their levels in untreated cells. No differences were observed between untreated cells and vehicle-treated cells. Data are representative of three different experiments; * p < 0.01. Detailed information about the Western blotting can be found in Figure S11.
Figure 9
Figure 9
Molecular mechanisms of CPS-induced PD-L1 modulation in BC and RCC lines. ROS, reactive oxygen species; DDR, DNA damage response; DSB, double-strand breaks; mut, mutant; WT, wild-type; +, increased/activated; -, decreased/deactivated.

Similar articles

Cited by

References

    1. Sanli O., Dobruch J., Knowles M.A., Burger M., Alemozaffar M., Nielsen M.E., Lotan Y. Bladder Cancer. Nat. Rev. Dis. Primers. 2017;3:17022. doi: 10.1038/nrdp.2017.22. - DOI - PubMed
    1. Nielsen M.E., Smith A.B., Meyer A.-M., Kuo T.-M., Tyree S., Kim W.Y., Milowsky M.I., Pruthi R.S., Millikan R.C. Trends in Stage-Specific Incidence Rates for Urothelial Carcinoma of the Bladder in the United States: 1988 to 2006. Cancer. 2014;120:86–95. doi: 10.1002/cncr.28397. - DOI - PMC - PubMed
    1. Hsieh J.J., Purdue M.P., Signoretti S., Swanton C., Albiges L., Schmidinger M., Heng D.Y., Larkin J., Ficarra V. Renal Cell Carcinoma. Nat. Rev. Dis. Primers. 2017;3:17009. doi: 10.1038/nrdp.2017.9. - DOI - PMC - PubMed
    1. Inman B.A., Harrison M.R., George D.J. Novel Immunotherapeutic Strategies in Development for Renal Cell Carcinoma. Eur. Urol. 2013;63:881–889. doi: 10.1016/j.eururo.2012.10.006. - DOI - PubMed
    1. Meskawi M., Sun M., Trinh Q.-D., Bianchi M., Hansen J., Tian Z., Rink M., Ismail S., Shariat S.F., Montorsi F., et al. A Review of Integrated Staging Systems for Renal Cell Carcinoma. Eur. Urol. 2012;62:303–314. doi: 10.1016/j.eururo.2012.04.049. - DOI - PubMed

Grants and funding