. 2022 May 30;14(11):2699.
doi: 10.3390/cancers14112699.

In Silico Investigations of Multi-Drug Adaptive Therapy Protocols

Affiliations

In Silico Investigations of Multi-Drug Adaptive Therapy Protocols

Daniel S Thomas et al. Cancers (Basel). .

Abstract

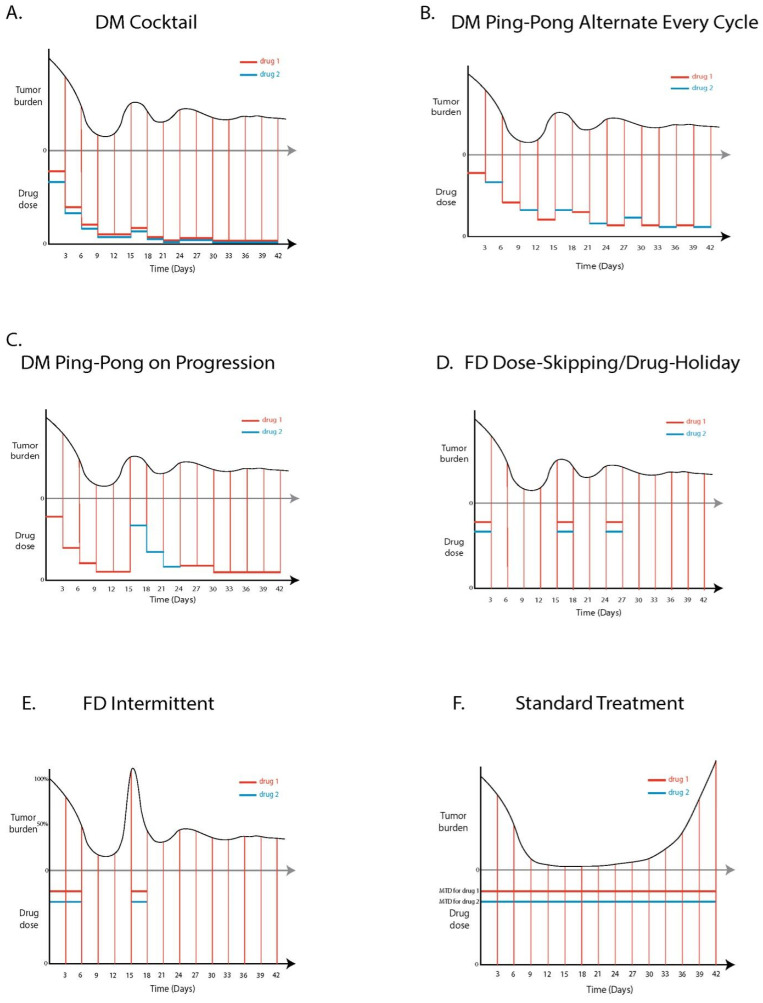
The standard of care for cancer patients aims to eradicate the tumor by killing the maximum number of cancer cells using the maximum tolerated dose (MTD) of a drug. MTD causes significant toxicity and selects for resistant cells, eventually making the tumor refractory to treatment. Adaptive therapy aims to maximize time to progression (TTP), by maintaining sensitive cells to compete with resistant cells. We explored both dose modulation (DM) protocols and fixed dose (FD) interspersed with drug holiday protocols. In contrast to previous single drug protocols, we explored the determinants of success of two-drug adaptive therapy protocols, using an agent-based model. In almost all cases, DM protocols (but not FD protocols) increased TTP relative to MTD. DM protocols worked well when there was more competition, with a higher cost of resistance, greater cell turnover, and when crowded proliferating cells could replace their neighbors. The amount that the drug dose was changed, mattered less. The more sensitive the protocol was to tumor burden changes, the better. In general, protocols that used as little drug as possible, worked best. Preclinical experiments should test these predictions, especially dose modulation protocols, with the goal of generating successful clinical trials for greater cancer control.

Keywords: adaptive therapy; agent-based model; cancer; dose modulation; drug resistance; evolution.


Conflict of interest statement

The authors declare no conflict of interest. The funders had no role in the design of the study; in the collection, analyses, or interpretation of data; in the writing of the manuscript, or in the decision to publish the results.

Figures

Figure 1
Figure 1
Process overview and scheduling. Cells die as a function of their sensitivity to the drugs, the available drug concentrations and the background death function. A cell divides as a function of its doubling time (resistant cells have slower doubling times). The effects of cell crowding, cell cannibalism and contact inhibition are represented by a probability of replacing a neighbor if there is no open space.
Figure 2
Figure 2
Mutation Schematic. A given cell type can mutate to any other cell type but itself with an equal probability of 10−3 per cell division. Doubly sensitive cells can mutate to become doubly resistant cells in one step (e.g., due to multiple drug resistance mechanisms [38]) or via an intermediate step of singly resistant cells. Resistant cells can also mutate to become sensitive again. This may represent epigenetic forms of resistance that are easily reversible.
Figure 3
Figure 3
Two-drug adaptive therapy protocols, comparing variations of dose modulation (DM) and fixed dose (FD) adaptive therapy. Each panel shows on top, an example of how tumor burden might fluctuate over time, and below, how the dosing of the two drugs would be adjusted in response to the change in the tumor burden. Tumor burden is measured every 3 days (indicated with vertical lines). (A) DM Cocktail increases the dose of both drugs if the tumor is growing, and reduces the dose of both drugs if the tumor is shrinking. (B) DM Ping-Pong Alternate Every Cycle uses one drug at a time, but alternates drugs every 3 days, and adjusts the dose depending on how the tumor responded to the drug the last time it was applied. (C) DM Ping-Pong on Progression also uses one drug at a time, reducing the dose if the tumor is shrinking, but switching drugs if the tumor grows. (D) FD Dose-Skipping/Drug Holiday is similar to the AT-2 algorithm from [17], a fixed dose is applied every time the tumor grows, but the dose is skipped if the tumor remains stable or shrinks. (E) FD Intermittent is similar to the adaptive therapy prostate cancer trial from [18], where a fixed dose is applied until the tumor shrinks below 50% of its initial size. Dosing is restarted if the tumor grows above 100% of its original size. Tick marks on the tumor burden axis at 50% and 100% represent absolute values that trigger administering or withholding dosages of drugs for FD Intermittent. (F) Standard treatment applies both drugs at maximum tolerated dose (MTD).
Figure 4
Figure 4
Two-drug therapies, comparing standard of care standard treatment (ST) versus variations of dose modulation (DM) and fixed dose (FD) adaptive therapy. Tumor burden was measured every 3 days. ST applied the maximum tolerated dose at each measurement. (A) Survival curves for DM adaptive therapy protocols (DM Cocktail Tandem, DM Ping-Pong Alternate Every Cycle, and DM Ping-Pong on Progression) and FD adaptive therapy protocols (FD Dose-Skipping/Drug Holiday and FD Intermittent) compared with ST. The dose modulation protocols uniformly worked better than the other protocols. (B) Cell population dynamics for a tumor treated with the ST protocol (continuous MTD). Therapy started at about day 20 when the tumor reached 5000 cells. The results clearly show the effects of competitive release, leading to rapid progression. (C) Cell population dynamics for a tumor treated with the DM Ping-Pong on Progression protocol, controlling the doubly resistant cells. There was a dip in tumor burden at about 125 days owing to switching from a low dose of drug 1 to a high dose of drug 2. (D) Cell population dynamics for a tumor treated with the DM Ping-Pong on Progression protocol resulting in the less frequent outcome of progression. At around day 70, therapy killed almost all the sensitive and singly resistant cells, leaving insufficient cells to keep the doubly resistant cells in check. (E) Cell population dynamics for a tumor treated with FD Dose-Skipping/Drug Holiday resulting in rapid progression. (F) Cell population dynamics for a tumor treated with the FD Intermittent protocol resulting in progression. Populations of the doubly resistant cells (in yellow) are indicated by arrows. In addition, the total tumor burden (gray), the number of cells sensitive to both drugs (Doubly Sen, in orange), the number of cells resistant to drug 1 but sensitive to drug 2 (Res Drug 1, in sky blue), and the number of cells resistant to drug 2 but sensitive to drug 1 (Res Drug 2, in bluish green), are shown.
Figure 5
Figure 5
Role of fitness cost in determining the outcome of adaptive therapy with 2 drugs. The panels show the comparison of adaptive therapy (AT) versus standard treatment (ST) as fitness cost for resistance is varied for (A) DM Cocktail Tandem, (B) DM Ping-Pong Alternate Every Cycle, (C) DM Ping-Pong on Progression, (D) FD Dose-Skipping/Drug-Holiday, (E) FD Intermittent. 5× fitness cost is the default, with the division rate of doubly sensitive cells being 0.06/h, doubly resistant cells being 0.02/h, and that of the singly resistant cells being 0.04/h, while the death rate of all cell types was 0.01/h, translating to a net growth rate of the doubly sensitive cells at 5 times (5×) that of the doubly resistant cells. We compared this to a 3× fitness cost, with the division rate of doubly sensitive cells being 0.04/h, doubly resistant cells being 0.02/h, and singly resistant cells being 0.03/h, while the death rate of all cell types was 0.01/h, translating to a net growth rate of the doubly sensitive cells at 3 times (3×) that of the doubly resistant cells.
Figure 6
Figure 6
Effect of turnover on outcome of adaptive therapy with 2 drugs. The panels show the comparison of adaptive therapy (AT) versus standard treatment (ST) as turnover is varied while keeping the doubling time and net growth rate identical for (A) DM Cocktail Tandem, (B) DM Ping-Pong Alternate Every Cycle, (C) DM Ping-Pong on Progression, (D) FD Dose-Skipping/Drug-Holiday, (E) FD Intermittent. For low turnover (LT) conditions, the death rate was half of the default, at 0.005/h for all cell types, while for high turnover (HT) conditions, the death rate was twice the default at 0.02/h for all cell types. Division rates were set for each cell type to keep the fitness differences (net growth rates) the same as the default conditions. The dose modulation protocols worked well regardless of the amount of turnover. High cell turnover led to statistically significantly improved TTP in ST, DM Cocktail Tandem, and though the effect size was small, in both FD protocols.
Figure 7
Figure 7
Effect of replacement on outcome of adaptive therapy with 2 drugs. The panels show the comparison of adaptive therapy (AT) versus standard treatment (ST) as the replacement parameter is varied for (A) DM Cocktail Tandem, (B) DM Ping-Pong Alternate Every Cycle, (C) DM Ping-Pong on Progression, (D) FD Dose-Skipping/Drug-Holiday, (E) FD Intermittent. The replacement parameter determined the probability that a dividing cell with no empty neighbors could replace a neighbor. We tested the two extremes in which a cell can always replace a neighbor (Rep 100%), representing direct cell competition, cancer cell cannibalism, or cell death due to crowding. We represented complete contact inhibition when a cell can never replace a neighbor (Rep 0%). We also tested an intermediate value (our default) in which a dividing cell can replace its neighbor 50% of the time (Rep 50%), representing some cell death due to crowding and other forms of competition, but also some degree of contact inhibition.
Figure 8
Figure 8
Delta Tumor is an important parameter determining outcome of dose modulation (DM) adaptive therapy. The panels show the comparison of adaptive therapy (AT) versus standard treatment (ST) as the Delta Tumor parameter is varied for (A) DM Cocktail Tandem, (B) DM Ping-Pong Alternate Every Cycle, (C) DM Ping-Pong on Progression. For the dose modulation (DM) protocols, Delta Tumor is the tumor measurement parameter specifying a relative value by which the tumor burden must change, compared with the last time it was measured, in order to trigger a change in drug dosage.
Figure 9
Figure 9
Role of the Delta Dose parameter for dose modulation (DM) adaptive therapy protocols. The panels show the comparison of adaptive therapy (AT) versus standard treatment (ST) as the Delta Dose parameter is varied for (A) DM Cocktail Tandem, (B) DM Ping-Pong Alternate Every Cycle, (C) DM Ping-Pong on Progression. Delta Dose is the percentage by which the drug dose is changed (increased or decreased) relative to the last time the same drug was administered. Default value is 50% for both drugs.
Figure 10
Figure 10
The effect of stopping treatment when the tumor burden falls below some threshold. The panels show the comparison of adaptive therapy (AT) versus standard treatment (ST) as the treatment vacation parameter is varied for (A) DM Cocktail Tandem, (B) DM Ping-Pong Alternate Every Cycle, (C) DM Ping-Pong on Progression. In the DM protocols, doses are adjusted as the tumor burden changes. However, a treatment vacation is triggered when the tumor burden falls below a certain threshold, resulting in no drug being administered for the treatment cycle, and treatment is resumed if the tumor regrows above that threshold. In the clinic this is often performed when the tumor is no longer detectable. Default value of the treatment vacation parameter for the DM protocols was 50% of the value at which therapy was initiated (TreatVacAt50%OfStart), that is, 25% of the carrying capacity. No statistically significant improvement in TTP was observed between 50% and 80% but 10% vs. 50% was statistically significant for all DM protocols, suggesting that we should stop dosing altogether as soon as is feasible, and not wait for the tumor to disappear.

Similar articles

Cited by

References

    1. Gatenby R.A. A Change of Strategy in the War on Cancer. Nature. 2009;459:508–509. doi: 10.1038/459508a. - DOI - PubMed
    1. Chabner B.A., Roberts T.G. Chemotherapy and the War on Cancer. Nat. Rev. Cancer. 2005;5:65–72. doi: 10.1038/nrc1529. - DOI - PubMed
    1. Williams M.J., Werner B., Barnes C.P., Graham T.A., Sottoriva A. Identification of Neutral Tumor Evolution across Cancer Types. Nat. Genet. 2016;48:238–244. doi: 10.1038/ng.3489. - DOI - PMC - PubMed
    1. Ross E.M., Markowetz F. OncoNEM: Inferring Tumor Evolution from Single-Cell Sequencing Data. Genome Biol. 2016;17:69. doi: 10.1186/s13059-016-0929-9. - DOI - PMC - PubMed
    1. Ricketts C.J., Marston Linehan W. Intratumoral Heterogeneity in Kidney Cancer. Nat. Genet. 2014;46:214–215. doi: 10.1038/ng.2904. - DOI - PMC - PubMed

LinkOut - more resources