. 2022 May 31;14(11):2722.
doi: 10.3390/cancers14112722.

Exercise and Prebiotic Fiber Provide Gut Microbiota-Driven Benefit in a Survivor to Germ-Free Mouse Translational Model of Breast Cancer

Affiliations

Exercise and Prebiotic Fiber Provide Gut Microbiota-Driven Benefit in a Survivor to Germ-Free Mouse Translational Model of Breast Cancer

Kara Sampsell et al. Cancers (Basel). .

Abstract

The gut microbiota plays a role in shaping overall host health and response to several cancer treatments. Factors, such as diet, exercise, and chemotherapy, can alter the gut microbiota. In the present study, the Alberta Cancer Exercise (ACE) program was investigated as a strategy to favorably modify the gut microbiota of breast cancer survivors who had received chemotherapy. Subsequently, the ability of post-exercise gut microbiota, alone or with prebiotic fiber supplementation, to influence breast cancer outcomes was interrogated using fecal microbiota transplant (FMT) in germ-free mice. While cancer survivors experienced little gut microbial change following ACE, in the mice, tumor volume trended consistently lower over time in mice colonized with post-exercise compared to pre-exercise microbiota with significant differences on days 16 and 22. Beta diversity analysis revealed that EO771 breast tumor cell injection and Paclitaxel chemotherapy altered the gut microbial communities in mice. Enrichment of potentially protective microbes was found in post-exercise microbiota groups. Tumors of mice colonized with post-exercise microbiota exhibited more favorable cytokine profiles, including decreased vascular endothelial growth factor (VEGF) levels. Beneficial microbial and molecular outcomes were augmented with prebiotic supplementation. Exercise and prebiotic fiber demonstrated adjuvant action, potentially via an enhanced anti-tumor immune response modulated by advantageous gut microbial shifts.

Keywords: breast cancer; chemotherapy; exercise; fecal microbiota transplant; gut microbiota; prebiotics.


Conflict of interest statement

The authors declare no conflict of interest. The funders had no role in the design of the study; in the collection, analyses, or interpretation of data; in the writing of the manuscript, or in the decision to publish the results.

Figures

Figure 1
Figure 1
Clinical Study Outline. ACE, Alberta Cancer Exercise.
Figure 2
Figure 2
Murine Study Schematic.
Figure 3
Figure 3
Gut microbiota alpha diversity indices in Alberta Cancer Exercise (ACE) participants. Measures of alpha diversity pre (baseline) and post (12 weeks) ACE program. (A1C1) show pooled samples while (A2C2) visualize pre and post samples for each participant individually. Metrics include Pielou’s Evenness (A1,A2), Observed Species (B1,B2), and Shannon (C1,C2). No statistical significance was found using Kruskal-Wallis pairwise tests.
Figure 4
Figure 4
Gut microbiota beta diversity analyses for Alberta Cancer Exercise (ACE) participants. Beta diversity was measured by Weighted UniFrac Distance Matrix-based PCoA for pre- (baseline) and post- (12 weeks) exercise in the ACE program and analyzed with ANOSIM. Age (over or under 65) and time point did not significantly influence community diversity (A). Body mass index (BMI) category significantly influenced community diversity (p = 0.008) (B).
Figure 5
Figure 5
Gut microbiota differential abundance analyses from 16S rRNA sequencing. Relative abundance of three health-associated and three inflammation-associated microbiota were analyzed using DESeq2, showing no significant differences (A). Eight microbiota were significantly differentially abundant between pre- (baseline) and post- ACE (12 weeks) samples when analyzed with DESeq2 (p < 0.01) (B).
Figure 6
Figure 6
Fecal microbiota transplant (FMT) donor selection informed by relative abundance and alpha diversity. Relative abundance of three health-associated and three inflammation-associated genera were analyzed. Participant four exhibited an increase in Faecalibacterium from baseline to 12 weeks (ns) (A). Alpha diversity as measured by Shannon (B) and Evenness (C) indices increased from baseline to 12 weeks in participant four (ns).
Figure 7
Figure 7
Tumor volume over time. Average tumor volume at each measurement time point is plotted for each group. BCW0 (n = 10), BCW12 (n = 12), BCW12OFS (n = 12). Average volume differed significantly between groups on day 16 and day 22. Values without a common superscript are significantly different (p < 0.05; i.e., ‘a’ is different from ‘b’ but ‘ab’ is not different from ‘a’ or ‘b’). Data are presented as mean ± SEM.
Figure 8
Figure 8
Mouse gut microbial alpha diversity across time points. Alpha diversity metrics measured at T1 (day 5—post-FMT), T2 (day 13—post tumor cell injection), T3 (day 22—post paclitaxel), and T4 (day 27/28—euthanasia) and compared between groups using Kruskal-Wallis pairwise tests (A-C). Observed Species did not differ significantly between groups (A). Evenness differed significantly between groups at each timepoint (B). Shannon diversity differed significantly between groups at T2 (day 13) (C). * Indicates a significant difference (p < 0.05). Data are presented as ± SEM and each dot represents an individual mouse’s results. BCW0 (n = 10), BCW12 (n = 12), BCW12OFS (n = 12).
Figure 9
Figure 9
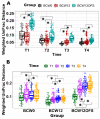
Mouse gut microbial beta diversity across time points. Beta diversity as measured by Weighted UniFrac Distance at T1 (day 5—post-FMT), T2 (day 13—post tumor cell injection), T3 (day 22—post paclitaxel), and T4 (day 27/28—euthanasia) and analyzed using ANOSIM to detect significant between-group community differences at each time are presented (A). Weighted UniFrac Distance analyzed with ANOSIM to detect community differences over time within each group are also presented (B). * indicates a significant difference (p < 0.05). Data are presented as ± SEM.
Figure 10
Figure 10
Mouse gut microbiota differential abundance analyses. Taxa found to be differentially abundant between groups are represented by log2FoldChange from DESeq2 analysis. The group serving as the base for comparison comes after “vs.” (i.e., BCW12OFS vs. BCW0 is showing values for the bacteria in BCW12OFS compared to BCW0). Positive log2FoldChange indicates greater relative abundance, while a negative value indicates lesser relative abundance. Significantly differential abundance for each comparison at day 13 are presented (A). Significantly differential abundance for each comparison at day 22 are also presented (B). Only differences with p < 0.001 from DESeq2 analysis are represented. BCW0 (n = 10), BCW12 (n = 12), BCW12OFS (n = 12).
Figure 11
Figure 11
Levels of key tumor cytokines. Tumor cytokine levels as measured by multiplex assay which differed significantly between groups are presented (AF). These include levels of MCP-1 (A), IL-9 (B), TNFα (C), VEGF (D), IP-10 (E), and RANTES (F). * Indicates a significant difference of p < 0.05 and ** indicates a significant difference of p < 0.01. Data are presented as ± SEM and each point represents an individual mouse’s results. BCW0 (n = 10), BCW12 (n = 12), BCW12OFS (n = 12) for tumor cytokines and BCW0 (n = 9), BCW12 (n = 11), BCW12OFS (n = 12) for serum. ns: not significant.

Similar articles

Cited by

References

    1. Noce A., Marrone G., Daniele F.D., Ottaviani E., Jones G.W., Bernini R., Romani A., Rovella V. Impact of Gut Microbiota Composition on Onset and Progression of Chronic Non-Communicable Diseases. Nutrients. 2019;11:1073. doi: 10.3390/nu11051073. - DOI - PMC - PubMed
    1. Vivarelli S., Salemi R., Candido S., Falzone L., Santagati M., Stefani S., Torino F., Banna G.L., Tonini G., Libra M. Gut microbiota and cancer: From pathogenesis to therapy. Cancers. 2019;11:38. doi: 10.3390/cancers11010038. - DOI - PMC - PubMed
    1. Scott A.J., Alexander J.L., Merrifield C.A., Cunningham D., Jobin C., Brown R., Alverdy J., Keefe S.J.O., Gaskins H.R., Teare J., et al. International Cancer Microbiome Consortium consensus statement on the role of the human microbiome in carcinogenesis. Gut. 2019;68:1624–1632. doi: 10.1136/gutjnl-2019-318556. - DOI - PMC - PubMed
    1. Mager L.F., Burkhard R., Pett N., Cooke N.C.A., Brown K., Ramay H., Paik S., Stagg J., Groves R.A., Gallo M., et al. Microbiome-derived inosine modulates response to checkpoint inhibitor immunotherapy. Science. 2020;369:1481–1489. doi: 10.1126/science.abc3421. - DOI - PubMed
    1. Frosali S., Pagliari D., Gambassi G., Landolfi R., Pandolfi F., Cianci R. How the Intricate Interaction among Toll-Like Receptors, Microbiota, and Intestinal Immunity Can Influence Gastrointestinal Pathology. J. Immunol. Res. 2015;2015:489821. doi: 10.1155/2015/489821. - DOI - PMC - PubMed

LinkOut - more resources