. 2022 May 31;14(11):2738.
doi: 10.3390/cancers14112738.

Inhibitors of the Actin-Bundling Protein Fascin-1 Developed for Tumor Therapy Attenuate the T-Cell Stimulatory Properties of Dendritic Cells

Affiliations

Inhibitors of the Actin-Bundling Protein Fascin-1 Developed for Tumor Therapy Attenuate the T-Cell Stimulatory Properties of Dendritic Cells

Yanira Zeyn et al. Cancers (Basel). .

Abstract

Background: Stimulated dendritic cells (DCs), which constitute the most potent population of antigen-presenting cells (APCs), express the actin-bundling protein Fascin-1 (Fscn1). In tumor cells, de novo expression of Fscn1 correlates with their invasive and metastatic properties. Therefore, Fscn1 inhibitors have been developed to serve as antitumor agents. In this study, we were interested in better understanding the impact of Fscn1 inhibitors on DCs.

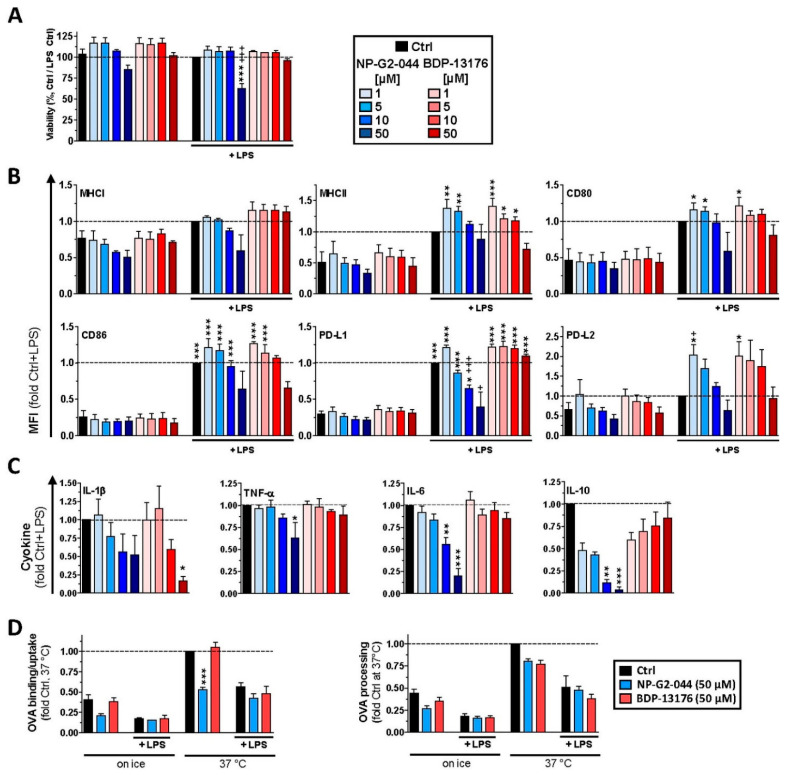
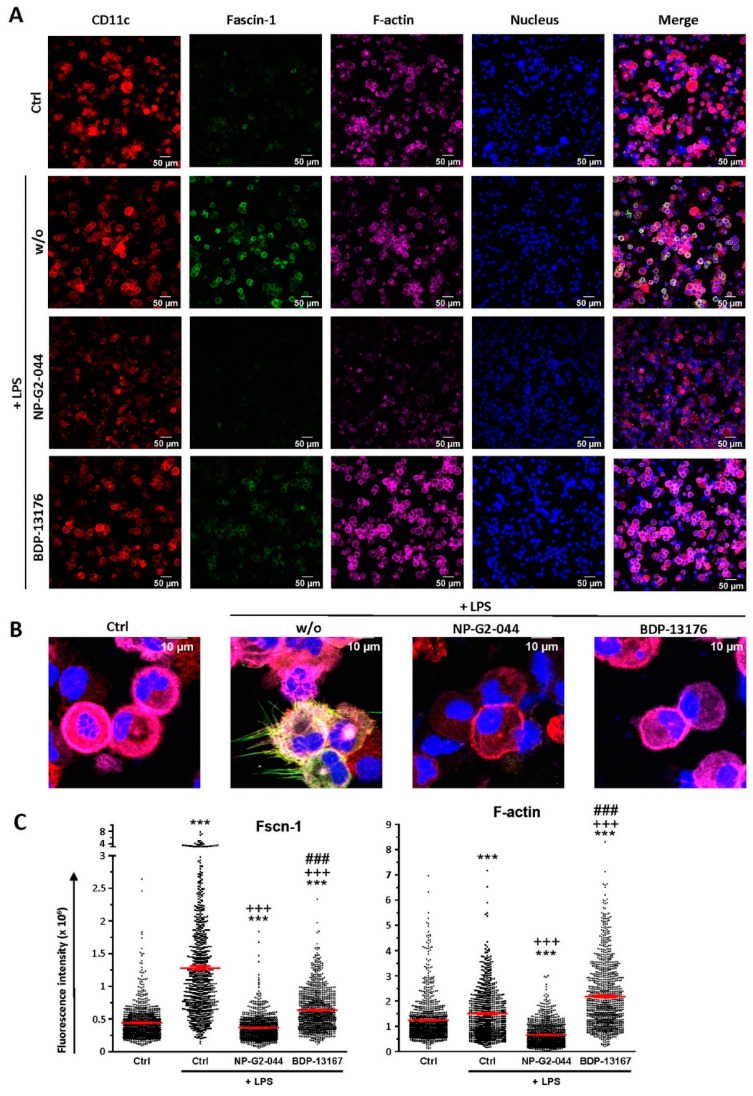
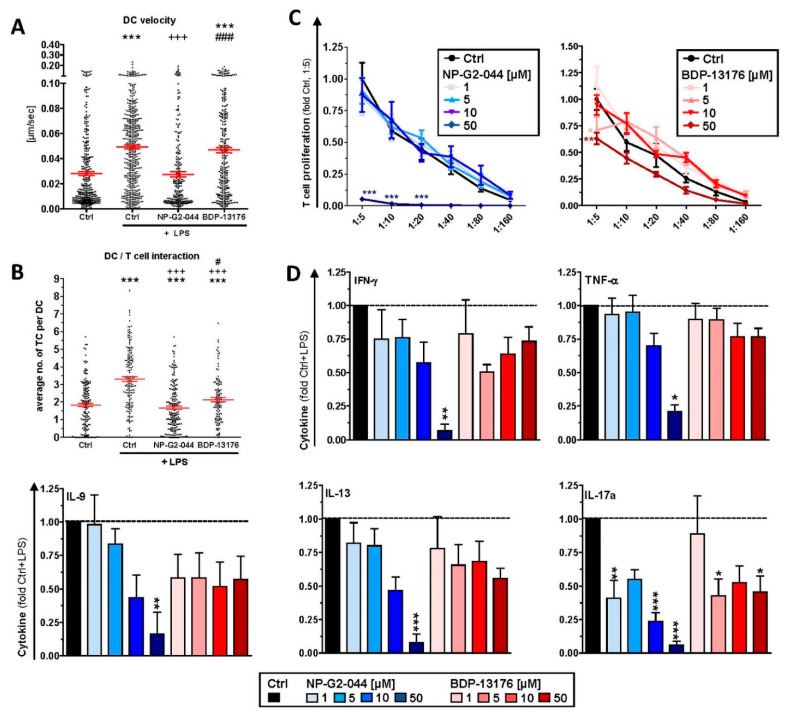
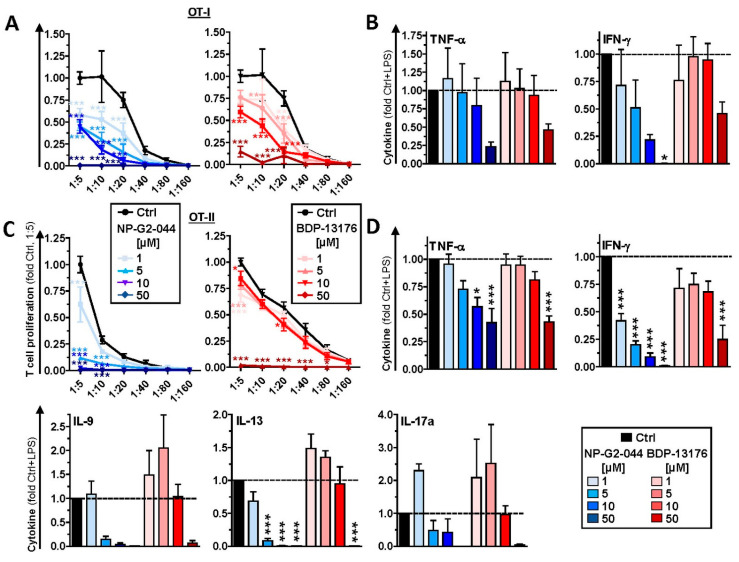
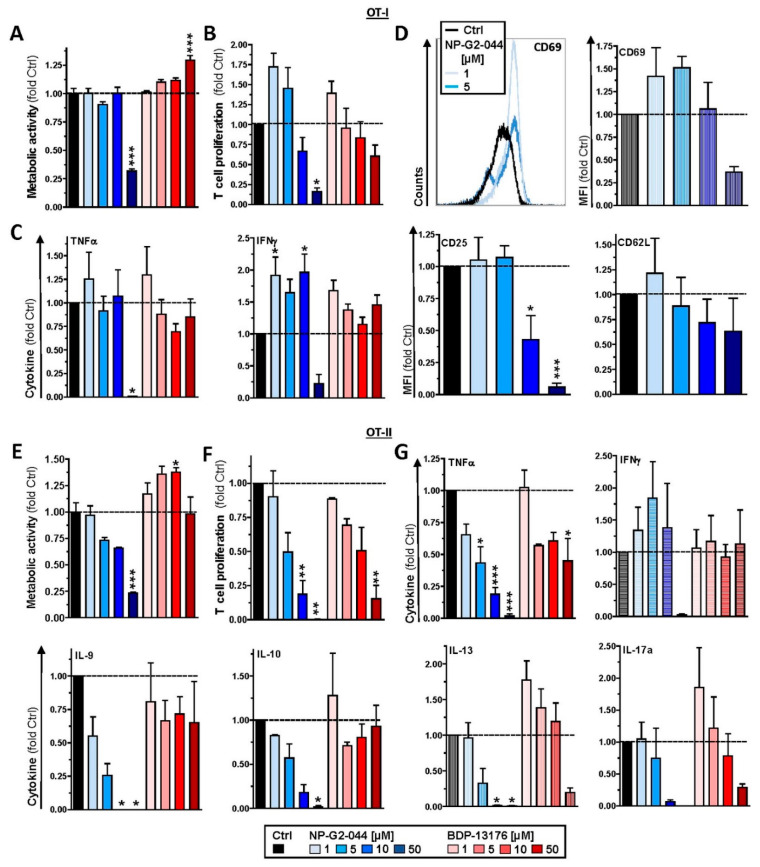
Methods: In parallel settings, murine spleen cells and bone-marrow-derived DCs (BMDCs) were stimulated with lipopolysaccharide in the presence of Fscn1 inhibitors (NP-G2-044 and BDP-13176). An analysis of surface expression of costimulatory and coinhibitory receptors, as well as cytokine production, was performed by flow cytometry. Cytoskeletal alterations were assessed by confocal microscopy. The effects on the interactions of BMDCs with antigen-specific T cells were monitored by time lapse microscopy. The T-cell stimulatory and polarizing capacity of BMDCs were measured in proliferation assays and cytokine studies.

Results: Administration of Fscn1 inhibitors diminished Fscn1 expression and the formation of dendritic processes by stimulated BMDCs and elevated CD273 (PD-L2) expression. Fscn1 inhibition attenuated the interaction of DCs with antigen-specific T cells and concomitant T-cell proliferation.

Conclusions: Systemic administration of Fscn1 inhibitors for tumor therapy may also modulate DC-induced antitumor immune responses.

Keywords: BDP-13176; CD273; CD86; Fascin-1; NP-G2-044; dendritic cells.


Conflict of interest statement

The authors declare no conflict of interest. The funders had no role in the design of the study; in the collection, analyses, or interpretation of data; in the writing of the manuscript, or in the decision to publish the results.

Figures

Figure 2
Figure 2
Fscn1 inhibitors interfere with stimulation-induced acquisition of an immune-stimulatory phenotype of bone-marrow-derived DCs (BMDCs). (AC) BMDCs were incubated overnight with Fscn1 inhibitors as described (see Figure 1) and stimulated with LPS (100 ng/mL). (A,B) The next day, samples were subjected to flow cytometric analysis as described in [36]. Graphs denote the percentage of FVD-negative cells (A) or MFI (B) (mean ± SEM of three to four experiments) of marker expression relative to expression by the stimulated control (Ctrl + LPS). (C) Cytokine concentrations of BMDC culture supernatants were determined by CBA (mean ± SEM of 3–8 experiments). (D) Unstimulated BMDCs were incubated with Fscn1 inhibitors (each 5 × 10⁻⁵ M) as indicated, kept at a constant temperature as indicated, and OVA derivatives (OVA-AF647, OVA-DQ; each 25 µg/mL) were applied for the last 30 min of incubation. OVA uptake (left panel) and processing (right panel) were assessed by flow cytometry. Data denote the MFI (mean ± SEM of three experiments) and are presented relative to Ctrl. (AD) Statistical differences are indicated: (A,B) vs. * Ctrl and + Ctrl + LPS, (C) vs. * Ctrl + LPS and (D) vs. * Ctrl (37 °C) (one-way ANOVA, Tukey test). *,+ p < 0.05, ** p < 0.01, ***,+++ p < 0.001.
Figure 1
Figure 1
Fscn1 inhibitor NP-G2-044 impairs the activation state of splenic DC populations. Spleen cells were incubated with Fscn1 inhibitors (NP-G2-044 and BDP-13176) at different concentrations as indicated or DMSO as solvent control (Ctrl). In parallel settings, spleen cells were stimulated (LPS: 100 ng/mL, imiquimod: 1 µg/mL) 45 min after the corresponding Fscn1 inhibitor. The next day, expression of MHCII, CD80 and CD86 by different DC populations (cDC1, cDC2 and pDC) was assessed by flow cytometric analysis. The gating employed strategy is depicted in Figure S2. Graphs denote the fluorescence intensities (MFI) (mean ± SEM of four experiments) of marker expression. Statistical differences vs. * Ctrl and + Ctrl+LPS are indicated (one-way ANOVA, Tukey test). *,+ p < 0.05, **,++ p < 0.01, ***,+++ p < 0.001.
Figure 3
Figure 3
Fscn1 inhibitors diminish Fscn1 expression in stimulated DCs. DC were incubated with Fscn1 inhibitors (NP-G2-044, BDP-13176; each 5 × 10⁵ M), followed by treatment with LPS (100 ng/mL) as indicated. Cytospins of differentially treated DCs were incubated with Hoechst dye for nuclear staining, fluorescence-labeled phalloidin for F-actin detection and specific antibodies for CD11c and Fscn1. An overview (A) and single cells (B) are shown. Images are representative of four independent experiments. (C) Quantification of Fscn1 (left panel) and F-actin (right panel) contents in differentially treated DCs. Data denote the corresponding fluorescence intensities per cell and the mean ± SEM of 789–1077 cells per group compiled from four independent experiments. (C) Statistical differences versus * Ctrl, versus + Ctrl + LPS and versus # NP-G2-044 + LPS are indicated (one-way ANOVA, Tukey test). ***,+++,### p < 0.001.
Figure 4
Figure 4
DCs pretreated with Fscn1 inhibitors display attenuated motility and T-cell interaction. DCs were incubated with OVA protein. After 3 h, Fscn1 inhibitors (NP-G2-044 and BDP-13176) and DMSO (Ctrl) were added as indicated. In parallel settings, LPS (100 ng/mL) was applied 45 min later as indicated. (A,B) The next day, DC (CellTrace Violet) and OVA-responsive CD4+ T cells (CFSE) were labeled with fluorescent living cell markers and cocultured (3 × 10⁴ DC/1.5 × 105 T cells). (A) Motility of DC was tracked over an observation period of 8 h. The graph shows the velocity of single DCs and denotes the according mean ± SEM of 247–561 cells per group compiled from four experiments. (B) Quantification of DC/T-cell interactions. The graph displays the average number of DC-contacting T cells expressed as mean ± SEM of 125–260 cells per group compiled from four independent experiments. (C,D) The next day, serially titrated numbers of harvested and washed DCs (starting with 104/100 µL) were cocultured with immune magnetically sorted OVA peptide-specific CD4+ (OT-II) T cells (5 × 10⁴/100 µL) in triplicate in 96-well plates. Proliferation of (C) CD4+ T cells was assessed by incorporation of 3H-thymidin applied for the last 16 h of 3–4 days of coculture. Data denote the mean ± SEM of three to five compiled experiments performed in triplicate relative to the corresponding Ctrl condition (1:5). (D) Prior to application of 3H-thymidine aliquots, DC/T-cell coculture supernatants (1:5) were retrieved, and cytokine contents in CD4+-containing cocultures were assayed by CBA. Data denote the mean + SEM of five experiments, with values normalized to Ctrl + LPS in each experiment. (AD) Statistical differences versus * Ctrl, (A,B) vs. + Ctrl + LPS and vs. # NP-G2-044+LPS are indicated (one way ANOVA, Tukey test). * p < 0.05, ** p < 0.01, ***,+++,### p < 0.001.
Figure 5
Figure 5
Results of application of Fscn1 inhibitors during DC/T-cell coculture in impaired T-cell proliferation. DCs were incubated with OVA protein (5 µg/mL). In parallel settings, LPS (100 ng/mL) was applied 45 min later. The next day, samples were harvested and washed, and serially titrated numbers of DCs were cocultured with OVA peptide-specific CD8+ (OT-I) (A,B) and CD4+ (OT-II) (C,D) T cells as described (see Figure 4). Fscn1 inhibitors were applied to DC/T-cell cocultures as indicated. Proliferation of (A) CD8+ and (C) CD4+ T cells was assessed. Data denote the mean ± SEM of two compiled experiments performed in triplicate relative to the corresponding Ctrl condition (1:5). Cytokine contents in (B) CD8+- and (D) CD4+-containing cocultures were assayed by CBA. Data denote the mean ± SEM of three experiments relative to Ctrl + LPS. (AD) Statistical differences versus * Ctrl are indicated (one-way ANOVA, Tukey test). * p < 0.05, ** p < 0.01, *** p < 0.001.
Figure 6
Figure 6
Fscn1 inhibitors promote CD8+ T-cell activation but attenuate CD4+ T-cell activation. Immunomagnetically sorted (AD) CD8+ and (EG) CD4+ T cells (each 5 × 10⁴/100 µL) were polyclonally stimulated using agonistic anti-CD3 (1 µg/mL) plus anti-CD28 (2 µg/mL) antibodies in the presence of Fscn1 inhibitors and DMSO (Ctrl) as indicated (AG). (A,E) After 3–4 days of culture, metabolic activity was detected by application of MTT assay reagent. (B,F) T-cell proliferation and (C,G) cytokine concentrations were assayed as described (see Figure 4). (D) Left panel: expression of CD25, CD62L and CD69 was assessed by flow cytometric analysis. The graph is representative of six experiments. Right panel: quantification of T-cell proliferation. (AG) Data denote the mean ± SEM of three to six compiled experiments relative to Ctrl. Statistical differences versus * Ctrl are indicated (one-way ANOVA, Tukey test). * p < 0.05, ** p < 0.01, *** p < 0.001.

Similar articles

Cited by

References

    1. Bros M., Ross X.L., Pautz A., Reske-Kunz A.B., Ross R. The human fascin gene promoter is highly active in mature dendritic cells due to a stage-specific enhancer. J. Immunol. 2003;171:1825–1834. doi: 10.4049/jimmunol.171.4.1825. - DOI - PubMed
    1. Mohr C.F., Gross C., Bros M., Reske-Kunz A.B., Biesinger B., Thoma-Kress A.K. Regulation of the tumor marker Fascin by the viral oncoprotein Tax of human T-cell leukemia virus type 1 (HTLV-1) depends on promoter activation and on a promoter-independent mechanism. Virology. 2015;485:481–491. doi: 10.1016/j.virol.2015.08.025. - DOI - PubMed
    1. Hashimoto Y., Kim D.J., Adams J.C. The roles of fascins in health and disease. J. Pathol. 2011;224:289–300. doi: 10.1002/path.2894. - DOI - PubMed
    1. Nagel J., Delandre C., Zhang Y., Förstner F., Moore A.W., Tavosanis G. Fascin controls neuronal class-specific dendrite arbor morphology. Development. 2012;139:2999–3009. doi: 10.1242/dev.077800. - DOI - PubMed
    1. Mosialos G., Yamashiro S., Baughman R.W., Matsudaira P., Vara L., Matsumura F., Kieff E., Birkenbach M. Epstein-Barr virus infection induces expression in B lymphocytes of a novel gene encoding an evolutionarily conserved 55-kilodalton actin-bundling protein. J. Virol. 1994;68:7320–7328. doi: 10.1128/jvi.68.11.7320-7328.1994. - DOI - PMC - PubMed