

Prediction of Adrenocortical Carcinoma Relapse and Prognosis with a Set of Novel Multigene Panels
- PMID: 35681785
- PMCID: PMC9179637
- DOI: 10.3390/cancers14112805
Prediction of Adrenocortical Carcinoma Relapse and Prognosis with a Set of Novel Multigene Panels
Abstract
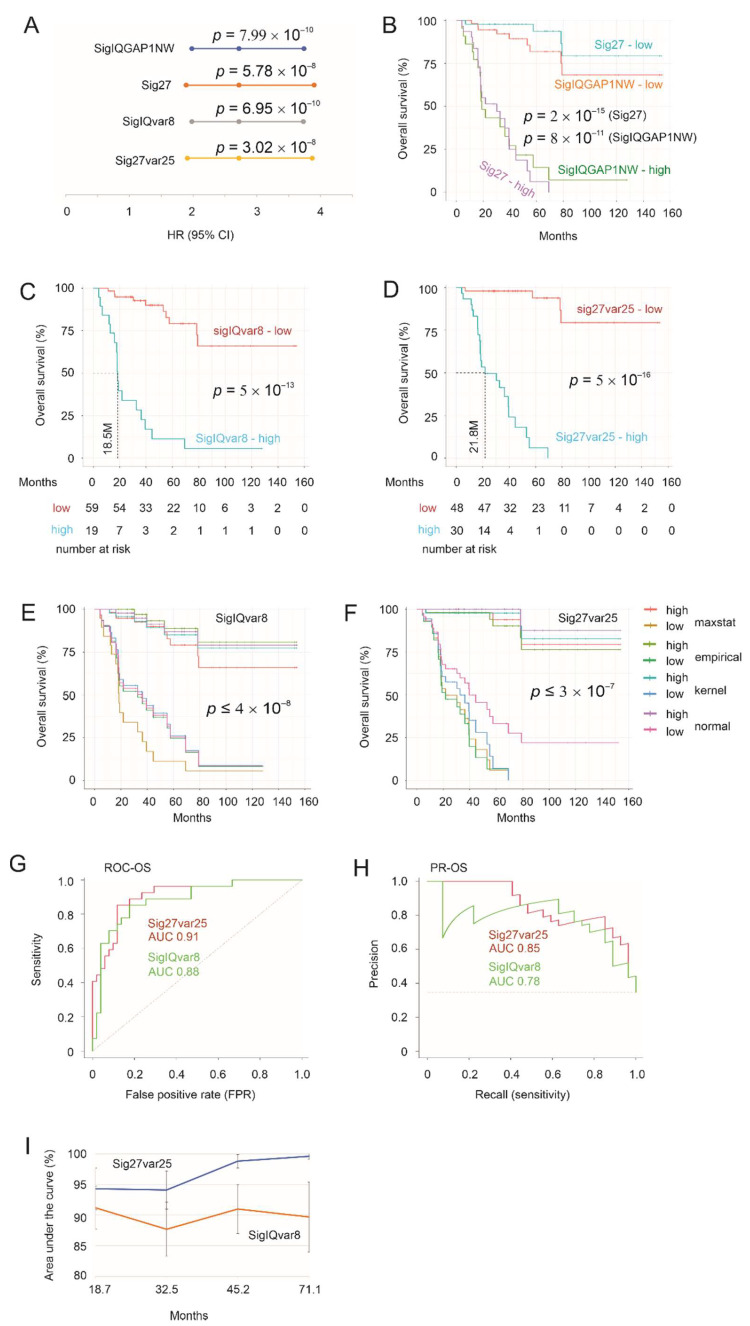
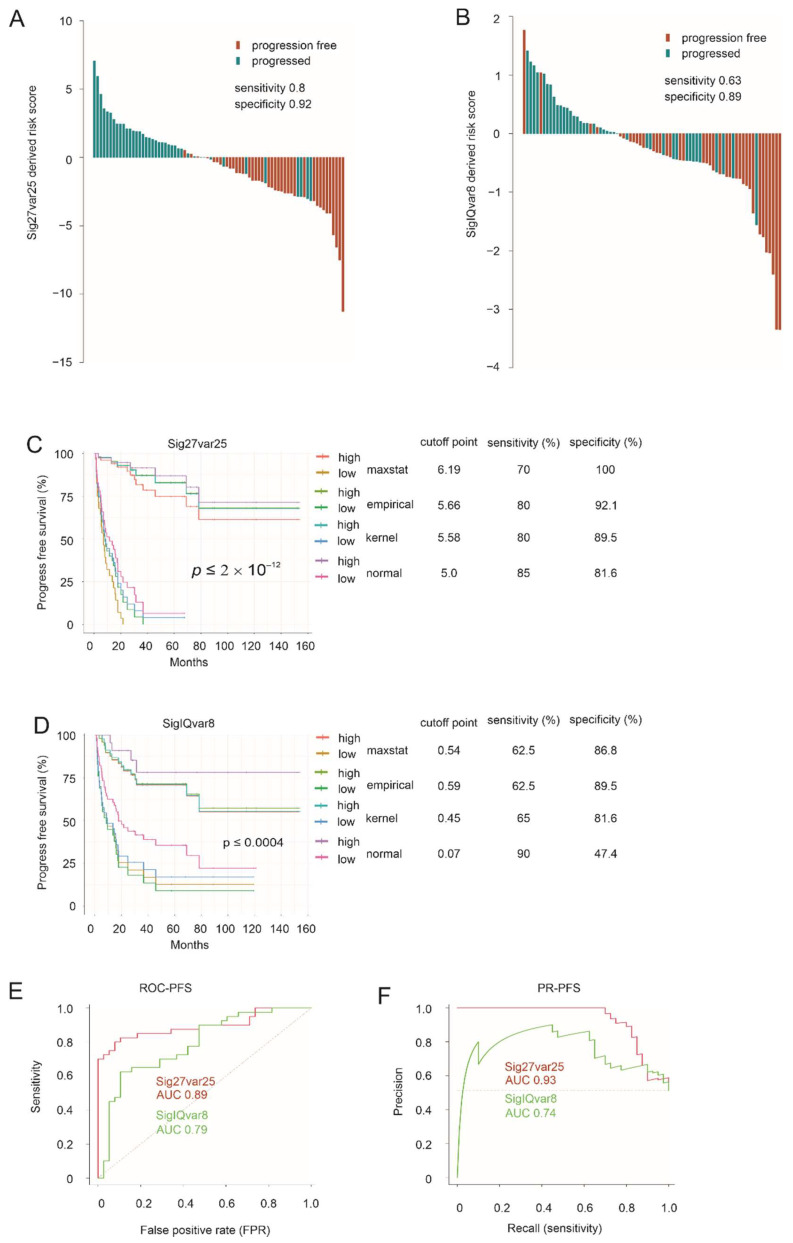
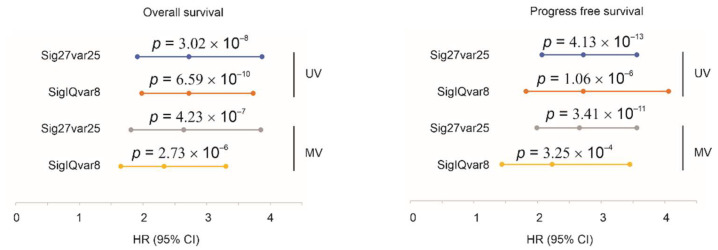
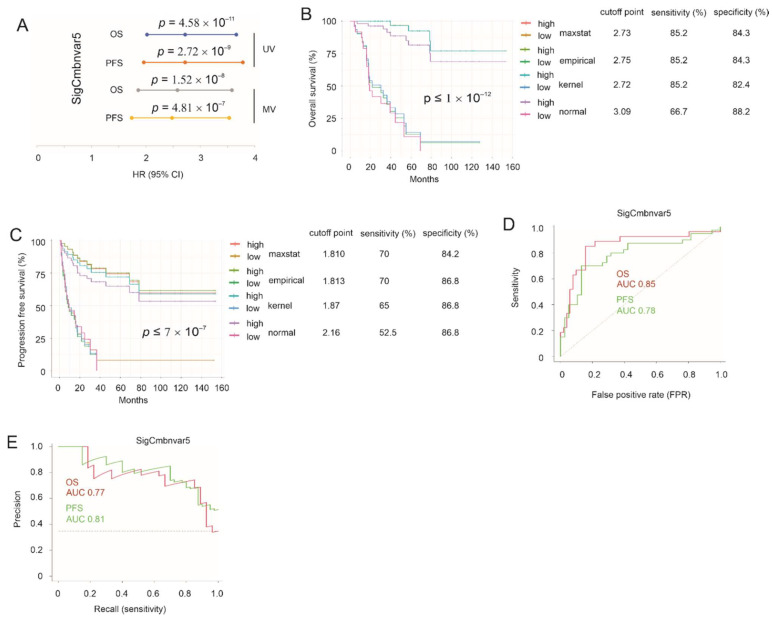
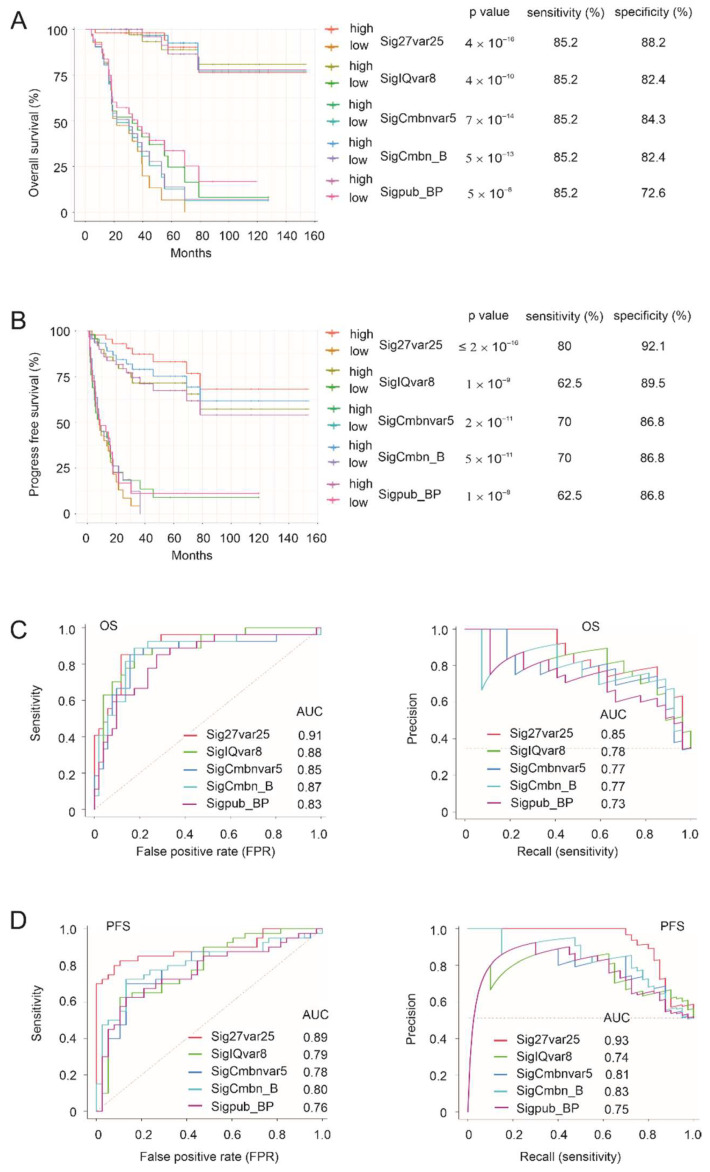
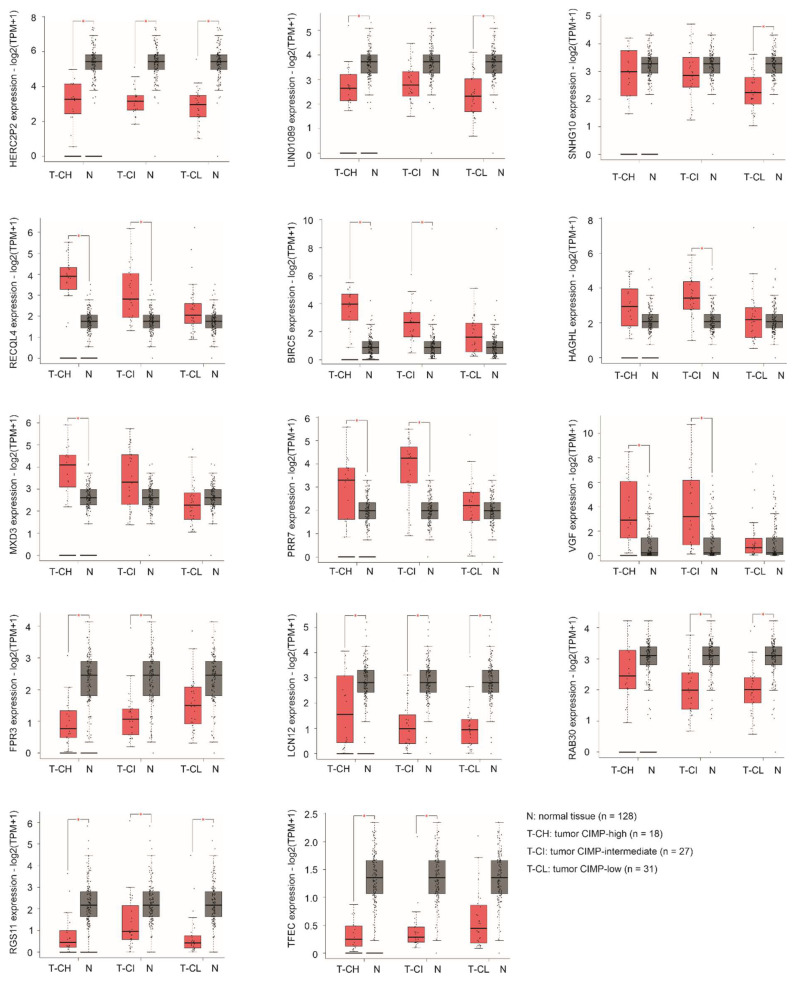
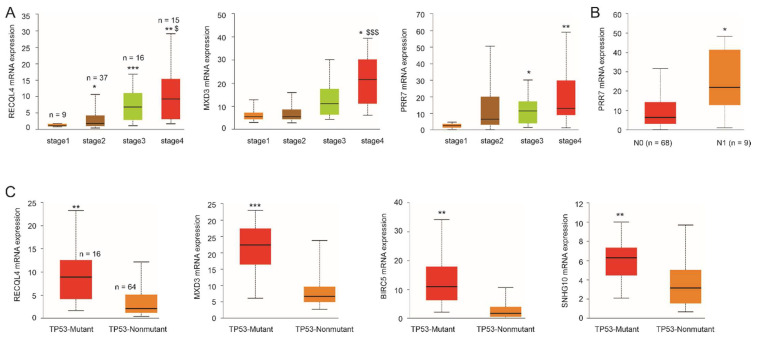
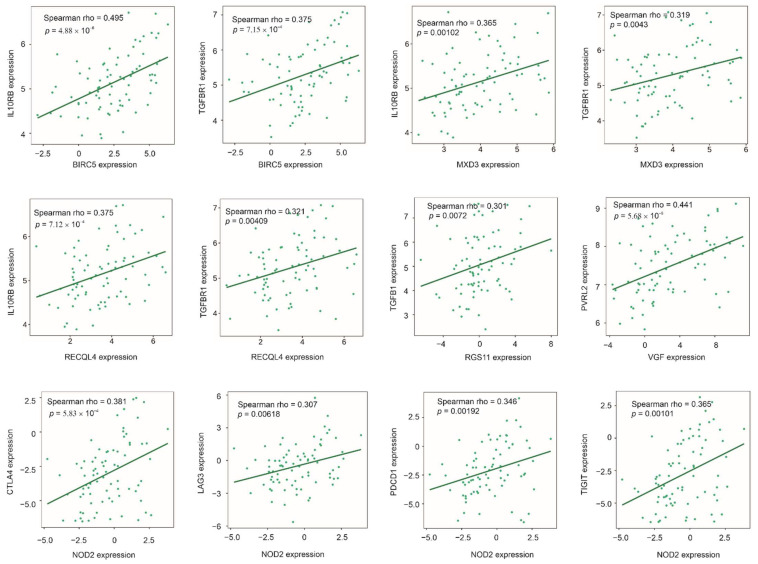
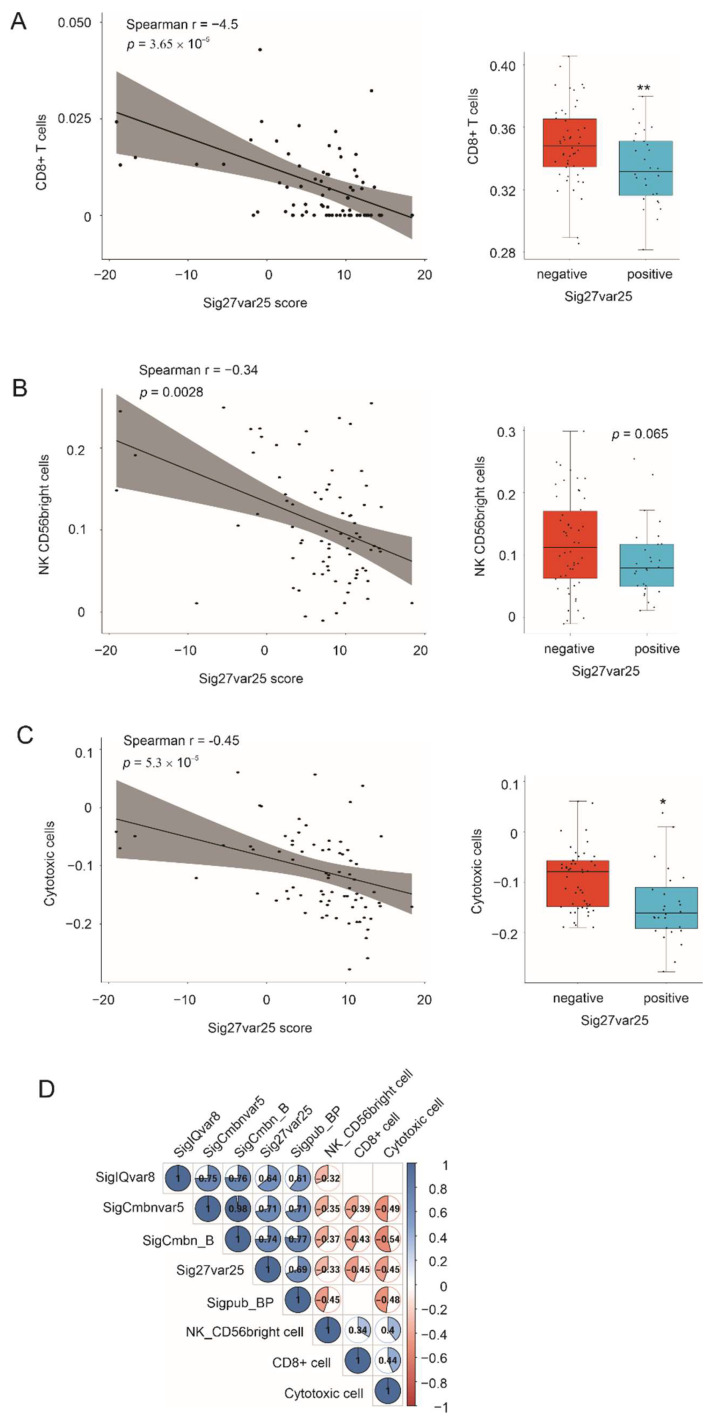
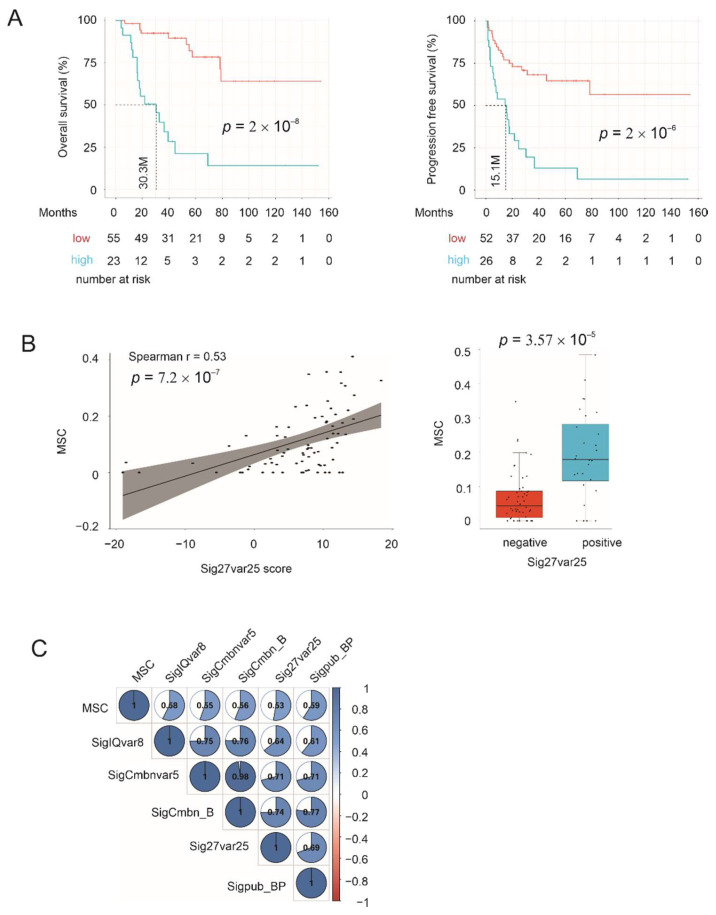
Effective assessment of adrenocortical carcinoma (ACC) prognosis is critical in patient management. We report four novel and robust prognostic multigene panels. Sig27var25, SigIQvar8, SigCmbnvar5, and SigCmbn_B predict ACC relapse at area under the curve (AUC) of 0.89, 0.79, 0.78, and 0.80, respectively, and fatality at AUC of 0.91, 0.88, 0.85, and 0.87, respectively. Among their 33 component genes, 31 are novel. They could be differentially expressed in ACCs from normal tissues, tumors with different severity (stages and lymph node metastasis), ACCs with TP53 mutations, and tumors with differentially expressed immune checkpoints (CTLA4, PD1, TGFBR1, and others). All panels correlate with reductions of ACC-associated CD8+ and/or NK cells. Furthermore, we provide the first evidence for the association of mesenchymal stem cells (MSCs) with ACC relapse (p = 2 × 10⁻⁶) and prognosis (p = 2 × 10⁻⁸). Sig27var25, SigIQvar8, SigCmbnvar5, and SigCmbn_B correlate with MSC (spearman r ≥ 0.53, p ≤ 1.38 × 10⁻⁵). Sig27var25 and SigIQvar8 were derived from a prostate cancer (PC) and clear cell renal cell carcinoma (ccRCC) multigene signature, respectively; SigCmbnvar5 and SigCmbn_B are combinations of both panels, revealing close relationships of ACC with PC and ccRCC. The origin of these four panels from PC and ccRCC favors their prognostic potential towards ACC.
Keywords: adrenocortical carcinoma; disease-free survival; immune checkpoint proteins; mesenchymal stem cells; overall survival; prognostic biomarkers.
Conflict of interest statement
The authors declare no conflict of interest.
Figures
Similar articles
-
Identification and Verification of Immune-Related Genes Prognostic Signature Based on ssGSEA for Adrenocortical Carcinoma (ACC).Int J Gen Med. 2022 Feb 15;15:1471-1483. doi: 10.2147/IJGM.S345123. eCollection 2022. Int J Gen Med. 2022. PMID: 35210821 Free PMC article.
-
Expression of FSCN1 and FOXM1 are associated with poor prognosis of adrenocortical carcinoma patients.BMC Cancer. 2019 Nov 29;19(1):1165. doi: 10.1186/s12885-019-6389-3. BMC Cancer. 2019. PMID: 31783819 Free PMC article.
-
Integrated analysis on the N6-methyladenosine-related long noncoding RNAs prognostic signature, immune checkpoints, and immune cell infiltration in clear cell renal cell carcinoma.Immun Inflamm Dis. 2021 Dec;9(4):1596-1612. doi: 10.1002/iid3.513. Epub 2021 Aug 25. Immun Inflamm Dis. 2021. PMID: 34432955 Free PMC article.
-
Pan-Cancer Analysis of PARP1 Alterations as Biomarkers in the Prediction of Immunotherapeutic Effects and the Association of Its Expression Levels and Immunotherapy Signatures.Front Immunol. 2021 Aug 31;12:721030. doi: 10.3389/fimmu.2021.721030. eCollection 2021. Front Immunol. 2021. PMID: 34531868 Free PMC article.
-
Identification of an independent immune-genes prognostic index for renal cell carcinoma.BMC Cancer. 2021 Jun 29;21(1):746. doi: 10.1186/s12885-021-08367-6. BMC Cancer. 2021. PMID: 34187413 Free PMC article.
Cited by
-
Construction of a Genetic Prognostic Model in the Glioblastoma Tumor Microenvironment.Genes (Basel). 2025 Jul 24;16(8):861. doi: 10.3390/genes16080861. Genes (Basel). 2025. PMID: 40869909 Free PMC article.
-
Comprehensive analysis of a tryptophan metabolism-related model in the prognostic prediction and immune status for clear cell renal carcinoma.Eur J Med Res. 2024 Jan 5;29(1):22. doi: 10.1186/s40001-023-01619-0. Eur J Med Res. 2024. PMID: 38183155 Free PMC article.
-
PCSK9 facilitates melanoma pathogenesis via a network regulating tumor immunity.J Exp Clin Cancer Res. 2023 Jan 2;42(1):2. doi: 10.1186/s13046-022-02584-y. J Exp Clin Cancer Res. 2023. PMID: 36588164 Free PMC article.
-
Intratumoral microbiota is associated with prognosis in patients with adrenocortical carcinoma.Imeta. 2023 Apr 5;2(2):e102. doi: 10.1002/imt2.102. eCollection 2023 May. Imeta. 2023. PMID: 38868430 Free PMC article.
References
-
- Kerkhofs T.M., Verhoeven R.H., Van der Zwan J.M., Dieleman J., Kerstens M.N., Links T.P., Van de Poll-Franse L.V., Haak H.R. Adrenocortical carcinoma: A population-based study on incidence and survival in the netherlands since 1993. Eur. J. Cancer. 2013;49:2579–2586. doi: 10.1016/j.ejca.2013.02.034. - DOI - PubMed
LinkOut - more resources
Full Text Sources
Research Materials
Miscellaneous
