

Spatial Differences and Influential Factors of Urban Carbon Emissions in China under the Target of Carbon Neutrality
- PMID: 35682024
- PMCID: PMC9180286
- DOI: 10.3390/ijerph19116427
Spatial Differences and Influential Factors of Urban Carbon Emissions in China under the Target of Carbon Neutrality
Abstract
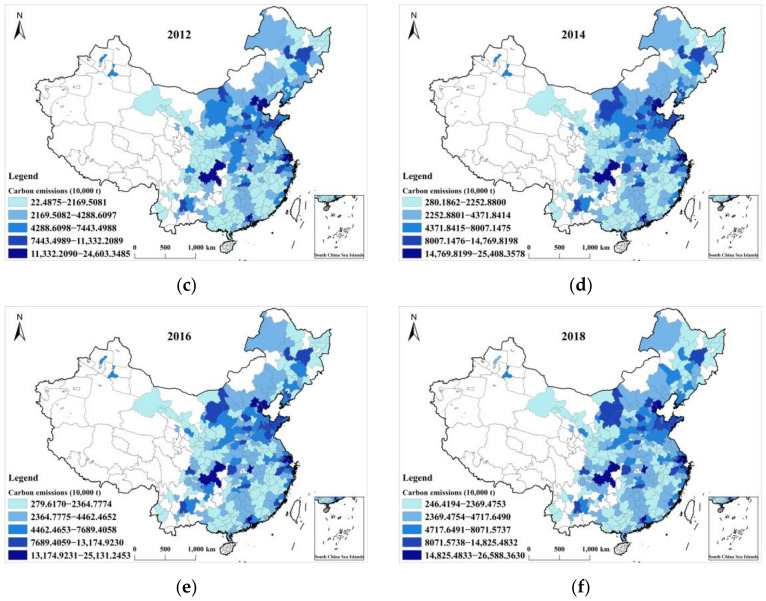
Cities are areas featuring a concentrated population and economy and are major sources of carbon emissions (CEs). The spatial differences and influential factors of urban carbon emissions (UCEs) need to be examined to reduce CEs and achieve the target of carbon neutrality. This paper selected 264 cities at the prefecture level in China from 2008 to 2018 as research objects. Their UCEs were calculated by the CE coefficient, and the spatial differences in them were analyzed using exploratory spatial data analysis (ESDA). The influential factors of UCEs were studied with Geodetector. The results are as follows: (1) The UCEs were increasing gradually. Cities with the highest CEs over the study period were located in the urban agglomerations of Beijing-Tianjin-Hebei, Yangtze River Delta, Pearl River Delta, middle reaches of the Yangtze River, and Chengdu-Chongqing. (2) The UCEs exhibited certain global and local spatial autocorrelations. (3) The industrial structure was the dominant factor influencing UCEs.
Keywords: Geodetector; carbon neutrality; exploratory spatial data analysis; influential factors; spatial differences; urban carbon emissions.
Conflict of interest statement
The authors declare no conflict of interest.
Figures


Similar articles
-
Analysis of the Spatiotemporal Evolution of the Net Carbon Sink Efficiency and Its Influencing Factors at the City Level in Three Major Urban Agglomerations in China.Int J Environ Res Public Health. 2023 Jan 9;20(2):1166. doi: 10.3390/ijerph20021166. Int J Environ Res Public Health. 2023. PMID: 36673923 Free PMC article.
-
[Spatialization and Spatio-temporal Dynamics of Energy Consumption Carbon Emissions in China].Huan Jing Ke Xue. 2022 Nov 8;43(11):5305-5314. doi: 10.13227/j.hjkx.202112066. Huan Jing Ke Xue. 2022. PMID: 36437102 Chinese.
-
Influential Nodes Identification in the Air Pollution Spatial Correlation Weighted Networks and Collaborative Governance: Taking China's Three Urban Agglomerations as Examples.Int J Environ Res Public Health. 2022 Apr 7;19(8):4461. doi: 10.3390/ijerph19084461. Int J Environ Res Public Health. 2022. PMID: 35457325 Free PMC article.
-
Regional differences, dynamic evolution, and spatial spillover effects of carbon emission intensity in urban agglomerations.Environ Sci Pollut Res Int. 2023 Dec;30(58):121993-122010. doi: 10.1007/s11356-023-30807-y. Epub 2023 Nov 14. Environ Sci Pollut Res Int. 2023. PMID: 37957497
-
Modeling place-based nature-based solutions to promote urban carbon neutrality.Ambio. 2023 Aug;52(8):1297-1313. doi: 10.1007/s13280-023-01872-x. Epub 2023 May 15. Ambio. 2023. PMID: 37184623 Free PMC article. Review.
Cited by
-
CO2 Emissions Inventory and Its Uncertainty Analysis of China's Industrial Parks: A Case Study of the Maanshan Economic and Technological Development Area.Int J Environ Res Public Health. 2022 Sep 16;19(18):11684. doi: 10.3390/ijerph191811684. Int J Environ Res Public Health. 2022. PMID: 36141953 Free PMC article.
-
Spatio-temporal dynamics of human-induced carbon emissions in Southeast Asia (1992-2022) based on nighttime light.Eco Environ Health. 2025 Apr 26;4(2):100150. doi: 10.1016/j.eehl.2025.100150. eCollection 2025 Jun. Eco Environ Health. 2025. PMID: 40469201 Free PMC article.
-
Decomposition of driving factors and peak prediction of carbon emissions in key cities in China.Carbon Balance Manag. 2025 Jul 3;20(1):20. doi: 10.1186/s13021-025-00310-7. Carbon Balance Manag. 2025. PMID: 40608212 Free PMC article.
-
Spatial-Temporal Characteristics of Multi-Hazard Resilience in Ecologically Fragile Areas of Southwest China: A Case Study in Aba.Int J Environ Res Public Health. 2022 Sep 22;19(19):12018. doi: 10.3390/ijerph191912018. Int J Environ Res Public Health. 2022. PMID: 36231320 Free PMC article.
-
Spatiotemporal Evolution of Carbon Emissions According to Major Function-Oriented Zones: A Case Study of Guangdong Province, China.Int J Environ Res Public Health. 2023 Jan 23;20(3):2075. doi: 10.3390/ijerph20032075. Int J Environ Res Public Health. 2023. PMID: 36767443 Free PMC article.
References
-
- Mohmmed A., Li Z., Arowolo A.O., Su H., Deng X., Najmuddin O., Zhang Y. Driving factors of CO2 emissions and nexus with economic growth, development and human health in the Top Ten emitting countries. Resour. Conserv. Recycl. 2019;148:157–169. doi: 10.1016/j.resconrec.2019.03.048. - DOI
-
- Marra A., Colantonio E. The path to renewable energy consumption in the European Union through drivers and barriers: A panel vector autoregressive approach. Socio Econ. Plan. Sci. 2020;76:100958. doi: 10.1016/j.seps.2020.100958. - DOI
-
- Zhang F., Jin G., Li J., Wang C., Xu N. Study on Dynamic Total Factor Carbon Emission Efficiency in China’s Urban Agglomerations. Sustainability. 2020;12:2675. doi: 10.3390/su12072675. - DOI
Publication types
MeSH terms
Substances
LinkOut - more resources
Full Text Sources
