. 2022 May 25;23(11):5933.
doi: 10.3390/ijms23115933.

Mitochondrial Dysfunction in Spinocerebellar Ataxia Type 3 Is Linked to VDAC1 Deubiquitination

Affiliations

Mitochondrial Dysfunction in Spinocerebellar Ataxia Type 3 Is Linked to VDAC1 Deubiquitination

Tina Harmuth et al. Int J Mol Sci. .

Abstract

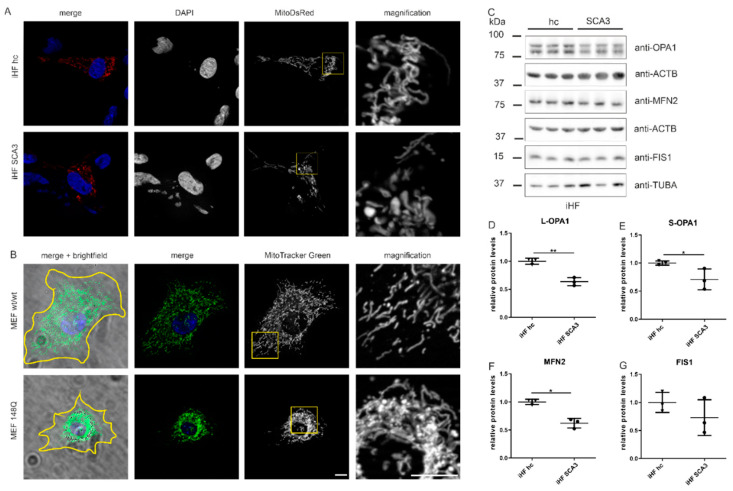
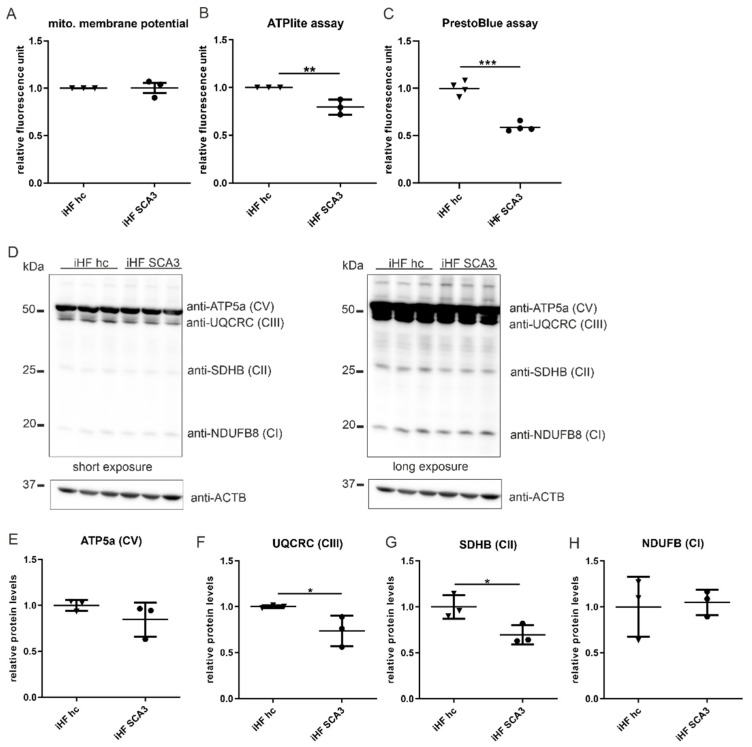
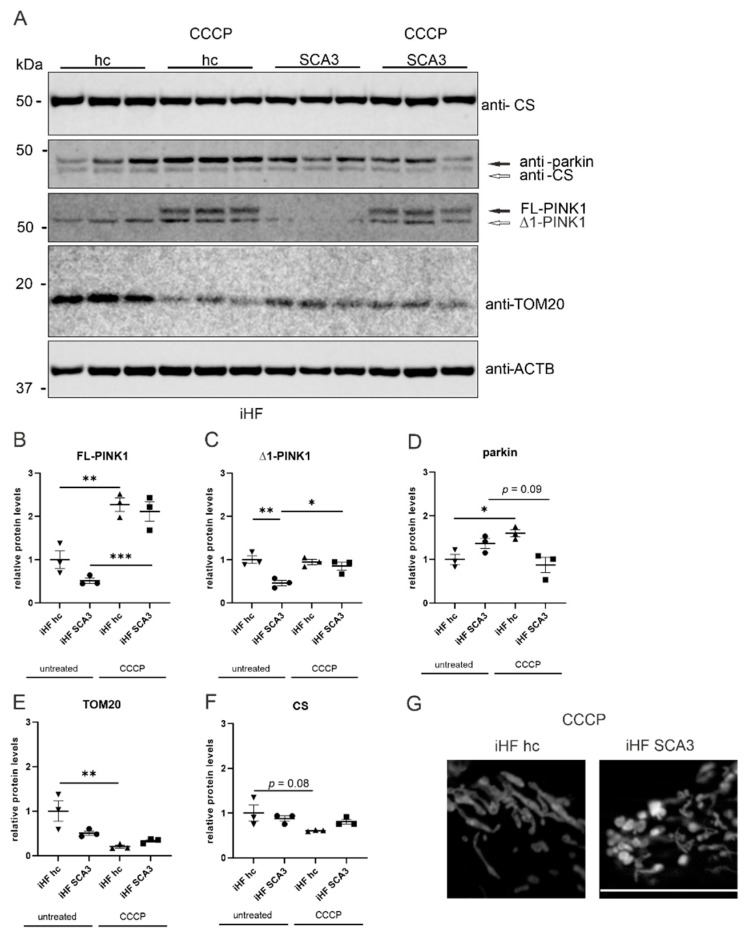
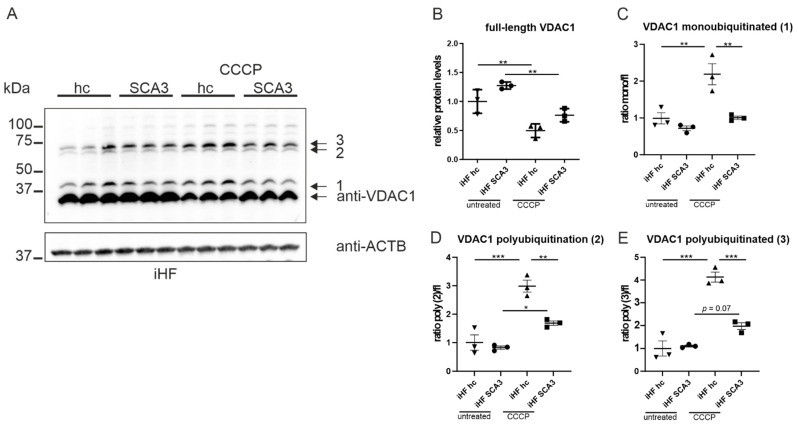
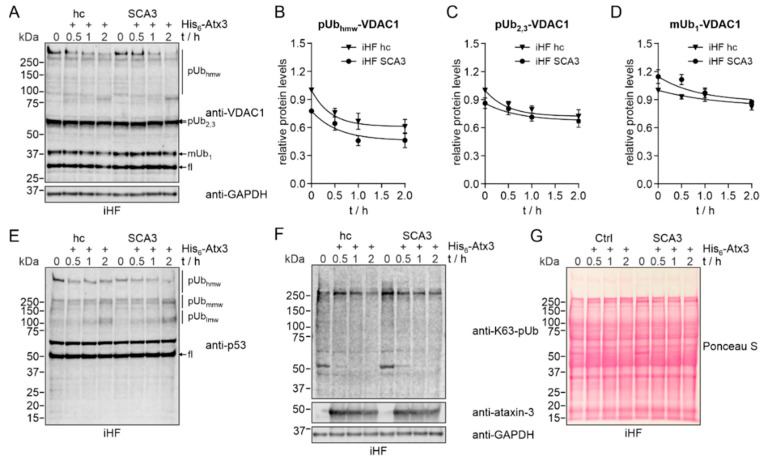
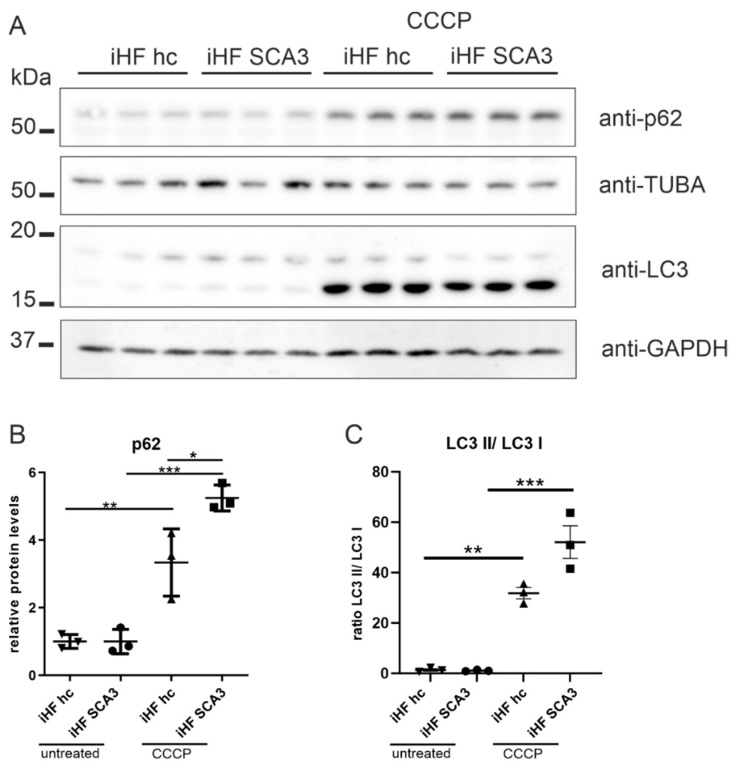
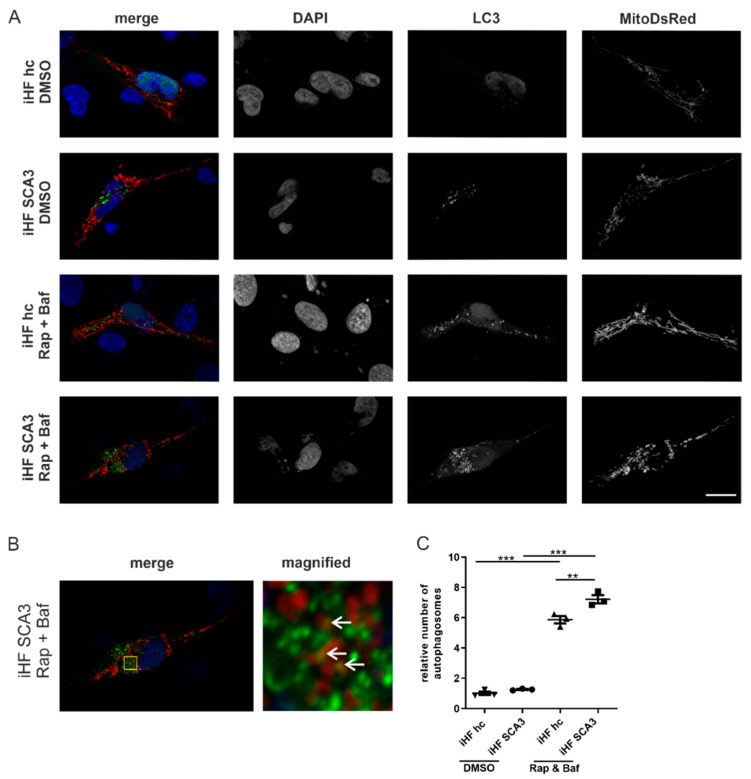
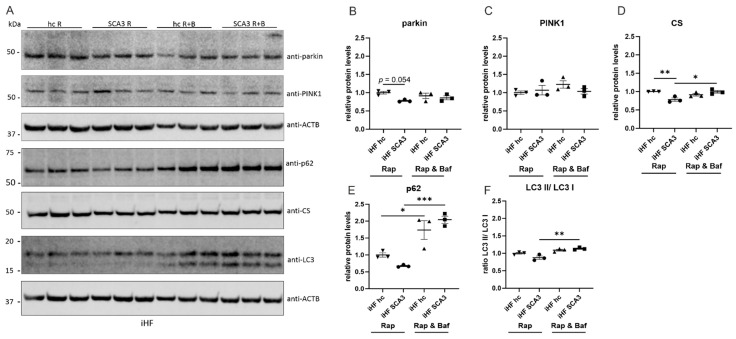
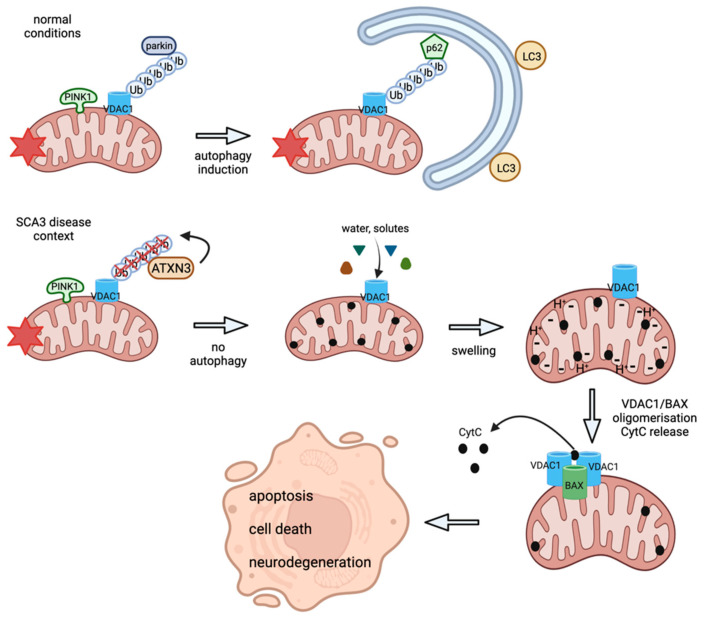
Dysfunctional mitochondria are linked to several neurodegenerative diseases. Metabolic defects, a symptom which can result from dysfunctional mitochondria, are also present in spinocerebellar ataxia type 3 (SCA3), also known as Machado-Joseph disease, the most frequent, dominantly inherited neurodegenerative ataxia worldwide. Mitochondrial dysfunction has been reported for several neurodegenerative disorders and ataxin-3 is known to deubiquitinylate parkin, a key protein required for canonical mitophagy. In this study, we analyzed mitochondrial function and mitophagy in a patient-derived SCA3 cell model. Human fibroblast lines isolated from SCA3 patients were immortalized and characterized. SCA3 patient fibroblasts revealed circular, ring-shaped mitochondria and featured reduced OXPHOS complexes, ATP production and cell viability. We show that wildtype ataxin-3 deubiquitinates VDAC1 (voltage-dependent anion channel 1), a member of the mitochondrial permeability transition pore and a parkin substrate. In SCA3 patients, VDAC1 deubiquitination and parkin recruitment to the depolarized mitochondria is inhibited. Increased p62-linked mitophagy, autophagosome formation and autophagy is observed under disease conditions, which is in line with mitochondrial fission. SCA3 fibroblast lines demonstrated a mitochondrial phenotype and dysregulation of parkin-VDAC1-mediated mitophagy, thereby promoting mitochondrial quality control via alternative pathways.

Keywords: Machado–Joseph disease; VDAC1 ubiquitination; ataxin-3; mitochondria dysfunction; spinocerebellar ataxia type 3.


Conflict of interest statement

The authors declare no conflict of interest.

Figures

Figure 1
Figure 1
Mitochondrial morphology is impaired in SCA3 cell models linked to reduced fusion protein levels. (A) Fibroblast cultures from SCA3 patients (iHF SCA3) were transfected with MitoDsRed and fixed 48 h after transfection. Cells were mounted using VECTASHIELD mounting medium with DAPI for nuclear staining. Mitochondrial morphology was observed by fluorescence microscopy in three independent experiments. (B) Mouse embryonic fibroblasts derived from transgenic SCA3 mice (MEF 148Q) were stained with MitoTracker Green TM and nuclei were stained with Hoechst 33342. Cells were imaged with a life-cell fluorescence microscope at 37 °C and 5% CO2. The experiment was repeated three times and the order in which wildtype and MEF 148Q were imaged was altered. Yellow line in merged pictures indicates the cell body outline as observed by brightfield microscopy. (A,B) Scale bar indicates 10 µm and in higher magnification 20 µm. Yellow boxes indicate magnified regions. (C) Protein levels of OPA1, MFN2 and FIS1 were measured by Western blot analyses. ACTB or TUBA is shown as loading control. (DG) Statistical analyses were determined using one-way ANOVA and Tukey’s post-test. iHF SCA3 were normalized to iHF hc. L(ong)-Opa1 = upper band, S(hort)-Opa1 = lower band. * p < 0.05, ** p < 0.01 by one-way ANOVA. Values are shown as mean +/− SEM. N = 3. hc = healthy control, SCA3 = fibroblasts derived from SCA3 patient, iHF = immortalized human fibroblasts, MEF = mouse embryonic fibroblasts, wt = wildtype.
Figure 2
Figure 2
Impaired expression of OXPHOS proteins, ATP production and cell viability in SCA3 fibroblasts. (A) Mitochondrial membrane potential was investigated by TMRE staining, followed by fluorescence-activated cell sorting. The experiment was repeated three times independently and three samples per genotype were measured per experiment. Statistical analysis of the mean TMRE signal intensity per sample is demonstrated. (B) For luciferase-based ATP measurements using ATPlite assay, cells were seeded in 96-well plates 24 h prior to the experiment. Three independent experiments were performed. Luminescence was measured using Perkin Elmer reader. (C) Cell viability was determined in vitro using PrestoBlue Cell Viability assay. Therefore, cells were grown in 96-well plates for 24 h. Fluorescence was measured by an ELISA reader at 540/590 nm. (D) Protein levels of NDFUB, UQCRC2, SDHB and ATP5a were analyzed by Western blotting using an antibody mixture of different OXPHOS proteins. For better visualization of the different OXPHOS proteins, different exposures are shown. ß-actin (ACTB) is shown as loading control. (EH) Statistical analyses were determined using one-way ANOVA and Tukey’s post-test. iHF SCA3 were normalized to iHF hc. * p < 0.05, ** p < 0.01, *** p < 0.001 by one-way ANOVA. Values are shown as mean +/− SEM. N = 3. hc = healthy control, SCA3 = fibroblasts derived from SCA3 patient, iHF = immortalized human fibroblasts.
Figure 3
Figure 3
Parkin levels are not increased after CCCP treatment in SCA3 patient-derived fibroblasts. (A) Protein levels of parkin, PINK1, citrate synthase (CS) and TOM20 were measured in patient-derived fibroblasts. Beta-actin (ACTB) is shown as loading control. (BF) Statistical analyses were performed from three independent experiments by one-way ANOVA and Tukey’s multiple comparison test. All genotypes and treatments were normalized to untreated iHF hc. (G) Fibroblasts were transfected with MitoDsRed vector and fixed 48 h after transfection. Depolarization of mitochondrial membrane potential was induced by 50 µM CCCP for 6h prior to fixation. Scale bar indicates 20 µm. * p < 0.05, ** p < 0.01, *** p < 0.001. Values are shown as mean +/− SEM. N = 3. hc = healthy control, SCA3 = fibroblasts derived from patients, iHF = immortalized human fibroblasts, FL= full-length, ∆1 = cleaved, CCCP = carbonyl cyanide m-chlorophenyl hydrazone.
Figure 4
Figure 4
PolyQ-expanded ataxin-3 modulates VDAC1 ubiquitination. (A) Protein levels of full-length, mono- and polyubiquitinated VDAC1 under normal growth conditions as well as after 6 h of 50 µM CCCP treatment. ACTB is shown as loading control. (BE) Ratio of ubiquitinated forms of VDAC1 was calculated to full-length expression values of VDAC1. All genotypes and treatments were normalized to untreated iHF hc. * p < 0.05, ** p < 0.01, *** p < 0.001 by one-way ANOVA. Values are shown as mean +/− SEM. N = 3.
Figure 5
Figure 5
Ataxin-3 deubiquitinates VDAC1 in vitro. Cell extracts of immortalized human fibroblasts from healthy controls (iHF hc) or SCA3 patients (iHF SCA3) were incubated with purified His6-ataxin-3 for up to 2 h. (A) Western blot analysis of VDAC1 revealed a time-dependent reduction in monoubiquitinated (mUb1) forms of VDAC1, and low-molecular (2,3, lmw) and high-molecular weight (hmw) polyubiquitinated (pUb) forms of VDAC1. GAPDH served as a loading control. fl = full-length VDAC1. (BD) For quantitative analysis, curves were extrapolated based on a one-phase decay nonlinear regression model. N = 3. (E,F) As assay controls, ataxin-3-mediated breakdown of K63-linked polyubiquitin chains and of lmw, medium-molecular (mmw) and hmw pUb forms of p53 were detected. Addition of His6-ataxin-3 was confirmed by immunodetection. GAPDH served as loading control. (G) Total protein staining with Ponceau S was performed as an additional loading control and for monitoring protein integrity.
Figure 6
Figure 6
Autophagic markers LC3 and p62 are altered in SCA3 patient-derived fibroblasts. (A) Protein levels of p62 and LC3 were analyzed by Western blot analyses under normal growth conditions and after 6 h CCCP treatment (50 µm). GAPDH or TUBA was used as loading control. (B,C) Statistical analyses were performed by one-way ANOVA and Tukey’s post-test. All genotypes and treatments were normalized to untreated iHF hc. * p < 0.05, ** p < 0.01, *** p < 0.001 by one-way ANOVA. Values are shown as mean +/− SEM. N = 3. hc = healthy control, SCA3 = fibroblasts derived from patients, iHF = immortalized human fibroblasts.
Figure 7
Figure 7
Increased number of autophagosomes in SCA3 patient-derived fibroblasts. SCA3 patient and control fibroblasts were co-transfected with pEGFP-LC3 and pDsRed2-Mito. (A) iHF hc and iHF SCA3 were co-transfected with pEGFP-C1 LC3 and pDsRed2-Mito plasmids. Forty-two hours after transfection, fibroblasts were treated with rapamycin (rap; 400 nM, 6 h) and bafilomycin (baf; 50 nM, 2 h). After treatments, cells were fixed with PFA, nuclei stained with DAPI and images taken with an Axiovert 200 M microscope. (B) Autophagosomes (green) were in close proximity to mitochondria and partially overlapping with mitochondria (yellow area indicated by arrows). Yellow box indicates magnified region. (C) Number of autophagosomes was evaluated in approximately 30 cells from three independent experiments using ImageJ. ** p < 0.01, *** p < 0.001 by one-way ANOVA. Values are shown as mean +/− SEM. N = 3. hc = healthy control, SCA3 = fibroblasts derived from patients, iHF = immortalized human fibroblasts.
Figure 8
Figure 8
Autophagic markers LC3 and p62 are altered in SCA3 patient-derived fibroblasts. (A) Protein levels of parkin, PINK1, citrate synthase (CS), p62 and LC3 in iHF cell lines were analyzed by Western blot under normal growth conditions and after rapamycin (R, Rap, 400 nM, 6 h) and rapamycin/ bafilomycin (B, Baf, 50 nM, 2h and R, Rap, 400 nM, 6 h) treatments. ACTB was used as loading control. (BF) Statistical analyses were performed using one-way ANOVA and Tukey´s multiple comparison test. The ratio of LC3-II/LC3-I was calculated by dividing the expression value of LC3-II by LC3-I. All genotypes and treatments were normalized to iHF hc. * p < 0.05, ** p < 0.01, *** p < 0.001 by one-way ANOVA. Values are shown as mean +/− SEM. N = 3. hc = healthy control, SCA3 = fibroblasts derived from patients, iHF = immortalized human fibroblasts.
Figure 9
Figure 9
Proposed model of mitochondrial and mitophagic dysfunction in SCA3 cell models. Under normal conditions, autophosphorylated PINK1 accumulates at the OMM and recruits cytosolic parkin. Parkin ubiquitinates OMM-located proteins such as VDAC1 and labels them, and thereby the entire mitochondrion, for degradation by the proteasome or mitophagy. In an SCA3 disease context, mutant ATXN3 itself deubiquitinates VDAC1, which leads to reduced polyubiquitination of VDAC1 that hinders mitophagy and initiates apoptotic pathways by mitochondrial swelling, BAX/VDAC1 oligomerization and cytochrome c (CytC) release. In the end, apoptotic processes lead to cell death and neurodegeneration. Graph created with BioRender.com (accessed on 9 March 2022).

References

    1. de Moura M.B., dos Santos L.S., Van Houten B. Mitochondrial dysfunction in neurodegenerative diseases and cancer. Environ. Mol. Mutagen. 2010;51:391–405. doi: 10.1002/em.20575. - DOI - PubMed
    1. Tan C.-C., Yu J.-T., Tan M.-S., Jiang T., Zhu X.-C., Tan L. Autophagy in aging and neurodegenerative diseases: Implications for pathogenesis and therapy. Neurobiol. Aging. 2014;35:941–957. doi: 10.1016/j.neurobiolaging.2013.11.019. - DOI - PubMed
    1. Laço M.N., Oliveira C.R., Paulson H.L., Rego A.C. Compromised mitochondrial complex II in models of Machado–Joseph disease. Biochim. Biophys. Acta (BBA) Mol. Basis Dis. 2012;1822:139–149. doi: 10.1016/j.bbadis.2011.10.010. - DOI - PMC - PubMed
    1. Yu Y.-C., Kuo C.-L., Cheng W.-L., Liu C.-S., Hsieh M. Decreased antioxidant enzyme activity and increased mitochondrial DNA damage in cellular models of Machado-Joseph disease. J. Neurosci. Res. 2009;87:1884–1891. doi: 10.1002/jnr.22011. - DOI - PubMed
    1. Chou A.-H., Yeh T.-H., Kuo Y.-L., Kao Y.-C., Jou M.-J., Hsu C.-Y., Tsai S.-R., Kakizuka A., Wang H.-L. Polyglutamine-expanded ataxin-3 activates mitochondrial apoptotic pathway by upregulating Bax and downregulating Bcl-xL. Neurobiol. Dis. 2006;21:333–345. doi: 10.1016/j.nbd.2005.07.011. - DOI - PubMed

MeSH terms

LinkOut - more resources