

PLOD2 Is a Prognostic Marker in Glioblastoma That Modulates the Immune Microenvironment and Tumor Progression
- PMID: 35682709
- PMCID: PMC9181500
- DOI: 10.3390/ijms23116037
PLOD2 Is a Prognostic Marker in Glioblastoma That Modulates the Immune Microenvironment and Tumor Progression
Abstract
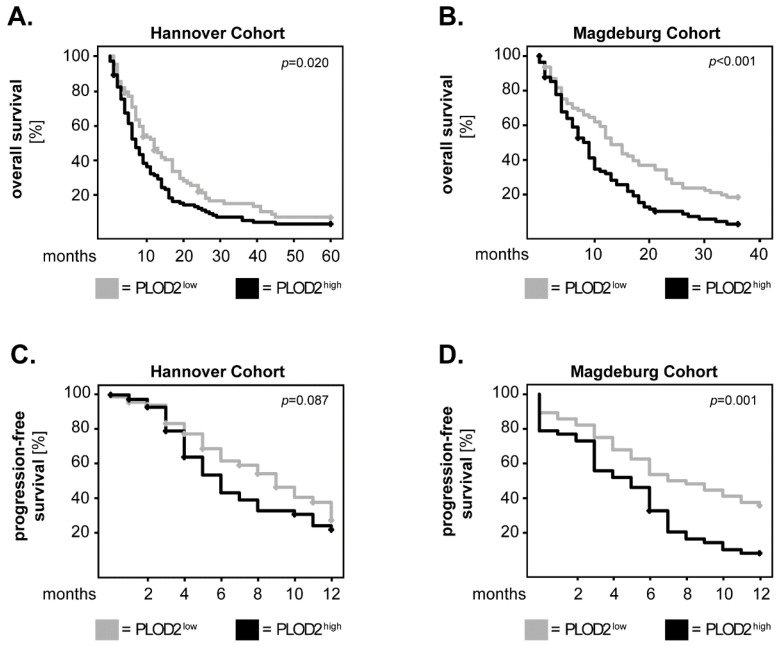
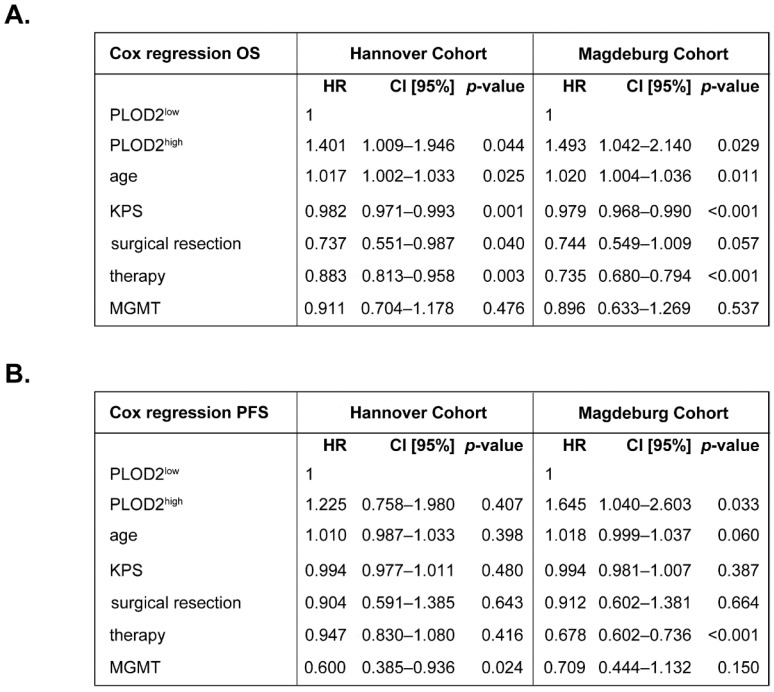
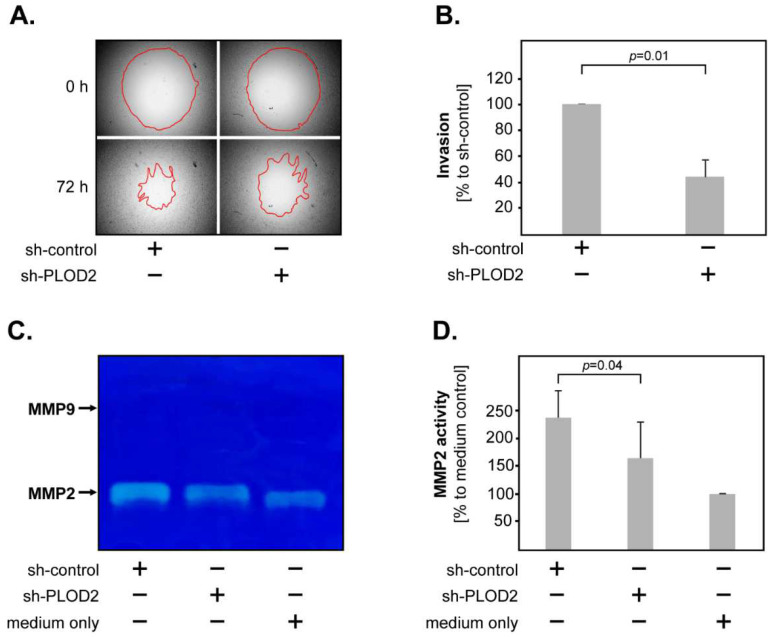
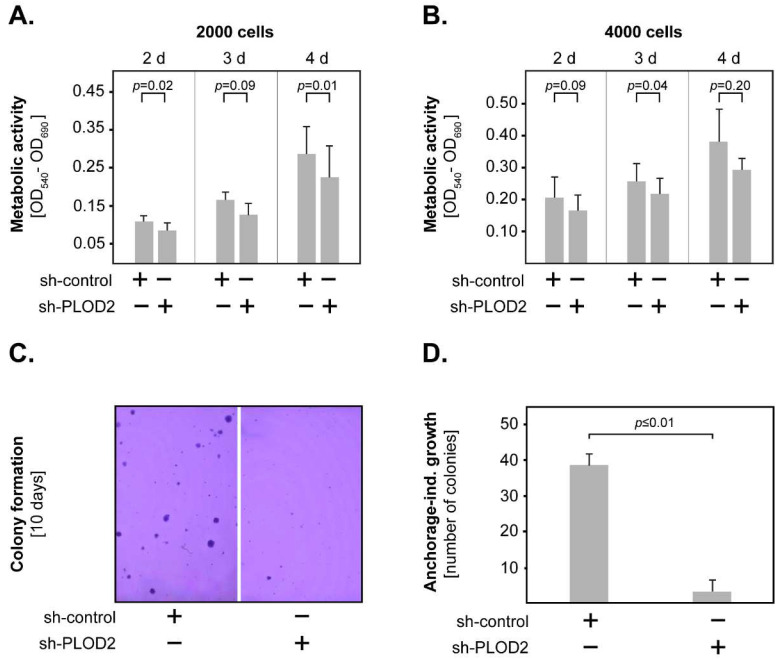
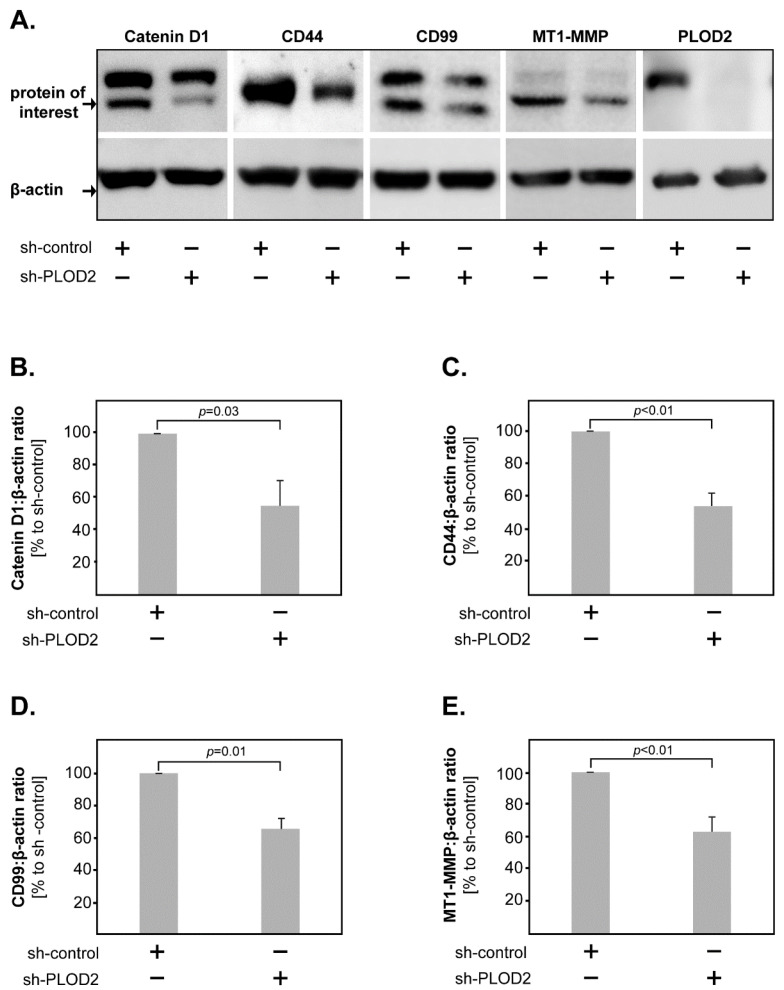
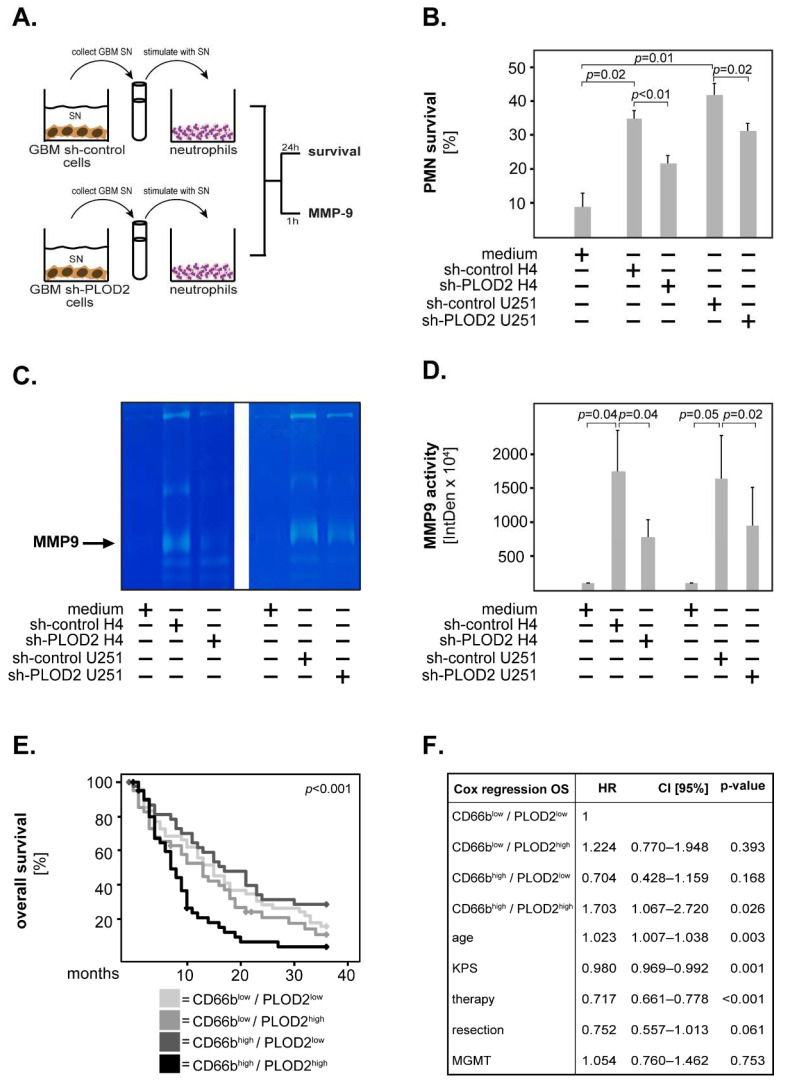
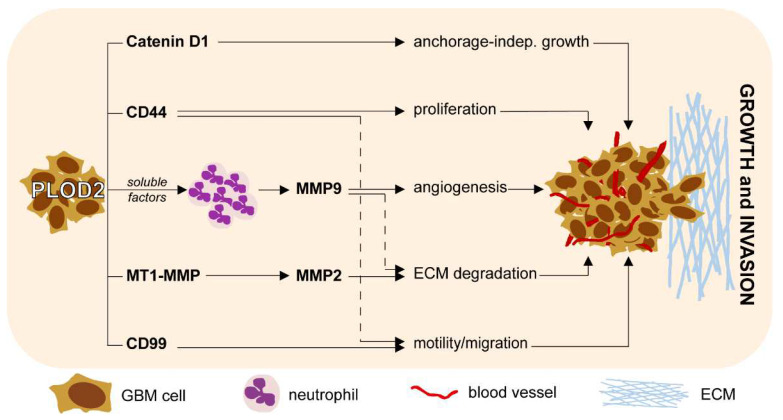
This study aimed to investigate the role of Procollagen-Lysine, 2-Oxoglutarate 5-Dioxygenase 2 (PLOD2) in glioblastoma (GBM) pathophysiology. To this end, PLOD2 protein expression was assessed by immunohistochemistry in two independent cohorts of patients with primary GBM (n1 = 204 and n2 = 203, respectively). Association with the outcome was tested by Kaplan−Meier, log-rank and multivariate Cox regression analysis in patients with confirmed IDH wild-type status. The biological effects and downstream mechanisms of PLOD2 were assessed in stable PLOD2 knock-down GBM cell lines. High levels of PLOD2 significantly associated with (p1 = 0.020; p2< 0.001; log-rank) and predicted (cohort 1: HR = 1.401, CI [95%] = 1.009−1.946, p1 = 0.044; cohort 2: HR = 1.493; CI [95%] = 1.042−2.140, p2 = 0.029; Cox regression) the poor overall survival of GBM patients. PLOD2 knock-down inhibited tumor proliferation, invasion and anchorage-independent growth. MT1-MMP, CD44, CD99, Catenin D1 and MMP2 were downstream of PLOD2 in GBM cells. GBM cells produced soluble factors via PLOD2, which subsequently induced neutrophils to acquire a pro-tumor phenotype characterized by prolonged survival and the release of MMP9. Importantly, GBM patients with synchronous high levels of PLOD2 and neutrophil infiltration had significantly worse overall survival (p < 0.001; log-rank) compared to the other groups of GBM patients. These findings indicate that PLOD2 promotes GBM progression and might be a useful therapeutic target in this type of cancer.
Keywords: PLOD2; glioblastoma; neutrophils; prognostic biomarkers; tumor progression.
Conflict of interest statement
The authors declare no conflict of interest.
Figures
Similar articles
-
Identification and Validation of PLOD2 as an Adverse Prognostic Biomarker for Oral Squamous Cell Carcinoma.Biomolecules. 2021 Dec 7;11(12):1842. doi: 10.3390/biom11121842. Biomolecules. 2021. PMID: 34944486 Free PMC article.
-
PLOD2 Is a Potent Prognostic Marker and Associates with Immune Infiltration in Cervical Cancer.Biomed Res Int. 2021 Jun 28;2021:5512340. doi: 10.1155/2021/5512340. eCollection 2021. Biomed Res Int. 2021. PMID: 34258263 Free PMC article.
-
Comprehensive analysis of glycometabolism-related genes reveals PLOD2 as a prognostic biomarker and therapeutic target in gastric cancer.BMC Gastroenterol. 2025 Apr 15;25(1):256. doi: 10.1186/s12876-025-03878-z. BMC Gastroenterol. 2025. PMID: 40229676 Free PMC article.
-
Procollagen-lysine 2-oxoglutarate 5-dioxygenase 2 promotes hypoxia-induced glioma migration and invasion.Oncotarget. 2017 Apr 4;8(14):23401-23413. doi: 10.18632/oncotarget.15581. Oncotarget. 2017. PMID: 28423580 Free PMC article.
-
PLOD2 in cancer research.Biomed Pharmacother. 2017 Jun;90:670-676. doi: 10.1016/j.biopha.2017.04.023. Epub 2017 Apr 14. Biomed Pharmacother. 2017. PMID: 28415047 Review.
Cited by
-
Minoxidil weakens newly synthesized collagen in fibrotic synoviocytes from osteoarthritis patients.J Exp Orthop. 2023 Aug 21;10(1):84. doi: 10.1186/s40634-023-00650-8. J Exp Orthop. 2023. PMID: 37605092 Free PMC article.
-
The Roles of AGTRAP, ALKBH3, DIVERSIN, NEDD8 and RRM1 in Glioblastoma Pathophysiology and Prognosis.Biomedicines. 2024 Apr 22;12(4):926. doi: 10.3390/biomedicines12040926. Biomedicines. 2024. PMID: 38672281 Free PMC article.
-
Construction and validation of a cell-in-cell related prognostic signature for hepatocellular carcinoma.Discov Oncol. 2025 Aug 12;16(1):1539. doi: 10.1007/s12672-025-03245-0. Discov Oncol. 2025. PMID: 40794333 Free PMC article.
-
Ivermectin Affects Neutrophil-Induced Inflammation through Inhibition of Hydroxylysine but Stimulation of Cathepsin G and Phenylalanine Secretion.Biomedicines. 2022 Dec 19;10(12):3284. doi: 10.3390/biomedicines10123284. Biomedicines. 2022. PMID: 36552040 Free PMC article.
-
Hypoxia-induced circPLOD2a/b promotes the aggressiveness of glioblastoma by suppressing XIRP1 through binding to HuR.Commun Biol. 2025 Jan 17;8(1):71. doi: 10.1038/s42003-025-07503-3. Commun Biol. 2025. PMID: 39820362 Free PMC article.
References
-
- Ostrom Q.T., Cioffi G., Gittleman H., Patil N., Waite K., Kruchko C., Barnholtz-Sloan J.S. CBTRUS Statistical Report: Primary Brain and Other Central Nervous System Tumors Diagnosed in the United States in 2012–2016. Neuro Oncol. 2019;21((Suppl. 5)):v1–v100. doi: 10.1093/neuonc/noz150. - DOI - PMC - PubMed
-
- Stupp R., Hegi M.E., Mason W.P., van den Bent M.J., Taphoorn M.J., Janzer R.C., Ludwin S.K., Allgeier A., Fisher B., Belanger K., et al. Effects of radiotherapy with concomitant and adjuvant temozolomide versus radiotherapy alone on survival in glioblastoma in a randomised phase III study: 5-Year analysis of the EORTC-NCIC trial. Lancet Oncol. 2009;10:459–466. - PubMed
MeSH terms
Substances
Grants and funding
LinkOut - more resources
Full Text Sources
Medical
Miscellaneous
