. 2022 May 27;23(11):6048.
doi: 10.3390/ijms23116048.

Angiotensin II Inhibits Insulin Receptor Signaling in Adipose Cells

Affiliations

Angiotensin II Inhibits Insulin Receptor Signaling in Adipose Cells

Citlaly Gutierrez-Rodelo et al. Int J Mol Sci. .

Abstract

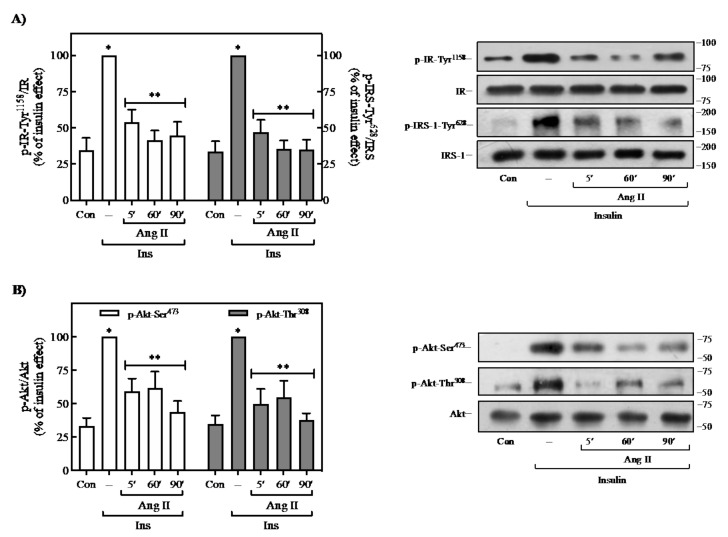
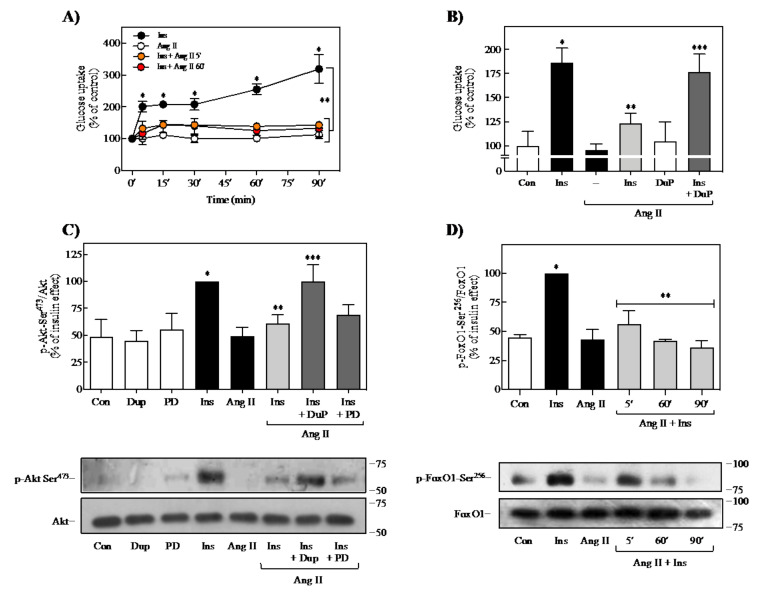
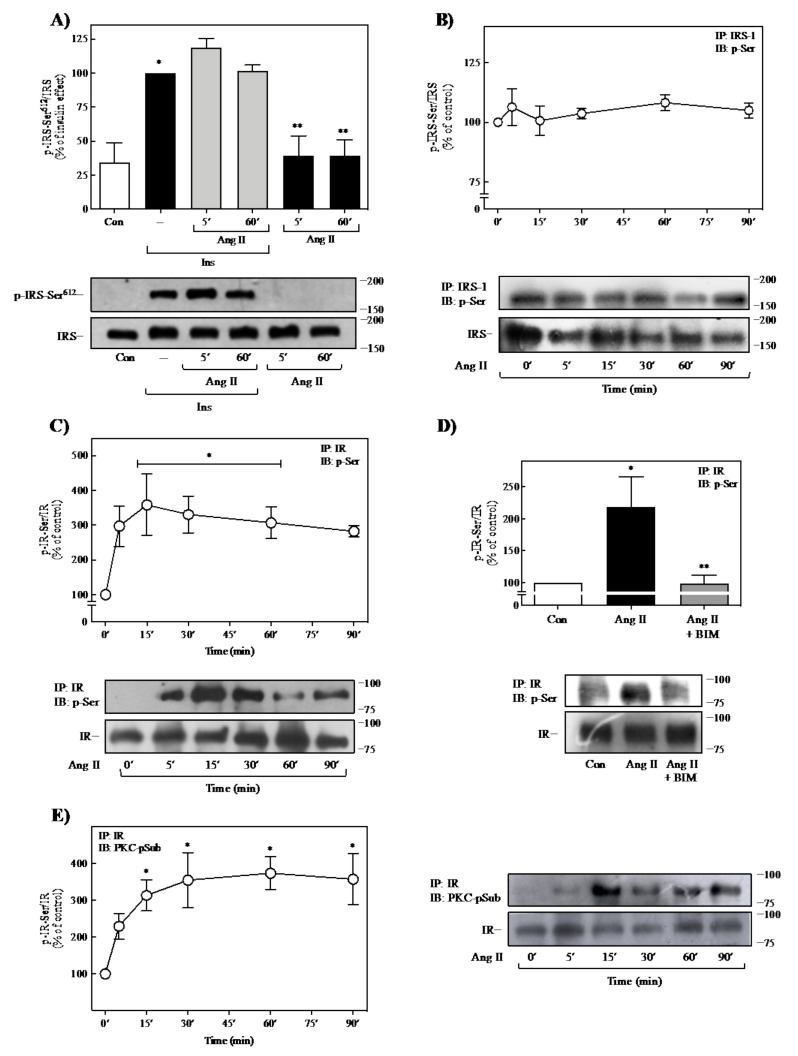
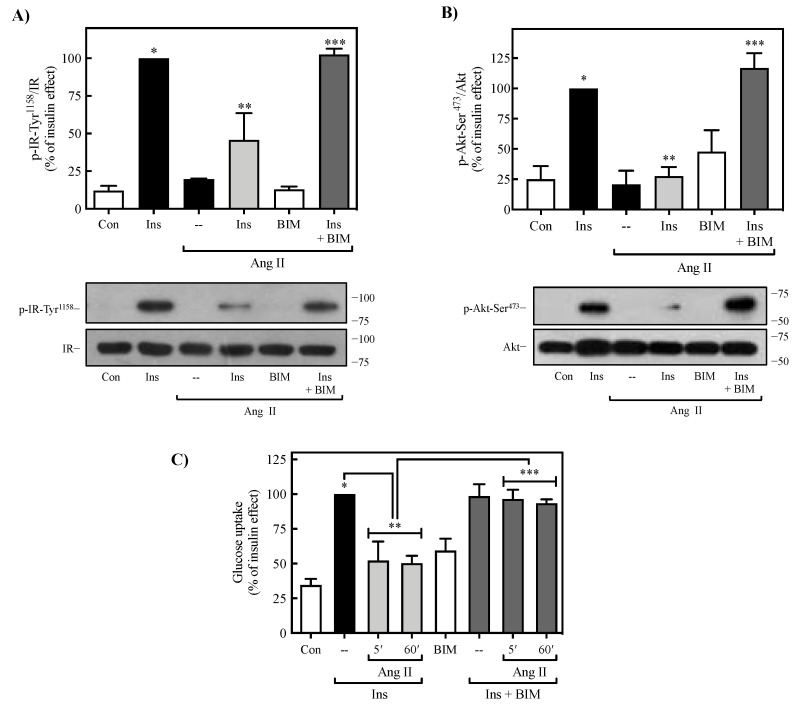
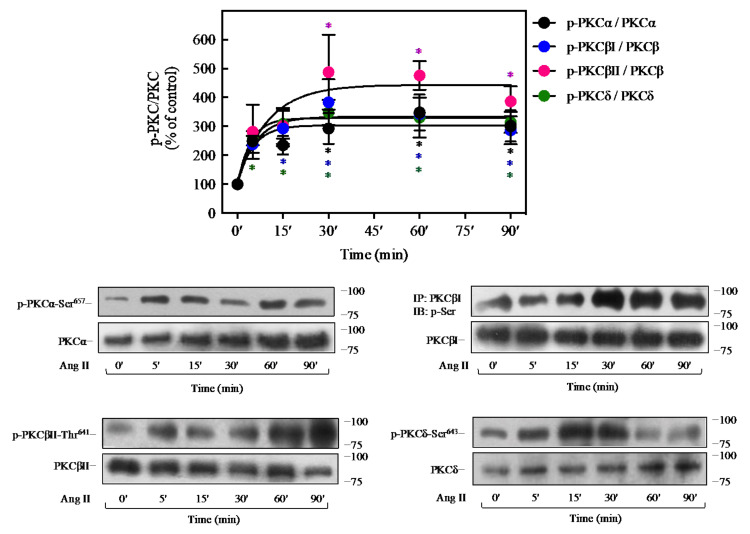
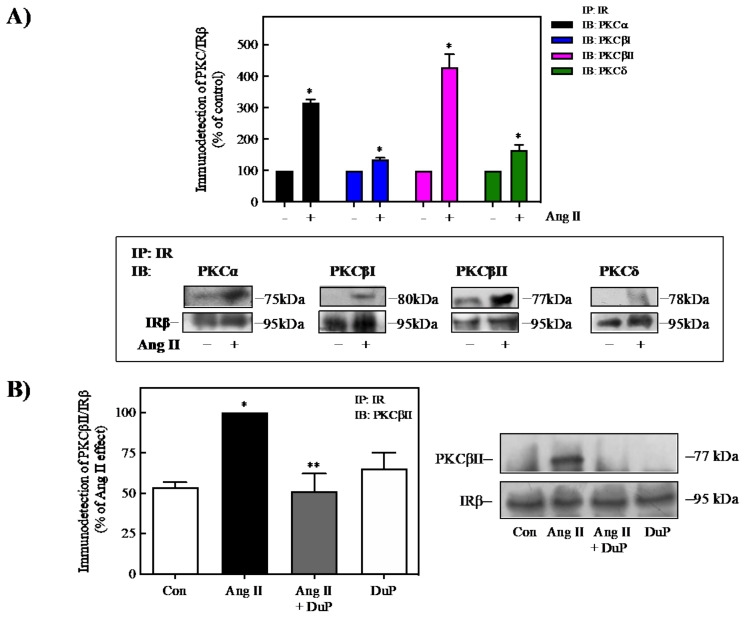
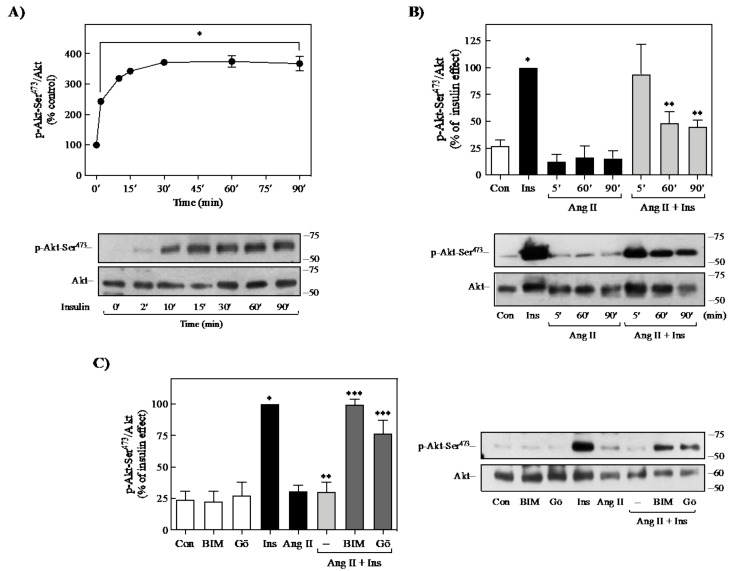
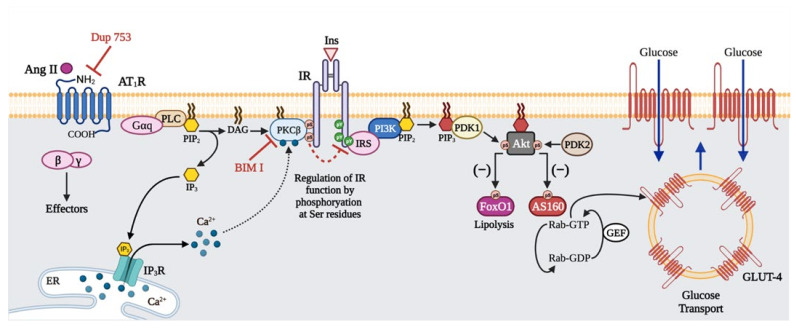
Angiotensin II (Ang II) is a critical regulator of insulin signaling in the cardiovascular system and metabolic tissues. However, in adipose cells, the regulatory role of Ang II on insulin actions remains to be elucidated. The effect of Ang II on insulin-induced insulin receptor (IR) phosphorylation, Akt activation, and glucose uptake was examined in 3T3-L1 adipocytes. In these cells, Ang II specifically inhibited insulin-stimulated IR and insulin receptor substrate-1 (IRS-1) tyrosine-phosphorylation, Akt activation, and glucose uptake in a time-dependent manner. These inhibitory actions were associated with increased phosphorylation of the IR at serine residues. Interestingly, Ang II-induced serine-phosphorylation of IRS was not detected, suggesting that Ang II-induced desensitization begins from IR regulation itself. PKC inhibition by BIM I restored the inhibitory effect of Ang II on insulin actions. We also found that Ang II promoted activation of several PKC isoforms, including PKCα/βI/βII/δ, and its association with the IR, particularly PKCβII, showed the highest interaction. Finally, we also found a similar regulatory effect of Ang II in isolated adipocytes, where insulin-induced Akt phosphorylation was inhibited by Ang II, an effect that was prevented by PKC inhibitors. These results suggest that Ang II may lead to insulin resistance through PKC activation in adipocytes.

Keywords: adipose cells; angiotensin II; insulin receptor; insulin resistance; protein kinase C; serine-phosphorylation.


Conflict of interest statement

The authors declare that the research was conducted in the absence of any commercial or financial relationships that could be construed as a potential conflict of interest.

Figures

Figure 1
Figure 1
Effect of Ang II on insulin-induced IR, IRS, and Akt phosphorylation. (A,B) 3T3-L1 adipocytes were pre-treated with 100 nM Ang II from 5 to 90 min and then stimulated with 100 nM insulin for an additional 90 min. Under all experimental conditions, cells without treatment were considered as controls. Total cell lysates were separated by SD-PAGE and analyzed by immunoblotting with anti-p-IR Tyr1158, anti-p-IRS Tyr628 (A), anti-p-Akt-Ser473, or an-ti-p-Akt-Ser308 (B), as described in Methods. IR, IRS-1, and Akt phosphorylation was quantitated by densitometry, and the mean values were plotted from three–five independent experiments. Vertical lines represent the S.E.M. Representative immunoblots are presented. Western blots were also probed for total IR and IRS (A), and Akt (B) and used for data normalization. (A,B) * p < 0.05 vs. Con; ** p < 0.05 vs. Ins (--). Con, control; Ins, insulin.
Figure 2
Figure 2
Effect of Ang II on insulin-induced glucose uptake and FoxO1 phosphorylation. (A) 3T3-L1 adipocytes were stimulated with 100 nM Ang II for the indicated times (white circles) or pretreated without (black circles) or with 100 nM Ang II for 5 (orange circles), or 60 min (red circles), and then stimulated with 100 nM insulin for the indicated times. (B) Cells were pretreated with 10 μM DuP 753 for 30 min before treatment with 100 nM Ang II for 60 min and then stimulated with 100 nM insulin for an additional 90 min. Glucose uptake was determined as described in Methods. (C) Cells were pretreated with or without 10 μM DuP 753 or 10 μM PD123177 for 30 min, then were stimulated with or without 100 nM Ang II for 60 min. Finally, the cells were stimulated with or without insulin for 90 min. (D) Adipocytes were pretreated with 100 nM Ang II for 5, 60, or 90 min, and then stimulated with 100 nM insulin for 90 min. Total cell lysates were separated by SDS-PAGE and analyzed by immunoblotting with anti-p-Akt Ser473 (C) and anti-p-FoxO1 Ser256 (D). Under all experimental conditions, cells without treatment were considered as controls. Blots were quantitated by densitometry, and the mean values were plotted from three-independent experiments. Vertical lines represent the S.E.M. Representative immunoblots are presented. Western blots were also probed to detect total Akt (C), and FoxO1 (D) and used for data normalization. (A) * p < 0.05 vs. time 0′; ** p < 0.05 vs. similar times stimulated only by Ins. (B,C) * p < 0.05 vs. Con; ** p < 0.05 vs. Ins; *** p < 0.05 vs. Ins + Ang II. (D) * p < 0.05 vs. Con; ** p < 0.05 vs. Ins. Con, control; DuP, DuP 753; PD, PD123177; Ins, insulin.
Figure 3
Figure 3
Ang II promotes IR-Ser-phosphorylation through PKC activation. (A) 3T3-L1 adipocytes were pretreated with or without Ang II for 5 or 60 min and then stimulated with 100 nM insulin for an additional 90 min. Cells were also exposed only to 100 nM Ang II for 5- or 60-min. Total cell lysates were separated by SDS-PAGE and analyzed by immunoblotting with anti-p-IRS-1-Ser612. (B,C,E) 3T3-L1 adipocytes were stimulated with 100 nM Ang II for the indicated times. Total cell lysates were immunoprecipitated with anti-IRS-1 (B) or anti-IR (C,E) antibody before SDS-PAGE analysis and immunoblotted with an anti-phospho-Ser antibody (B,C) or anti- phospho-(Ser) PKC substrate antibody (E). (D) Cells were pretreated with 2 μM BIM for 30 min before treatment with 100 nM Ang II for 60 min. Cell lysates were immunoprecipitated with anti-IR antibody before SDS-PAGE analysis and immunoblotted with an anti-phospho-Ser antibody. Under all experimental conditions, cells without treatment were considered as controls. Blots were quantitated by densitometry, and the mean values were plotted from three-five independent experiments. Vertical lines represent the S.E.M. Representative immunoblots are presented (BD). Western blots were also probed for total IRS (A,B) and IR (CE) and used for data normalization. (A) * p < 0.05 vs. Con; ** p < 0.05 vs. Ins (--). (C) * p < 0.05 and vs. time 0′. (D) * p < 0.05 vs. Con; ** p < 0.05 vs. Ang II. (E) * p < 0.05 vs. time 0. BIM, BIM I; Con, control; Ins, insulin.
Figure 4
Figure 4
Role of PKC in Ang II-mediated regulation of insulin signaling. 3T3-L1 adipocytes were treated with or without 1 µM BIM for 30 min, then stimulated with or without 100 nM Ang II for 60 min. Finally, the cells were stimulated with or without insulin for 90 min. Total cell lysates were separated by SD-PAGE and analyzed by immunoblotting with anti-p-IR Tyr1158 (A) or anti-p-Akt Ser473 antibodies (B). Blots were quantitated by densitometry, and the mean values were plotted from three–five independent experiments. Western blots were also probed for total IR (A) and Akt (B) and used for data normalization. (C) Cells were treated with or without 1 μM BIM for 30 min, then stimulated with or without 100 nM Ang II for 5 or 60 min, and finally stimulated with or without insulin for 90 min. Glucose uptake was evaluated, as described in the Methods. Under all experimental conditions, cells without treatment were considered as controls. The values are reported as a percentage of insulin effect ± S.E.M. of at least three experiments. (A,B) * p < 0.05 vs. Con; ** p < 0.05 vs. Ins; *** p < 0.05 vs. Ins + Ang II. (C) * p < 0.05 vs. Con; ** p < 0.05 vs. Ins (--); *** p < 0.05 vs. Ang II + Ins (5′, 60′). BIM, BIM I; Con, control; Ins, insulin.
Figure 5
Figure 5
Ang II promotes the activation of PKC. 3T3-L1 adipocytes were treated with 100 nM Ang II for the indicated times. Under all experimental conditions, cells without treatment were considered as controls. Total cell lysates were separated by SD-PAGE and analyzed by immunoblotting with anti-p-PKCα Ser657, anti-p-PKCβII Thr641, or anti-p-PKCδ Ser643 antibodies. For PKCβI, total cell lysates were immunoprecipitated with anti-PKCβI before SDS-PAGE analysis and immunoblotted with an anti-phospho-Ser antibody. Blots were quantitated by densitometry, and the mean values were plotted from three-five independent experiments. Vertical lines represent the S.E.M. Representative immunoblots are presented. Western blots were also probed for total PKCα, PKCβI, PKCβII, or PKCδ as a loading control. * p < 0.05 vs. time 0′. The different asterisk colors indicate the corresponding group and represent the significance with respect to control within the same group.
Figure 6
Figure 6
Ang II promotes the association of IR and classical and new isoforms of PKC. (A) 3T3-L1 adipocytes were pretreated with or without 100 nM Ang II for 60 min. (B) Cells were pretreated in the absence or presence of 10 μM DuP 753 for 30 min before treatment with 100 nM Ang II for 60 min. Under all experimental conditions, cells without treatment were considered as controls. Total cell lysates were immunoprecipitated with anti-IR before SDS-PAGE analysis and immunoblotted with anti-PKCα, anti-PKCβI, anti-PKCδ (A), or anti-PKCβII (A,B). Blots were quantitated by densitometry, and the mean values were plotted from three-five independent experiments. Vertical lines represent the S.E.M. Representative immunoblots are presented. Western blots were also probed for total IRβ. (A) * p < 0.05 vs. Con (−). (B) * p < 0.05 vs. Con; ** p < 0.05 vs. Ang II. Con, control; DuP, DuP 753.
Figure 7
Figure 7
Ang II induces insulin resistance in isolated adipocytes from BALB/c mice. (A) Isolated adipocytes were stimulated with 100 nM insulin for the indicated times. (B) Cells were pretreated with 100 nM Ang II for the indicated times and then stimulated with 100 nM Ins for 10 min. (C) Cells were incubated with 1 μM BIM or 100 nM Gö6976 for 30 min and then stimulated with 100 nM Ang II for 5, 60, or 90 min, and then stimulated with 100 nM insulin for 10 min. Under all experimental conditions, adipose cells without treatment were considered as controls. Total cell lysates were separated by SDS-PAGE and analyzed by immunoblotting with anti-p-Akt Ser473, as described in materials and methods. Akt phosphorylation was quantitated by densitometry, and the mean values were plotted from three independent experiments. Vertical lines represent the S.E.M. Representative immunoblots are presented. Western blots were also probed for total Akt as a loading control. (A) * p < 0.05 vs. time 0′. (B) * p < 0.05 vs. Con; ** p < 0.05 vs. Ins. (C) * p < 0.05 vs. Con; ** p < 0.05 vs. Ins; *** p < 0.05 vs. Ang + Ins (--). BIM, BIM I; Con, control; Gö, Gö6976; Ins, insulin.
Figure 8
Figure 8
A model of desensitization of the insulin signaling pathway by angiotensin II (Ang II) in 3T3-L1 adipocytes. When adipose cells are stimulated with Ang II, the endogenous AT1R is activated, leading to PKCβ activation, which in turn interacts with the insulin receptor (IR) and phosphorylates it on serine (Ser) residues impairing insulin actions such as glucose uptake and regulation of lipolysis. Blue arrows indicate Ang II signaling pathways. Black arrows indicate insulin signaling pathways. Minus sign (−) means negative regulation of FoxO1 and AS160 pathways by Akt. Red lines indicate the effect of PKC inhibitors (BIM I and Gö6976) and AT1R antagonist (DuP 753). Red dashed arrow indicates that PKC-mediated Ser-phosphorylation regulates IR function. Figure created with BioRender.com.

Similar articles

Cited by

References

    1. Boura-Halfon S., Zick Y. Phosphorylation of IRS proteins, insulin action, and insulin resistance. Am. J. Physiol. Endocrinol. Metab. 2009;296:E581–E591. doi: 10.1152/ajpendo.90437.2008. - DOI - PubMed
    1. Gutierrez-Rodelo C., Roura-Guiberna A., Olivares-Reyes J.A. Molecular mechanisms of insulin resistance: An update. Gac. Med. Mex. 2017;153:197–209. - PubMed
    1. Youngren J. Regulation of insulin receptor function. Cell. Mol. Life Sci. 2007;64:873–891. doi: 10.1007/s00018-007-6359-9. - DOI - PMC - PubMed
    1. Olivares-Reyes J.A., Arellano-Plancarte A., Castillo-Hernandez J.R. Angiotensin II and the development of insulin resistance: Implications for diabetes. Mol. Cell. Endocrinol. 2009;302:128–139. doi: 10.1016/j.mce.2008.12.011. - DOI - PubMed
    1. Boucher J., Kleinridders A., Kahn C.R. Insulin receptor signaling in normal and insulin-resistant states. Cold Spring Harb. Perspect. Biol. 2014;6:a009191. doi: 10.1101/cshperspect.a009191. - DOI - PMC - PubMed

MeSH terms

LinkOut - more resources