

Determination of IgG1 and IgG3 SARS-CoV-2 Spike Protein and Nucleocapsid Binding-Who Is Binding Who and Why?
- PMID: 35682724
- PMCID: PMC9181569
- DOI: 10.3390/ijms23116050
Determination of IgG1 and IgG3 SARS-CoV-2 Spike Protein and Nucleocapsid Binding-Who Is Binding Who and Why?
Abstract
The involvement of immunoglobulin (Ig) G3 in the humoral immune response to SARS-CoV-2 infection has been implicated in the pathogenesis of acute respiratory distress syndrome (ARDS) in COVID-19. The exact molecular mechanism is unknown, but it is thought to involve this IgG subtype's differential ability to fix, complement and stimulate cytokine release. We examined the binding of convalescent patient antibodies to immobilized nucleocapsids and spike proteins by matrix-assisted laser desorption/ionization-time of flight (MALDI-ToF) mass spectrometry. IgG3 was a major immunoglobulin found in all samples. Differential analysis of the spectral signatures found for the nucleocapsid versus the spike protein demonstrated that the predominant humoral immune response to the nucleocapsid was IgG3, whilst for the spike protein it was IgG1. However, the spike protein displayed a strong affinity for IgG3 itself, as it would bind from control plasma samples, as well as from those previously infected with SARS-CoV-2, similar to the way protein G binds IgG1. Furthermore, detailed spectral analysis indicated that a mass shift consistent with hyper-glycosylation or glycation was a characteristic of the IgG3 captured by the spike protein.
Keywords: COVID-19; IgG1; IgG3; convalescent plasma; nucleocapsid; predictive profile; spike protein.
Conflict of interest statement
The authors declare no conflict of interest. The funders had no role in the design of the study, in the collection, analyses or interpretation of data, in the writing of the manuscript or in the decision to publish the results.
Figures
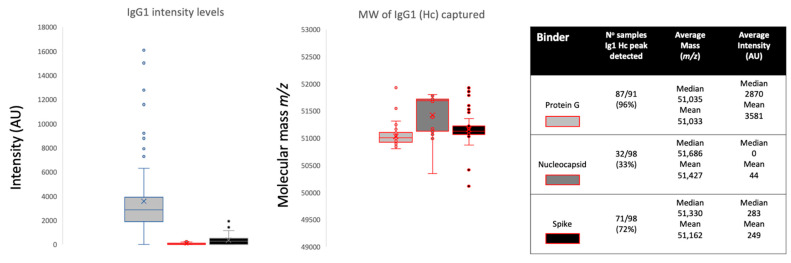
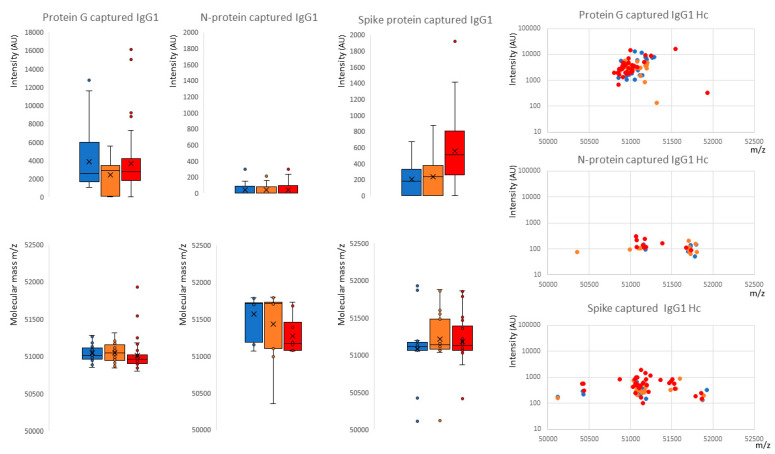
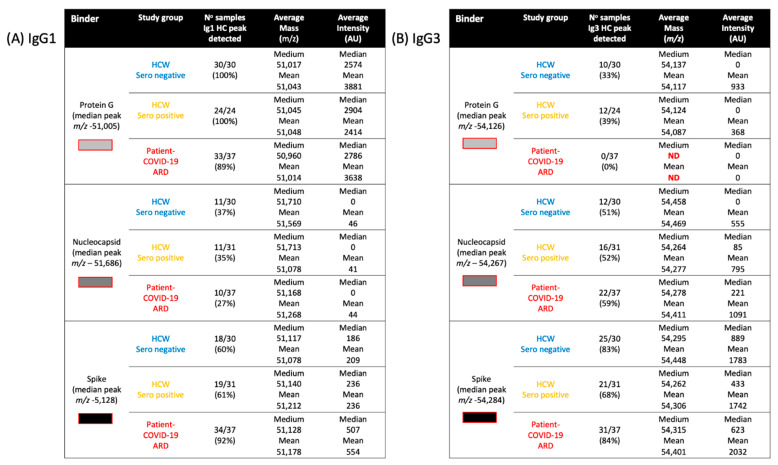
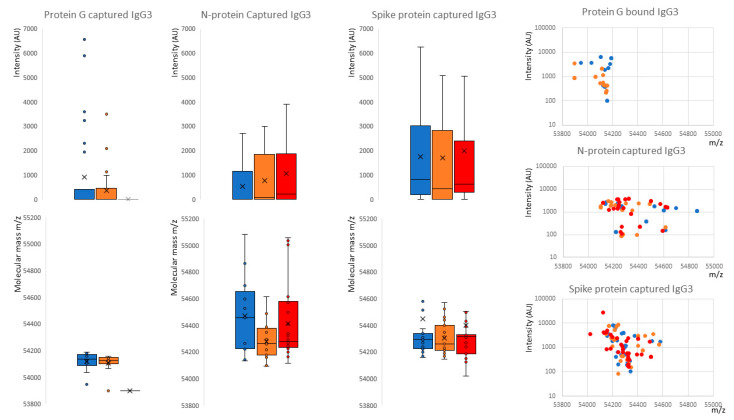
 , nucleocapsid
  and prefusion complete spike protein
  . Further delineation is done by sample infection status: blue represents data from SARS-CoV-2 sero-negative HCWs, orange from SARS-CoV-2 sero-positive HCWs having recovered from mild symptoms and red sample data from convalescent patients recovering from COVID-19 ARDS.
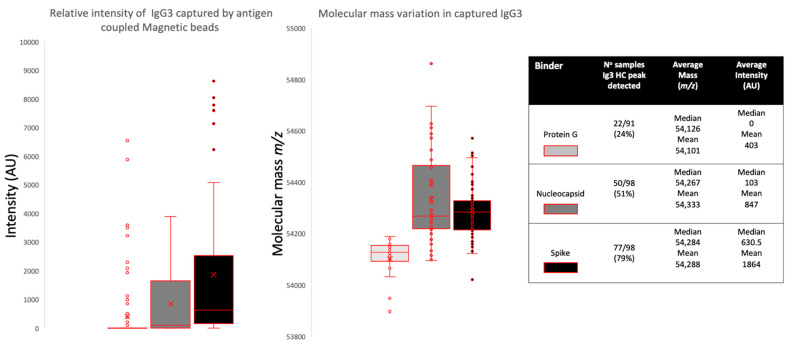
References
-
- Khadke S., Ahmed N., Ahmed N., Ratts R., Raju S., Gallogly M., De Lima M., Sohail M.R. Harnessing the immune system to overcome cytokine storm and reduce viral load in COVID-19: A review of the phases of illness and therapeutic agents. Virol. J. 2020;17:154. doi: 10.1186/s12985-020-01415-w. - DOI - PMC - PubMed
MeSH terms
Substances
Grants and funding
LinkOut - more resources
Full Text Sources
Other Literature Sources
Medical
Miscellaneous
