. 2022 May 28;23(11):6067.
doi: 10.3390/ijms23116067.

Endometrial Epithelial ARID1A Is Required for Uterine Immune Homeostasis during Early Pregnancy

Affiliations

Endometrial Epithelial ARID1A Is Required for Uterine Immune Homeostasis during Early Pregnancy

Ryan M Marquardt et al. Int J Mol Sci. .

Abstract

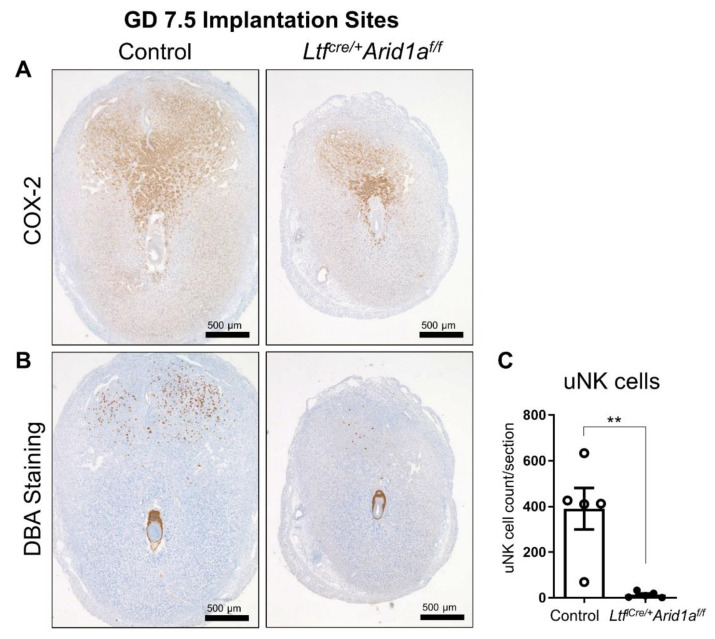
A growing body of work suggests epigenetic dysregulation contributes to endometriosis pathophysiology and female infertility. The chromatin remodeling complex subunit AT-rich interaction domain 1A (ARID1A) must be properly expressed to maintain normal uterine function. Endometrial epithelial ARID1A is indispensable for pregnancy establishment in mice through regulation of endometrial gland function; however, ARID1A expression is decreased in infertile women with endometriosis. We hypothesized that ARID1A performs critical operations in the endometrial epithelium necessary for fertility besides maintaining gland function. To identify alterations in uterine gene expression resulting from loss of epithelial ARID1A, we performed RNA-sequencing analysis on pre-implantation uteri from LtfiCre/+Arid1af/f and control mice. Differential expression analysis identified 4181 differentially expressed genes enriched for immune-related ingenuity canonical pathways including agranulocyte adhesion and diapedesis and natural killer cell signaling. RT-qPCR confirmed an increase in pro-inflammatory cytokine and macrophage-related gene expression but a decrease in natural killer cell signaling. Immunostaining confirmed a uterus-specific increase in macrophage infiltration. Flow cytometry delineated an increase in inflammatory macrophages and a decrease in uterine dendritic cells in LtfiCre/+Arid1af/f uteri. These findings demonstrate a role for endometrial epithelial ARID1A in suppressing inflammation and maintaining uterine immune homeostasis, which are required for successful pregnancy and gynecological health.

Keywords: ARID1A; endometriosis; endometrium; immunology; infertility; inflammation.


Conflict of interest statement

The authors declare no conflict of interest.

Figures

Figure 1
Figure 1
Deletion of endometrial epithelial Arid1a in mice causes diminished implantation site size and uNK cell numbers at GD 7.5. (A) Implantation sites were grossly visible in both control (n = 8) and LtfiCre/+Arid1af/f (n = 10) uteri at GD 7.5, appearing smaller in LtfiCre/+Arid1af/f uteri. (B) Implantation site number (left) as counted based on gross morphology was similar between control (n = 8, empty bar) and LtfiCre/+Arid1af/f (n = 10, grey bar) uteri at GD 7.5, but the average implantation site diameter (middle) and weight (right) were significantly decreased in LtfiCre/+Arid1af/f (n = 7, grey bar) uteri compared to controls (n = 5, empty bar). The graphs represent the mean ± SEM. * p < 0.05; ***, p < 0.001; ns, p > 0.05. Abbreviations: Arid1a, AT-rich interaction domain 1A; GD, gestation day; Ltf, lactoferrin; uNK, uterine natural killer.
Figure 2
Figure 2
Deletion of endometrial epithelial Arid1a in mice causes diminished decidual area and decreased uNK cell numbers in GD 7.5 implantation sites. (A) Representative images of COX-2 IHC in control and LtfiCre/+Arid1af/f mouse uteri at GD 7.5 (n = 5 IS/genotype). (B) Representative images of DBA lectin staining for uNK cells in control and LtfiCre/+Arid1af/f mouse uteri at GD 7.5 (n = 5 IS/genotype). (C) Quantification of the average number of DBA-stained uNK cells counted per tissue section in control (n = 5 IS, empty bar) and LtfiCre/+Arid1af/f (n = 5 IS, grey bar) uteri. The graph represents the mean ± SEM. **, p < 0.01. Abbreviations: Arid1a, AT-rich interaction domain 1A; COX-2, cyclooxygenase-2; DBA, Dolichos biflorus; GD, gestation day; IS, implantation site; Ltf, lactoferrin; uNK, uterine natural killer.
Figure 3
Figure 3
RNA-sequencing analysis of LtfiCre/+Arid1af/f uteri at GD 3.5 reveals large scale transcriptome dysregulation. (A) RNA-sequencing was performed on GD 3.5 control and LtfiCre/+Arid1af/f uterine RNA samples (n = 5/genotype). The PCA plot graphically shows that the overall gene expression patterns are distinct between groups. The plot was created using DESeq2 and ggplot2 in Rstudio. (B) Differential expression analysis with DESeq2 identified 4181 (2007 decreased, 2174 increased) significantly differentially expressed genes (DEGs) meeting the threshold of FDR < 0.05, corrected for multiple testing by independent hypothesis weighting. Hierarchical cluster analysis clearly distinguished the two groups based on gene expression patterns. The plot was created using ComplexHeatmap in Rstudio. (C) Ingenuity Pathway Analysis of the 4181 genes differentially expressed between control and LtfiCre/+Arid1af/f uteri (FDR < 0.05) identified 194 significantly enriched canonical pathways (p < 0.05). The plot shows the top 30 pathways from this list based on their corresponding p-values and also displays ratios (genes in current set/total genes in pathway) and number of genes from each pathway dysregulated in LtfiCre/+Arid1af/f uteri. (D) Ingenuity Pathway Analysis of the 4181 genes differentially expressed between control and LtfiCre/+Arid1af/f uteri (FDR < 0.05) identified 1526 significantly enriched upstream regulators (p < 0.05). The plot shows the top 30 upstream regulators from this list based on their corresponding p-values and also displays activation z-score and number of target molecules in the dataset. The plots were created with ggplot2 in Rstudio. Abbreviations: Arid1a, AT-rich interaction domain 1A; FDR, false discovery rate; GD, gestation day; Ltf, lactoferrin; PCA, principal component analysis.
Figure 4
Figure 4
LtfiCre/+Arid1af/f uteri exhibit immune-related gene expression changes at GD 3.5. (A) Ingenuity Pathway Analysis of the 4181 genes differentially expressed between Arid1af/f and LtfiCre/+Arid1af/f uteri (FDR < 0.05) identified 194 significantly enriched canonical pathways (p < 0.05). The plot shows the top 15 immune-related pathways from this list based on their corresponding p-values and also displays ratios (genes in current set/total genes in pathway) and number of genes from each pathway dysregulated in LtfiCre/+Arid1af/f uteri. (B) Ingenuity Pathway Analysis of the 4181 genes differentially expressed between Arid1af/f and LtfiCre/+Arid1af/f uteri (FDR < 0.05) identified 1526 significantly enriched upstream regulators (p < 0.05). The plot shows the top 15 immune-related upstream regulators from this list based on their corresponding p-values and also displays activation z-score and number of target molecules in the dataset. The plots were created with ggplot2 in Rstudio. (C) Relative expression levels of the mRNA from each gene were normalized to Rpl7 in whole uterine RNA preparations from control (n = 5, empty bar and empty dot) and LtfiCre/+Arid1af/f (n = 5, grey bar and filled dot) uteri at GD3.5 determined with RT-qPCR. The graphs represent the mean ± SEM. *, p < 0.05; **, p < 0.01; ***, p < 0.001; ns, p > 0.05. Abbreviations: Arid1a, AT-rich interaction domain 1A; Ccr2, C–C motif chemokine receptor 2; Ccr4, C–C motif chemokine receptor 4; Csf2, colony-stimulating factor 2; Csf3, colony-stimulating factor 3; Dio2, iodothyronine deiodinase 2; FDR, false discovery rate; GD, gestation day; Klra7, killer cell lectin-like receptor 7; Il1a, interleukin 1 alpha; Il17a, interleukin-17A; Il17rb, interleukin-17 receptor B; Il18, interleukin-18; Il36a, interleukin-36 alpha; Ltf, lactoferrin; Myd88, myeloid differentiation primary response 88; Naip1, NLR family, apoptosis inhibitory protein 1; NK, natural killer; PCA, principal component analysis; Rpl7, ribosomal protein L7; Scara5, scavenger receptor class A member 5; Tnf, tumor necrosis factor; Tnfsf13b, tumor necrosis factor ligand superfamily member 13B.
Figure 5
Figure 5
Uterine F4/80+ macrophage numbers are elevated in LtfiCre/+Arid1af/f mice at GD 3.5. (A) Representative images of F4/80 immunofluorescence (green) counterstained with DAPI (blue) in control (left) and LtfiCre/+Arid1af/f (right) mouse uterine sections at GD 3.5 (n = 5/genotype). For each group, the left image is higher magnification (scale bar = 50 µm) and the right image is a lower magnification region containing the zoomed region (indicated by large white rectangle; scale bar = 100 µm). The small insets in the upper right corner of the control images show no primary antibody negative controls (scale bar = 400 µm). (B) The percentage of F4/80-positive uterine cells was counted in representative stromal fields of approximately 350 cells per sample of control (n = 5, empty bar) and LtfiCre/+Arid1af/f (n = 5, grey bar) uteri at GD3.5. The graph represents the mean ± SEM. **, p < 0.01. Abbreviations: Arid1a, AT-rich interaction domain 1A; F4/80, EGF-like module-containing mucin-like hormone receptor-like 1; GD, gestation day; Ltf, lactoferrin.
Figure 6
Figure 6
F4/80+ CD64+ Ly6C+ cells are increased, while uDCs are decreased in LtfiCre/+Arid1af/f uteri at GD 3.5. (A) The flow gating strategy to identify F4/80+ CD64+ Ly6C+ and F4/80+ CD64+ Ly6C-cells in the mouse uterus is shown. (B) The percentage Gated proportion of F4/80+ CD64+ Ly6C+ cells (left) and F4/80+ CD64+ Ly6C− (right) cells in control (n = 14, empty bar) and LtfiCre/+Arid1af/f (n = 8, grey bar) uteri at GD 3.5 is shown. (C) The flow gating strategy to identify uDCs in the uterus is shown. (D) The percentage Gated proportion of uDCs in control (n = 14, empty bar) and LtfiCre/+Arid1af/f (n = 8, grey bar) uteri at GD 3.5. The graphs represent the mean ± SEM. **, p < 0.01. Abbreviations: Arid1a, AT-rich interaction domain 1A; CD64, cluster of differentiation 64; DCs, dendritic cells; F4/80, EGF-like module-containing mucin-like hormone receptor-like 1; GD, gestation day; Ltf, lactoferrin; Ly6c, lymphocyte antigen 6C.
Figure 7
Figure 7
Proposed mechanism: Endometrial epithelial ARID1A loss leads to increased proinflammatory cytokine expression and macrophage-driven uterine inflammation during early pregnancy. Abbreviations: ARID1A, AT-rich interaction domain 1A; CCL2, monocyte chemoattractant protein-1; CCR2, C–C motif chemokine receptor 2; IL-17A, interleukin-17A; IL-18, interleukin-18; IL-36A, interleukin-36 alpha; TNF, tumor necrosis factor.

Similar articles

Cited by

References

    1. Kelleher A.M., DeMayo F.J., Spencer T.E. Uterine Glands: Developmental Biology and Functional Roles in Pregnancy. Endocr. Rev. 2019;40:1424–1445. doi: 10.1210/er.2018-00281. - DOI - PMC - PubMed
    1. Wu S.P., Li R., DeMayo F.J. Progesterone Receptor Regulation of Uterine Adaptation for Pregnancy. Trends Endocrinol. Metab. 2018;29:481–491. doi: 10.1016/j.tem.2018.04.001. - DOI - PMC - PubMed
    1. Li R., Wang X., Huang Z., Balaji J., Kim T.H., Wang T., Zhou L., Deleon A., Cook M.E., Marbrey M.W., et al. The role of epithelial progesterone receptor isoforms in embryo implantation. iScience. 2021;24:103487. doi: 10.1016/j.isci.2021.103487. - DOI - PMC - PubMed
    1. Gellersen B., Brosens J.J. Cyclic decidualization of the human endometrium in reproductive health and failure. Endocr. Rev. 2014;35:851–905. doi: 10.1210/er.2014-1045. - DOI - PubMed
    1. Cha J., Sun X., Dey S.K. Mechanisms of implantation: Strategies for successful pregnancy. Nat. Med. 2012;18:1754–1767. doi: 10.1038/nm.3012. - DOI - PMC - PubMed