. 2022 May 29;23(11):6081.
doi: 10.3390/ijms23116081.

Deletion of the Autism-Associated Protein SHANK3 Abolishes Structural Synaptic Plasticity after Brain Trauma

Affiliations

Deletion of the Autism-Associated Protein SHANK3 Abolishes Structural Synaptic Plasticity after Brain Trauma

Carolina Urrutia-Ruiz et al. Int J Mol Sci. .

Abstract

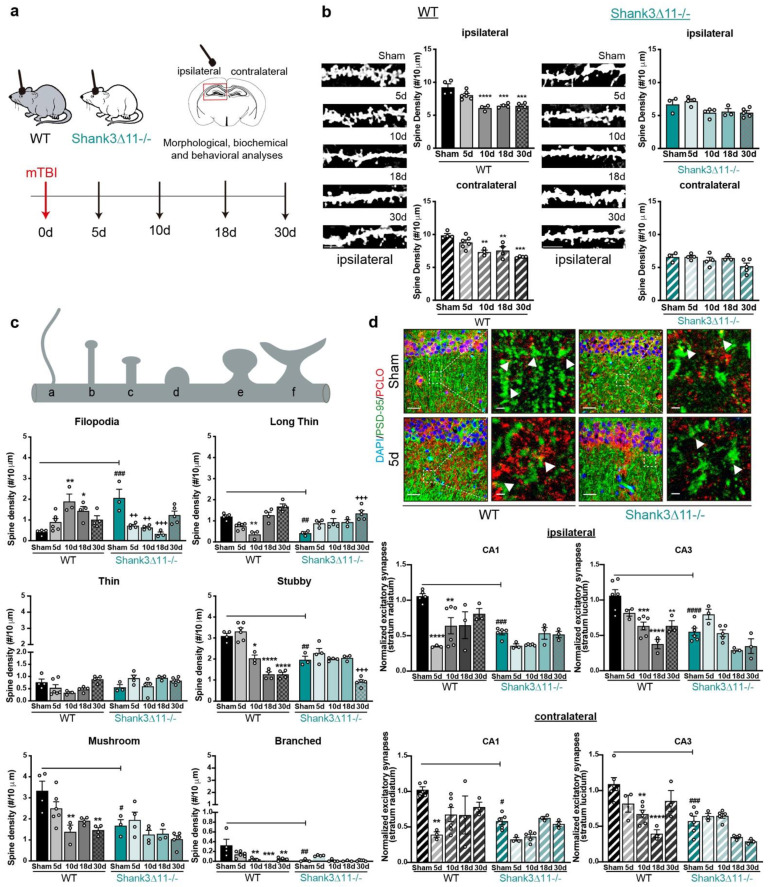
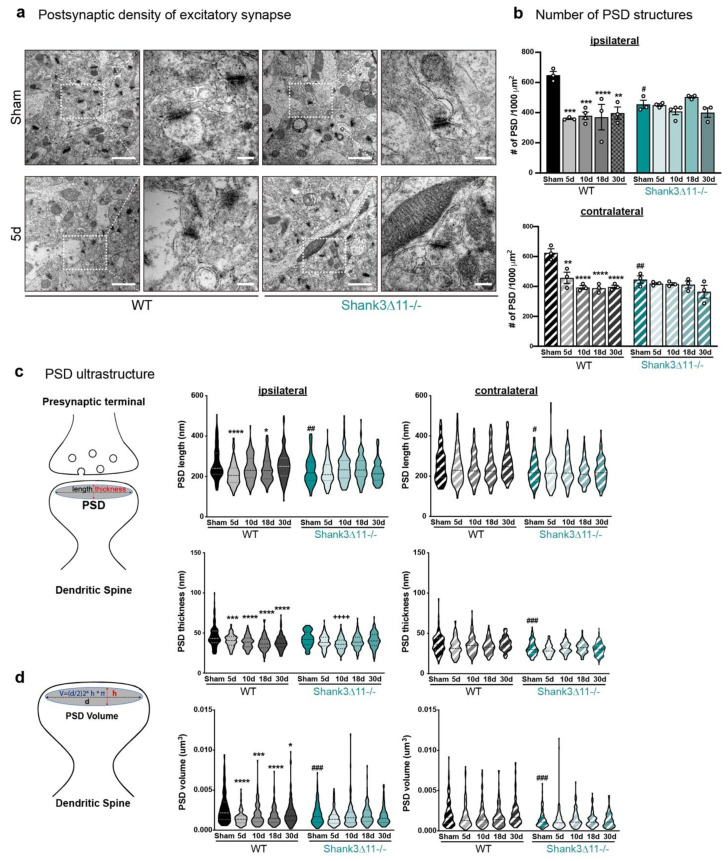
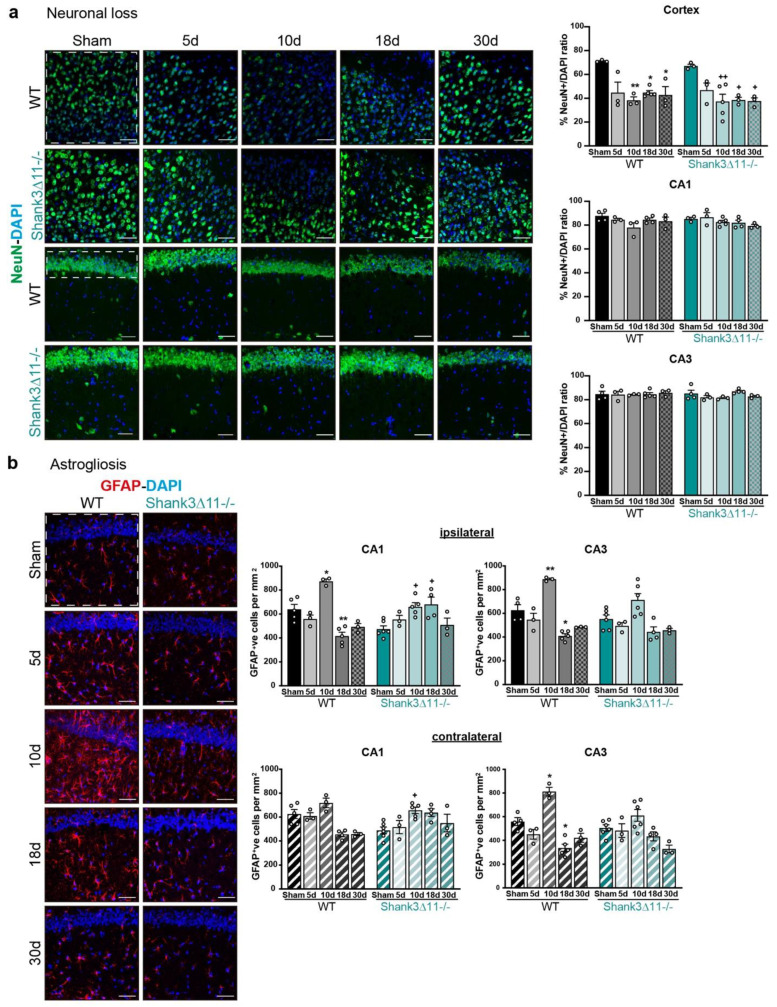
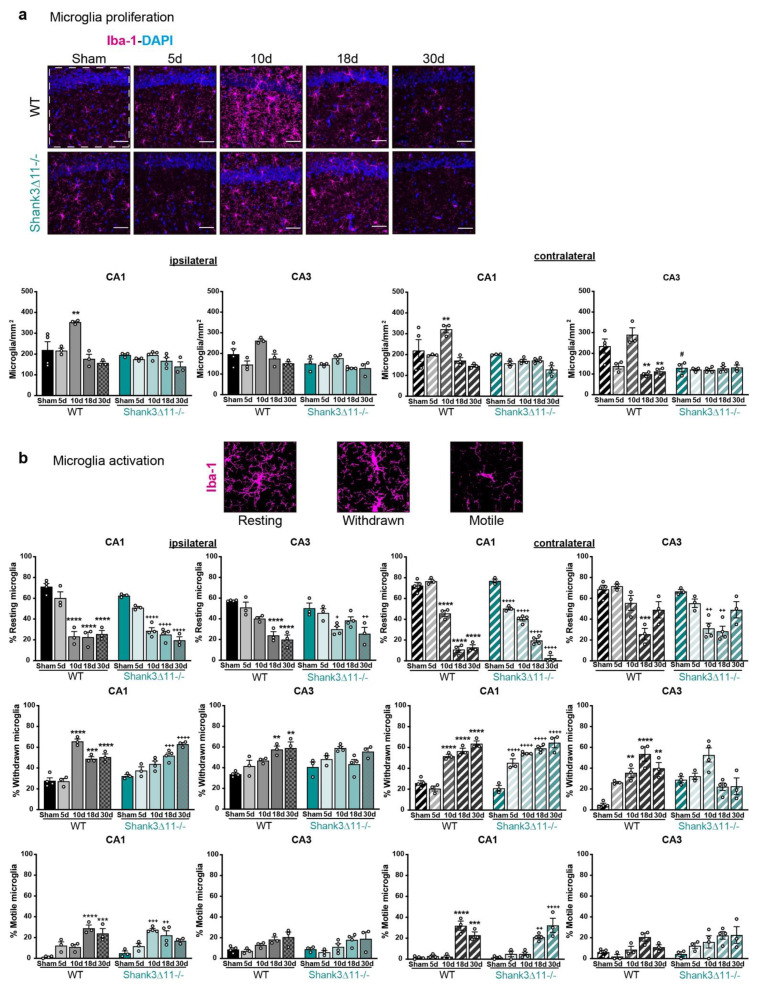
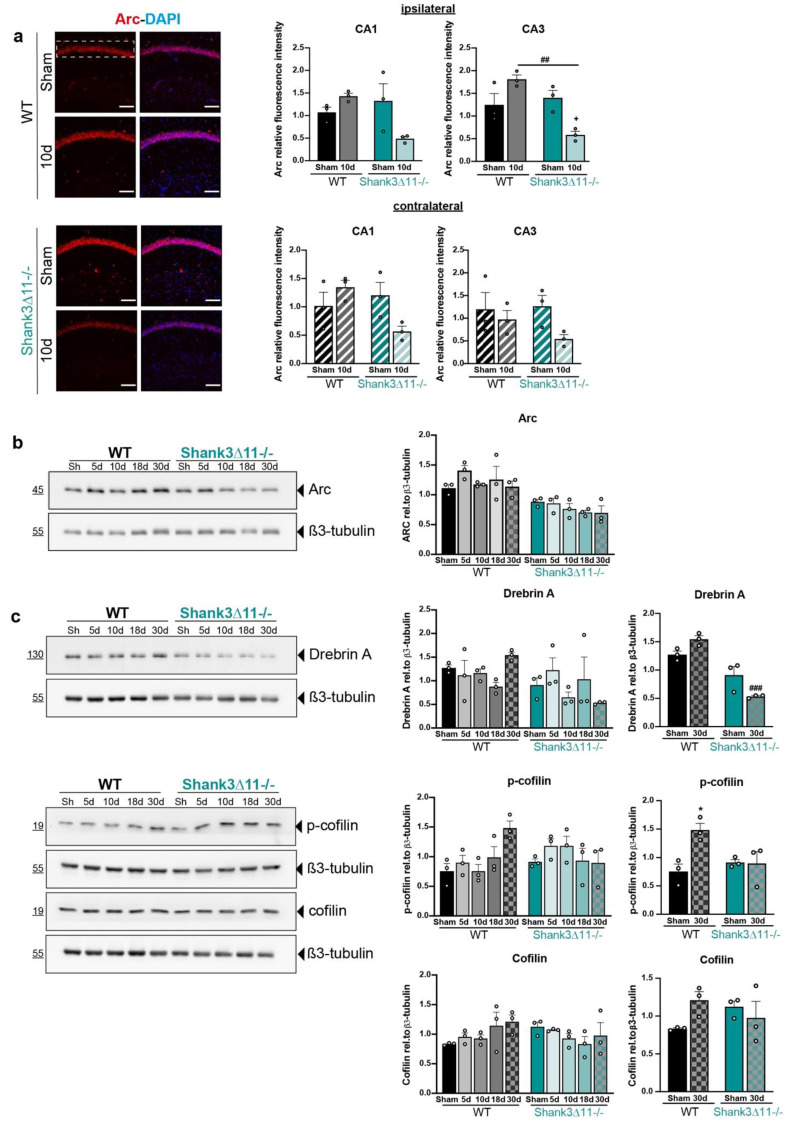
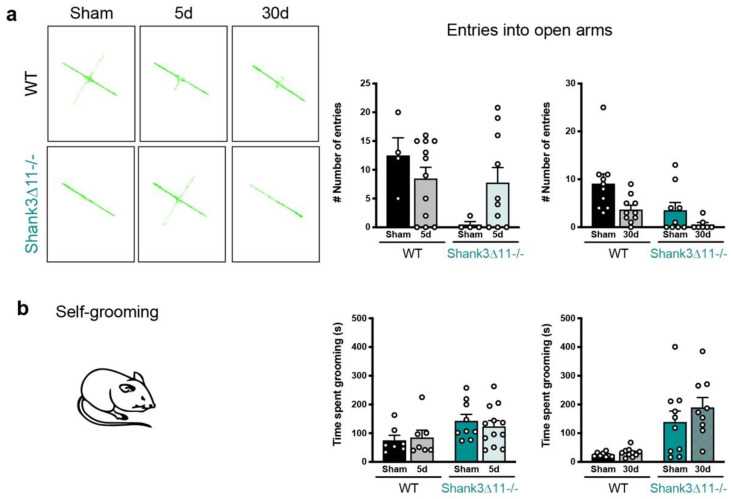
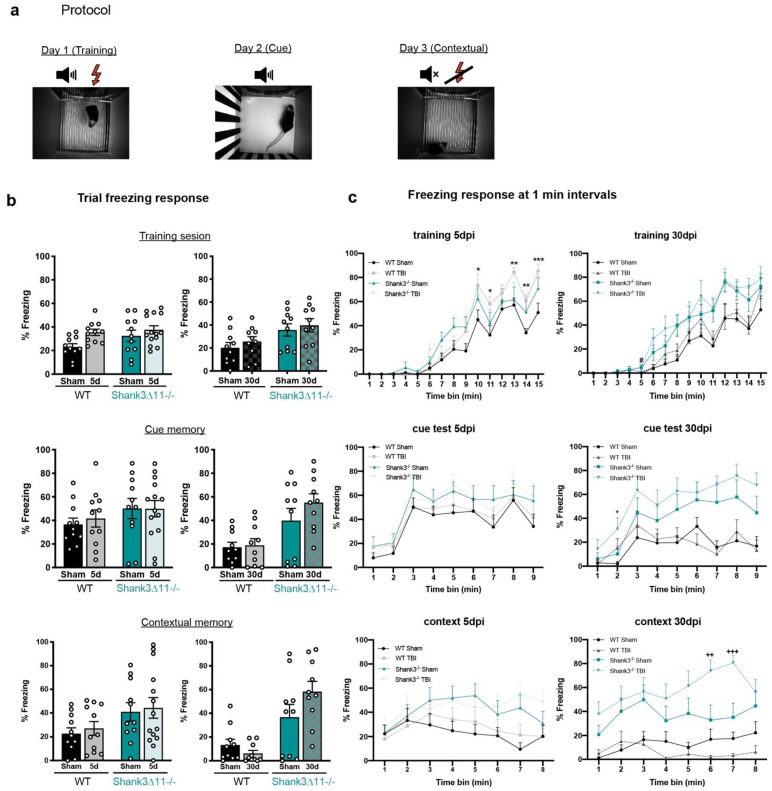
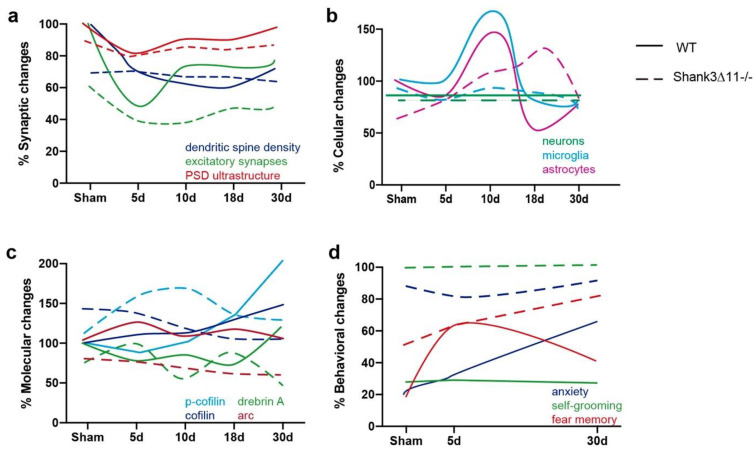
Autism spectrum disorders (ASDs) are characterized by repetitive behaviors and impairments of sociability and communication. About 1% of ASD cases are caused by mutations of SHANK3, a major scaffolding protein of the postsynaptic density. We studied the role of SHANK3 in plastic changes of excitatory synapses within the central nervous system by employing mild traumatic brain injury (mTBI) in WT and Shank3 knockout mice. In WT mice, mTBI triggered ipsi- and contralateral loss of hippocampal dendritic spines and excitatory synapses with a partial recovery over time. In contrast, no significant synaptic alterations were detected in Shank311-/- mice, which showed fewer dendritic spines and excitatory synapses at baseline. In line, mTBI induced the upregulation of synaptic plasticity-related proteins Arc and p-cofilin only in WT mice. Interestingly, microglia proliferation was observed in WT mice after mTBI but not in Shank311-/- mice. Finally, we detected TBI-induced increased fear memory at the behavioral level, whereas in Shank311-/- animals, the already-enhanced fear memory levels increased only slightly after mTBI. Our data show the lack of structural synaptic plasticity in Shank3 knockout mice that might explain at least in part the rigidity of behaviors, problems in adjusting to new situations and cognitive deficits seen in ASDs.

Keywords: ASD; SHANK3; TBI; plasticity; synapses; trauma.


Conflict of interest statement

The authors declare no conflict of interest.

Figures

Figure 1
Figure 1
Wild-type mice but not Shank3-deficient animals exhibit a loss of excitatory synapses after mTBI. (a) Schematic representation of the experimental design of this study. (b) Analysis of the dendritic spine density in the CA1 hippocampus after Golgi staining. The number of spines was analyzed on the ipsilateral (filled bar) and contralateral (hatched bar) sides in WT (black bars, left panel) and Shank311−/− animals (turquoise bars, right panel) after mTBI (scale bar, 5 μm). N = 3–6, error bars represent mean ± SEM; one-way ANOVA with Bonferroni’s post hoc comparison test was performed [WT ipsilateral side: F(4, 16) = 17.37, p = 0.0001; contralateral side: F(4, 16) = 11.63, p = 0.0001. Shank311−/− ipsilateral side: F(4, 14) = 4.066, p = 0.0216; contralateral side Kruskal–Wallis test, p = 0.2553]. (c) Assessment of the spine morphology after mTBI. N = 3–6, error bars represent mean ± SEM; two-way ANOVA (genotype × mTBI) with Bonferroni’s post hoc comparison test was performed. [Filopodia spines: genotype F(1, 30) = 1.155, p = 0.2911; mTBI intervention F(4, 30) = 2.244, p = 0.0878; interaction F(4, 30) = 15.83, p = 0.0001]. Long-thin spines: genotype F(1, 30) = 3.603, p = 0.0673; mTBI intervention F(4, 30) = 17.86, p = 0.0001; interaction genotype × mTBI F(4, 30) = 8.855, p = 0.0001. Thin spines: genotype F(1, 30) = 5.610, p = 0.0245; mTBI intervention F(4, 30) = 3.108, p = 0.0297; interaction genotype × mTBI F(4, 30) = 3.226, p = 0.0257). Stubby spines: genotype F(1, 30) = 14.86, p = 0.0006; mTBI intervention F(4, 30) = 49.26, p = 0.0001; interaction genotype × mTBI F(4, 30) = 13.90, p = 0.0001. Mushroom spines: genotype F(1, 30) = 13.78, p = 0.0008; mTBI intervention F(4, 30) = 7.558, p = 0.0002; interaction genotype × mTBI F(4, 30) = 1.830, p = 0.1491. Branched spines: genotype F(1, 30) = 8.436, p = 0.0068; mTBI intervention F(4, 30) = 5.752, p = 0.0015; interaction genotype × mTBI F(4, 30) = 4.294, p = 0.0073]. (d) Immunohistochemical staining and quantification of excitatory synapses in the CA1 and CA3 hippocampus using the postsynaptic marker PSD-95 (green) and presynaptic marker piccolo (red), arrowheads indicate synapses (scale bar = 20 μm, magnification scale bar = 2 μm). Upper panel, representative images of the ipsilateral CA1 hippocampal region. Synapses were quantified on the ipsilateral (upper panel, filled bars) or the contralateral side (bottom panel, hatched bars) of the CA1 and CA3 hippocampus. N = 3–6, error bars represent mean ± SEM; two-way ANOVA (genotype × mTBI) with Bonferroni’s post hoc comparison test was performed [Ipsilateral side of the injury, CA1: genotype F(1, 29) = 19.53, p = 0.0001; mTBI intervention F(4, 29) = 8.597, p = 0.0001; interaction genotype × mTBI F(4, 29) = 2.940, p = 0.0372. CA3: genotype F(1, 31) = 18.96, p = 0.0001; mTBI intervention F(4, 31) = 15.46, p = 0.0001; interaction genotype × mTBI F(4, 31) = 4.812, p = 0.0039] [Contralateral side of the injury CA1: genotype F(1, 29) = 14.30, p = 0.0007; mTBI intervention F(4, 29) = 7.037, p = 0.0004; interaction genotype × mTBI F(4, 29) = 1.780, p = 0.1599. CA3: genotype F(1, 31) = 7.15, p < 0.0001; mTBI intervention F(4, 31) = 9.512, p < 0.0001; interaction genotype × mTBI F(4,31) = 5.881, p = 0.0012]. * p < 0.05, ** p < 0.01; *** p < 0.001; **** p < 0.0001: comparison regarding WT sham animals; ++ p < 0.01; +++ p < 0.001: comparison regarding Shank311−/− sham animals; # p < 0.05, ## p < 0.01; ### p < 0.001; #### p < 0.0001: comparison between WT sham and Shank311−/− sham animals.
Figure 2
Figure 2
The overall number and ultrastructure of the postsynaptic density (PSD) of excitatory synapses are mainly affected in wild-type animals after mTBI. (a) Representative electron micrographs of synapses in the CA1 hippocampus ipsilateral side of WT mice (left panel) and Shank311−/− (right panel) after 5 d of mTBI. White dashed squares represent the PSD structures quantified (with a 25,000× magnification: scale bar = 1000 nm), whose size were subsequently analyzed (80,000× magnification: scale bar = 200 nm). (b) Determination of the number of PSDs structures after mTBI on the ipsilateral side (upper panel, filled bars) and the contralateral side (bottom panel, hatched bars) for WT (black bars) and in Shank311−/− mice (turquoise bars). N = 3, error bars represent mean ± SEM; two-way ANOVA (genotype × mTBI intervention) with Bonferroni’s post hoc comparison test was performed. [Ipsilateral side: genotype F(1, 22) = 0.3185, p = 0.5782; mTBI intervention F(4, 22) = 7.597, p = 0.0005; interaction genotype × mTBI F(4, 22) = 6.633, p = 0.0012. Contralateral side: genotype F(1, 20) = 6.916, p = 0.0161; mTBI intervention F(4, 20) = 12.89, p < 0.0001; interaction genotype × mTBI F(4, 20) = 5.836, p = 0.0028]. (c) Determination of the ultrastructure of the PSD. Assessment of the length and the thickness of the PSD structure, as depicted on the diagram. Measurements are represented on violin plots, where the median is depicted with dashed lines and the interquartile ranges in dotted lines. The length and thickness were measured on the ipsilateral (left panel, filled violin plots) and contralateral (right panel, hatched violin plots) sides of the CA1 hippocampus. N = 3. Data are shown as mean ± SEM; two-way ANOVA (genotype × mTBI intervention) with Bonferroni’s post hoc comparison test was performed. [PSD length on the ipsilateral side: genotype F(1, 1190) = 7.225, p = 0.0073; mTBI intervention F(4, 1190) = 8.094, p < 0.0001; interaction genotype × mTBI F(4, 1190) = 5.394, p = 0.0003. PSD length on the contralateral side: genotype F(1, 1190) = 36.99, p < 0.0001; mTBI intervention F(4, 1190) = 0.9649; interaction genotype × mTBI F(4, 1190) = 1.184; p = 0.3163]. [PSD thickness on the ipsilateral side: genotype F(1, 1190) = 0.6765, p = 0.4110; mTBI intervention F(4, 1190) = 19.09, p < 0.0001; interaction genotype × mTBI F(4, 1190) = 4.755, p = 0.0008. PSD thickness on the contralateral side: genotype F(1, 1190) = 63.37, p < 0.0001; mTBI intervention F(4, 1190) = 4.744, p = 0.0008; interaction genotype × mTBI F(4, 1190) = 2.692, p = 0.0298]. (d) Mathematical determination of the PSD volume as depicted on the diagram and represented in the violin plots, where the median is shown with dashed lines and the interquartile ranges with dotted lines. The PSD volume was determined on the ipsilateral (left panel, filled violin plot) and the contralateral sides (right panel, hatched violin plot) in both WT (black bars) and Shank311−/− (turquoise bars) animals. N = 3, error bars represent mean ± SEM; two-way ANOVA (genotype × mTBI intervention) with Bonferroni’s post hoc comparison test was performed. [PSD volume on the ipsilateral side: genotype F(1, 1190) = 7.088, p = 0.0079; mTBI intervention F(4, 1190) = 11.57, p < 0.0001; interaction genotype × mTBI F(4, 1190) = 5.122, p = 0.0004. PSD volume on the contralateral side: genotype F(1, 1190) = 56.57, p < 0.0001; mTBI intervention F(4, 1190) = 1.468, p = 0.2096; interaction genotype × mTBI F(4, 1190) = 1.854, p = 0.1162]. * p < 0.05, ** p < 0.01; *** p < 0.001; **** p < 0.0001: comparison regarding WT sham animals; ++++ p < 0.0001: comparison regarding Shank311−/− sham animals; # p < 0.05, ## p < 0.01; ### p < 0.001: comparison between WT sham and Shank311−/− sham animals.
Figure 3
Figure 3
mTBI triggers no hippocampal neuronal loss and prompts astrocyte proliferation in both wild-type and Shank311−/− mice. (a) Neurons were stained with the neuronal nuclear marker NeuN (green) and with DAPI (blue) on the brain ipsilateral cortex, CA1 and CA3 hippocampal region. Representative images (scale bar 50 μm) for the ipsilateral cortex (left first and second rows) and for the CA1 ipsilateral hippocampus (left third and fourth rows) of WT (first and third rows) and Shank311−/− mice (second and fourth rows). The white dashed square/rectangle represents the region quantified. The NeuN percentage of positive nuclei quantification per field is shown for the ipsilateral cortex and the CA1 and CA3 ipsilateral hippocampus for WT (black bars) and Shank311−/− mice (turquoise bars). N = 3–5. Data are shown as mean + SEM. Datasets were analyzed using two-way ANOVA (genotype × mTBI) with Bonferroni’s post hoc comparison test. [Ipsilateral cortex: genotype F(1, 24) = 0.8623, p = 0.3623; mTBI F(4, 24) = 12.85, p = 0.0001; genotype × mTBI F(4,24) = 0.2347, p = 0.9160. Ipsilateral CA1: genotype F(1, 25) = 0.09395, p = 0.7618; mTBI F(4, 25) = 2.619, p = 0.0591; genotype × mTBI F(1, 25) = 1.266, p = 0.3094. Ipsilateral CA3: genotype F(1, 25) = 0.7765, p = 0.3866; mTBI F(4, 25) = 0.9189, p = 0.4685; genotype × mTBI F(4, 25) = 0.9180, p = 0.4690]. (b) Astrocytes were stained with the astrocyte marker GFAP (red) and DAPI (blue). Representative images are shown for the different time points assessed in the CA1 hippocampal region following mTBI (scale bar 50 μm) (left panel). WT (left column) and Shank311−/− mice (right column). The number of GFAP positive cells per mm2 was quantified on the ipsilateral side of the CA1 and CA3 hippocampus (white dashed square represents the region quantified) of WT mice (filled black bars) and Shank311−/− mice (filled turquoise bars) and on the contralateral side of CA1 and CA3 hippocampus of WT (hatched black bars) or Shank311−/− mice (hatched turquoise bars). N = 3–6. Data are shown as mean + SEM. Datasets were analyzed using two-way ANOVA (genotype × mTBI) with Bonferroni’s post hoc comparison test. [Ipsilateral CA1: genotype F(1, 30) = 0.6101, p = 0.4409; mTBI F(4, 30) = 12.95, p < 0.0001; genotype × mTBI F(4, 30) = 12.66, p < 0.0001. Ipsilateral CA3: genotype F(1, 30) = 4.848, p = 0.0355; mTBI F(4, 30) = 26.22, p < 0.0001; genotype × mTBI F(4, 30) = 1.838, p = 0.1476]. [Contralateral CA1: genotype F(1, 29) = 0.02442, p = 0.8769; mTBI F(4, 29) = 6.634, p = 0.0006; genotype × mTBI F(4, 29) 7.279, p = 0.0003. Contralateral CA3: genotype F(1, 30) = 2.684, p = 0.1118; mTBI F(4, 30) = 21.86, p < 0.0001; genotype × mTBI F(4, 30) = 3.998, p = 0.0102]. * p < 0.05, ** p < 0.01;: comparison regarding WT sham animals; + p < 0.05, ++ p < 0.01: comparison regarding Shank311−/− sham animals.
Figure 4
Figure 4
Microglial proliferation was only observed in WT animals, while its activation is similar in both wild-type and Shank311−/− mice after mTBI. (a) Microglia were stained using the microglial marker Iba-1 (magenta) and nuclei were stained with DAPI (blue). Representative images are shown for each time point assessed for the CA1 hippocampal region on the left panel, WT mice (left column) and Shank311−/− (right column) (scale bar 50 μm). The number of positive Iba-1 cells per mm2 (right panel) was quantified on the ipsilateral side of the CA1 and CA3 hippocampus (white dashed square represents the region quantified) of WT mice (filled black bars) and Shank311−/− mice (filled turquoise bars) and on the contralateral side of CA1 and CA3 hippocampus of WT (hatched black bars) or Shank311−/− mice (hatched turquoise bars). N = 3–6. Data are shown as mean + SEM. Datasets were analyzed using two-way ANOVA (genotype × mTBI), with Bonferroni’s post hoc comparison test. [Ipsilateral CA1: genotype F(1, 23) = 15.19, p = 0.0007; mTBI F(4, 23) = 11.15, p < 0.0001; genotype × mTBI F(4, 23) = 4.807, p = 0.0058. Ipsilateral CA3: genotype F(1, 23) = 15.53, p = 0.0007; mTBI F(4, 23) = 8.192, p = 0.0003; genotype × mTBI F(4, 23) = 1.859, p = 0.1521]. [Contralateral CA1: genotype F(1, 23) = 3.637, p = 0.0050; mTBI F(4, 23) = 6.335, p = 0.0014; genotype × mTBI F(4, 23) = 3.637, p = 0.0194. Contralateral CA3 genotype F(1, 23) = 16.22, p = 0.0005; mTBI F(4, 23) = 9.227, p = 0.0001; genotype × mTBI F(4, 23) = 10.13, p < 0.0001]. (b) Quantification of the microglial activation in percentage following mTBI into R: resting, W: withdrawn, M: motile microglia activation states in the CA1 and CA3 hippocampus for the ipsilateral side in WT mice (filled black bars) and Shank311−/− mice (filled turquoise bars); and for the contralateral CA1 and CA3 hippocampus in WT mice (hatched black bars) and Shank311−/− mice (hatched turquoise bars). Representative images of the microglial activation state are shown. N = 3–4. Data are shown as mean ± SEM. Datasets were analyzed using two-way ANOVA (genotype × mTBI) and Bonferroni’s post hoc comparison test. [CA1 ipsilateral resting: genotype F(1, 23) = 2.023, p = 0.1684; mTBI F(4, 23) = 69.03, p < 0.0001; genotype × mTBI F(4, 23) = 1.858, p = 0.1521. CA3 ipsilateral resting: genotype F(1, 23) = 0.05001, p = 0.8250; mTBI F(4, 23) = 22.33, p < 0.0001; genotype × mTBI F(4, 23) = 3.902, p = 0.0146]; [CA1 ipsilateral withdrawn: genotype F(1, 23) = 1.045, p = 0.3174; mTBI F(4, 23) = 45.71, p < 0.0001; genotype × mTBI F(4, 23) = 13.47, p < 0.0001. CA3 ipsilateral withdrawn: genotype F(1, 23) = 0.4755, p = 0.4974; mTBI F(4, 23) = 8.888, p = 0.0002; genotype × mTBI F(4, 23) = 4.123, p = 0.0116]. [CA1 ipsilateral motile: genotype F(1, 23) = 0.4149, p = 0.5259; mTBI F(4, 23) = 19.37, p < 0.0001; genotype × mTBI F(4, 23) = 5.887, p = 0.0021. CA3 ipsilateral motile: genotype F(1, 23) = 0.2422, p = 0.6273; mTBI F(4, 23) = 6.595, p = 0.0011; genotype × mTBI F(4, 23) = 0.9965, p = 0.0011]. [CA1 contralateral resting: genotype F(1, 23) = 14.79, p = 0.0008; mTBI F(4, 23) = 301.5, p < 0.0001; genotype × mTBI F(4, 23) = 16.52, p < 0.0001. CA3 contralateral resting: genotype F(1, 23) = 5.7000, p = 0.0256; mTBI F(4, 23) = 19.62, p < 0.0001; genotype × mTBI F(4, 23) = 2.536, p = 0.0677]; [CA1 contralateral withdrawn: genotype F(1, 23) = 9.657, p = 0.0050; mTBI F(4, 23) = 86.75, p < 0.0001; genotype × mTBI F(4, 23) = 8.869, p = 0.0002. CA3 contralateral withdrawn: genotype F(1, 23) = 0.01156 p = 0.9153; mTBI F(4, 23) = 9.152, p = 0.0001; genotype × mTBI F(4, 23) = 11.82, p < 0.0001]. [CA1 ipsilateral motile: genotype F(1, 23) = 0.1305, p = 0.7212; mTBI F(4, 23) = 45.26, p < 0.0001; genotype × mTBI F(4, 23) = 3.565, p = 0.0210. CA3 ipsilateral motile: genotype F(1, 23) = 4.960, p = 0.0360; mTBI F(4, 23) = 5.407, p = 0.0032; genotype × mTBI F(4, 23) = 0.9930, p = 0.4312]. ** p < 0.01; *** p < 0.001; **** p < 0.0001: comparison regarding WT sham animals; + p < 0.05, ++ p < 0.01; +++ p < 0.001; ++++ p < 0.0001: comparison regarding Shank311−/− sham animals; # p < 0.05: comparison between WT sham and Shank311−/− sham animals.
Figure 5
Figure 5
Expression of synaptic and structural plasticity proteins are mainly affected in Shank311−/− animals after mTBI. (a) Immunostaining for Arc protein after 10d of mTBI (left panel). Representative images for the CA1 ipsilateral hippocampal region for WT (upper panel) and Shank311−/− (bottom panel) mice. The white dashed rectangle represents the region quantified for fluorescence intensity on the ipsilateral side (right upper panel, filled bars) and the contralateral side (right bottom panel, hatched bars) in the CA1 and CA3 hippocampus of WT (black bars) and Shank311−/− (turquoise bars) mice. N = 3. Datasets were analyzed using two-way ANOVA (genotype × mTBI intervention), and Bonferroni’s post hoc comparison test was performed. [CA1 ipsilateral side: genotype F(1, 8) = 2.887, p = 0.1277; mTBI intervention F(1, 8) = 1.411, p = 0.2690; interaction genotype × mTBI F(1,8) = 8.719, p = 0.0183. CA1 contralateral side: genotype F(1, 8) = 6.913, p = 0.0302; mTBI intervention F(1, 8) = 0.4284; interaction genotype × mTBI F(1,8) = 6.913, p = 0.0302]. [CA3 ipsilateral side: genotype F(1, 8) = 11.03, p = 0.0105; mTBI intervention F(1, 8) = 0.6144, p = 0.4557; interaction genotype × mTBI F(1,8) = 18.23, p = 0.0027. CA3 contralateral side: genotype F(1, 8) = 0.5416, p = 0.4828; interaction genotype × mTBI F(1,8) = 3.651, p = 0.0924; interaction genotype × mTBI F(1,8) = 1.012, p = 0.3439. (b) Western blot for Arc expression in P2 fractions of ipsilateral hippocampus lysates (left panel) and the relative quantification of Arc expression relative to β3-tubulin (right panel) in WT (black bars) and Shank311−/− (turquoise bars) mice. N = 3. Data are shown as mean ± SEM. Datasets were analyzed using two-way ANOVA (genotype × mTBI intervention), and Bonferroni’s post hoc comparison test was performed. [genotype F(1, 20) = 47.95, p < 0.0001; mTBI intervention F(4, 20) = 1.292, p = 0.3067; interaction genotype × mTBI F(4, 20) = 0.8788, p = 0.4942]. (c) Western blot expression analysis of the ipsilateral hippocampal cytosolic compartment (S2 fraction) for drebrin A, p-cofilin and cofilin (left panel) and the quantification of its expression relative to β3-tubulin (right panel) in WT (black bars) and Shank311−/− (turquoise bars) mice. N = 3. Data are shown as mean ± SEM. Datasets were analyzed using two-way ANOVA (genotype × mTBI intervention), and Bonferroni’s post hoc comparison test was performed. [drebrin A: genotype F(1, 20) = 5.884, p = 0.0249; mTBI intervention F(4, 20) = 0.4944, p = 0.7400; interaction genotype × mTBI F(4, 20) = 2.580, p = 0.0687. Drebrin A at 30 d: genotype F(1, 8) = 61.57, p < 0.0001; mTBI intervention F(1, 8) = 0.3714, p = 0.5591; interaction genotype × mTBI F(1, 8) = 13.65, p = 0.0061]. [p-cofilin: genotype F(1, 20) = 0.2243, p = 0.6409; mTBI intervention F(4, 20) = 1.516, p = 0.2354; interaction genotype × mTBI F(4, 20) = 3.509, p = 0.0252. p-cofilin at 30 d: genotype F(1, 8) = 2.404, p = 0.1596; mTBI intervention F(1, 8) = 6.554, p = 0.0336; interaction genotype × mTBI F(1, 8) = 7.184, p = 0.0279]. [Cofilin: genotype F(1, 20) = 0.1238, p = 0.7286; mTBI intervention F(4, 20) = 0.4915, p = 0.7420; interaction genotype × mTBI F(4, 20) = 2.026, p = 0.1294. Cofilin at 30 d: genotype F(1, 8) = 0.04807, p = 0.8319; mTBI intervention F(1, 8) = 0.7919, p = 0.3995; interaction genotype × mTBI F(1, 8) = 4.100, p = 0.0775]. *: comparison regarding WT sham animals; +: comparison regarding Shank311−/−, ###: comparison between WT and Shank311−/− after the same time point of mTBI. * p < 0.05: comparison regarding WT sham animals; + p < 0.05: comparison regarding Shank311−/− sham animals; ## p < 0.01: comparison between WT sham and Shank311−/− sham animals.
Figure 6
Figure 6
Wild-type animals show no anxiety-like behavior after mTBI, while repetitive behaviors are not exacerbated in Shank311−/− following mTBI. (a) Anxiety assessment through the elevated plus maze (EPM) after 5 d and 30 d of mTBI. Representative tracking images of WT mice trajectory (left upper panel) compared to Shank311−/− animals (left bottom panel) on the EPM. Quantification of the number of entries into the open arms of the EPM (right panel) of WT (black bars) and Shank311−/− (turquoise bars). N = 4–12, data are shown as mean ± SEM. Datasets were analyzed using two-way ANOVA (genotype × mTBI intervention), and Bonferroni’s post hoc comparison test was performed. [Entries into the open arm at 5 d: genotype F(1, 26) = 5.074, p = 0.0330; mTBI intervention F(1, 26) = 0.3374, p = 0.5664; interaction genotype × mTBI F(1, 26) = 3.990, p = 0.0563. Entries into the open arm at 30 d: genotype F(1, 32) = 8.457, p = 0.0066; mTBI intervention F(1, 32) = 7.903, p = 0.0084; interaction genotype × mTBI F(1, 32) = 0.6562, p = 0.4239]. (b) The time spent performing self-grooming was quantified during 20 min in WT (black bars) compared to Shank311−/− (turquoise bars) mice after 5 d and 30 d of mTBI. N = 7–12. Data are shown as mean ± SEM. Datasets were analyzed using two-way AN OVA (genotype × mTBI intervention), and Bonferroni’s post hoc comparison test was performed. [Self-grooming at 5 d: genotype F(1, 31) = 5.651, p = 0.0238; mTBI intervention F(1, 31) = 0.04366, p = 0.8359; interaction genotype × mTBI F(1, 31) = 0.4236, p = 0.5199. Self-grooming at 30 d: genotype F(1, 33) = 25.46, p < 0.0001; mTBI intervention F(1, 33) = 1.182, p = 0.2849; interaction genotype × mTBI F(1, 33) = 0.6416, p = 0.4288].
Figure 7
Figure 7
Trace fear conditioning memory was slightly affected in both genotypes following mTBI. (a) Depiction of the protocol for the training, auditory or cued memory and contextual fear conditioning test sessions after 5 d and 30 d of mTBI. (b) Percentage of the time spent freezing during each whole trial. N = 10–14. Data are shown as mean ± SEM. Datasets were analyzed using two-way ANOVA (genotype × mTBI intervention), and Bonferroni’s post hoc comparison test was performed. [Training session at 5 d: genotype F(1, 43) = 2.723, p = 0.1062; mTBI intervention F(1, 43) = 6.122, p = 0.0174; interaction genotype × mTBI: F(1, 43) = 1.058, p = 0.3093. Training session at 30 d: genotype F(1, 36) = 8.862, p = 0.0052; mTBI intervention F(1, 36) = 0.8784, p = 0.3549; interaction genotype × mTBI: F(1, 36) = 0.1934, p = 0.8902]. [Cue session at 5 d: genotype F(1, 43) = 2.317, p = 0.1353; mTBI intervention F(1, 43) = 0.1131, p = 0.7383; interaction genotype × mTBI: F(1, 43) = 0.1293, p = 0.7209. Cue session at 30 d: genotype F(1, 36) = 16.38, p = 0.0003; mTBI intervention F(1, 36) = 1.353, p = 0.2525; interaction genotype × mTBI: F(1, 36) = 0.8815, p = 0.3541]. [Contextual session at 5 d: genotype F(1, 43) = 5.895, p = 0.0194; mTBI intervention F(1, 36) = 0.2757, p = 0.6022; interaction genotype × mTBI: F(1, 43) = 0.0056, p = 0.9408]. (c) The freezing response was analyzed at 1-min intervals during the different trials in WT (black bars) and Shank311−/− (turquoise bars) mice. N = 10–14. Data are shown as mean ± SEM. Datasets were analyzed using three-way mixed ANOVA (genotype × mTBI intervention × time) including repetitive measures, and Bonferroni’s post hoc comparison test was performed. [Training at 5 d: genotype × mTBI intervention × time F(2,14) = 1.035, p = 0.416; mTBI intervention × time F(1,14) = 3.176, p < 0.0001; genotype × time F(1,14) = 1.568, p = 0.83. Training at 30 d: genotype × mTBI intervention × time F(2,14) = 0.281, p = 0.996; mTBI intervention × time F(1,14) = 0.725, p = 0.749; genotype × time F(1,14) = 3.868, p < 0.0001]. [Cue test at 5 d: genotype × mTBI intervention × time F(2,8) = 0.464, p = 0.881; mTBI intervention × time F(1,8) = 0.440, p = 0.897; genotype × time F(1,8) = 0.863, p = 0.548. Cue test at 30 d: genotype × mTBI intervention × time F(2,8) = 0.325, p = 0.956; mTBI intervention × time F(1,8) = 1.088, p = 0.372; genotype × time F(1,8) = 4.804, p < 0.0001]. [Contextual test at 5 d: genotype × mTBI intervention × time F(2,7) = 1.186, p = 0.311; mTBI intervention × time F(1,7) = 0.500, p = 0.835; genotype × time F(1,7) = 2.048, p = 0.49. Contextual test at 30 d: genotype × mTBI intervention × time F(2,7) = 3.898, p < 0.0001; mTBI intervention × time F(1,7) = 1.385, p = 0.212; genotype × time F(1,7) = 1.746, p = 0.099]. *: p < 0.05, ** p < 0.01; *** p < 0.001: comparison regarding WT sham animals; ++ p < 0.01; +++ p < 0.001: comparison regarding Shank311−/− sham animals.
Figure 8
Figure 8
Comparison and time-related changes of the main findings observed in this study between wild-type and Shank311−/− mice. (a) Comparison of the synaptic, (b) cellular, (c) molecular and (d) behavioral differences found between WT and Shank311−/− before and after the different time points evaluated after mTBI.

Similar articles

Cited by

References

    1. Poljac E., Hoofs V., Princen M.M., Poljac E. Understanding Behavioural Rigidity in Autism Spectrum Conditions: The Role of Intentional Control. J. Autism Dev. Disord. 2017;47:714–727. doi: 10.1007/s10803-016-3010-3. - DOI - PubMed
    1. Bralten J., van Hulzen K.J., Martens M.B., Galesloot T.E., Arias Vasquez A., Kiemeney L.A., Buitelaar J.K., Muntjewerff J.W., Franke B., Poelmans G. Autism spectrum disorders and autistic traits share genetics and biology. Mol. Psychiatry. 2018;23:1205–1212. doi: 10.1038/mp.2017.98. - DOI - PMC - PubMed
    1. Zoghbi H.Y., Bear M.F. Synaptic dysfunction in neurodevelopmental disorders associated with autism and intellectual disabilities. Cold Spring Harb. Perspect. Biol. 2012;4:a009886. doi: 10.1101/cshperspect.a009886. - DOI - PMC - PubMed
    1. Boccuto L., Lauri M., Sarasua S.M., Skinner C.D., Buccella D., Dwivedi A., Orteschi D., Collins J.S., Zollino M., Visconti P., et al. Prevalence of SHANK3 variants in patients with different subtypes of autism spectrum disorders. Eur. J. Hum. Genet. 2013;21:310–316. doi: 10.1038/ejhg.2012.175. - DOI - PMC - PubMed
    1. Durand C.M., Betancur C., Boeckers T.M., Bockmann J., Chaste P., Fauchereau F., Nygren G., Rastam M., Gillberg I.C., Anckarsater H., et al. Mutations in the gene encoding the synaptic scaffolding protein SHANK3 are associated with autism spectrum disorders. Nat. Genet. 2007;39:25–27. doi: 10.1038/ng1933. - DOI - PMC - PubMed

MeSH terms

LinkOut - more resources